
Comparative network analysis of nomophobia and mental health symptoms among college and middle school students
Vol.19,No.3(2025)

With the rapid advancement of technology, the number of smartphone users has increased dramatically, resulting in a rising prevalence of nomophobia. Previous research has indicated that nomophobia is particularly common among adolescents and young adults and has significant negative impacts on their mental health, including increased anxiety, stress, and depression. However, most existing studies have concentrated on single age group, lacking comparative analysis between adolescents and young adults despite their distinct developmental stages and associated psychological challenges. To address this gap, the present study recruited 693 middle school adolescents and 900 college students to compare the network structures of nomophobia and mental health symptoms between these two groups. Network analysis revealed several similarities across both groups, such as the consistently positive associations between the fear of being unable to access information and symptoms of anxiety, stress, and depression. However, significant differences were also identified. A network comparison test initially revealed five significant edge differences, two of which involved anxiety. To further examine these differences, the anxiety subscale was subdivided according to DSM-5 symptomatology. Subsequent network comparison tests identified seven edges that differed significantly between middle school and college students, including two edges specifically involving the relationship between nomophobia (particularly the fear of losing contact) and various anxiety symptoms. These findings enhance the understanding of the distinct network structures linking nomophobia with mental health symptoms in adolescents and young adults, offering valuable insights for designing age-specific interventions aimed at reducing its detrimental effects on mental health.
nomophobia; mental health; network comparison; age difference; adolescents; young adults
Shixiu Ren
Faculty of Psychology, Tianjin Normal University, Tianjin, China
Shixiu Ren is a Ph.D., whose research centers on the impact of mobile phone use on individual mental health.
Xiaoxu Lu
Collaborative Innovation Center of Assessment for Basic Education Quality, Beijing Normal University, Beijing, China
Xiaoxu Lu, a Ph.D. student at Beijing Normal University. Her research focuses on investigating the factors influencing mental well-being and developmental trajectories among students.
Shihui Ren
Faculty of Electronic Information Technology and Electrical Engineering, Tianshui Normal University, Gansui, China
Shihui Ren, an undergraduate student majoring in Computer Science and Technology. She is interested in applying advanced techniques from the field of computer science to predict and assess students’ mental health.
Manyuan Li
Faculty of Psychology, Tianjin Normal University, Tianjin, China
Manyuan Li, a Master student at Tianjin Normal University. Her research focuses on understanding the complex interactions within network structures and their implications for mobile phone-related issues.
Tour Liu
Faculty of Psychology, Tianjin Normal University, Tianjin; Key Research Base of Humanities and Social Sciences of the Ministry of Education, Academy of Psychology and Behavior, Tianjin Normal University, Tianjin; Center of Collaborative Innovation for Assessment and Promotion of Mental Health, Tianjin Normal University, Tianjin, China
Tour Liu, an associate professor at Tianjin Normal University, specializes in substance and non-substance addiction, and develops advanced psychometric methods to improve the accuracy of psychological and educational assessments.
Abdoli, N., Sadeghi-Bahmani, D., Salari, N., Khodamoradi, M., Farnia, V., Jahangiri, S., Brühl, A. B., Dürsteler, K. M., Stanga, Z., & Brand, S. (2023). Nomophobia (no mobile phone phobia) and psychological health issues among young adult students. European Journal of Investigation in Health, Psychology and Education, 13(9), 1762–1775. https://doi.org/10.3390/ejihpe13090128
Aloka, P. J. (2023). Age differences and adjustment among freshmen at one selected public university. Social Sciences and Education Research Review, 10(1), 111–118. https://doi.org/10.5281/zenodo.8151099
Bor, W., Dean, A. J., Najman, J., & Hayatbakhsh, R. (2014). Are child and adolescent mental health problems increasing in the 21st century? A systematic review. Australian & New Zealand Journal of Psychiatry, 48(7), 606–616. https://doi.org/10.1177/0004867414533834
Bringmann, L. F., Elmer, T., Epskamp, S., Krause, R. W., Schoch, D., Wichers, M., Wigman, J. T. W., & Snippe, E. (2019). What do centrality measures measure in psychological networks? Journal of Abnormal Psychology, 128(8), 892–903. https://doi.org/10.1037/abn0000446
Camberis, A.-L., McMahon, C. A., Gibson, F. L., & Boivin, J. (2014). Age, psychological maturity, and the transition to motherhood among English-speaking Australian women in a metropolitan area. Developmental Psychology, 50(8), 2154–2164. https://doi.org/10.1037/a0037301
China Internet Network Information Center. (2024). The 53rd statistical report on the development of China’ s internet from CNNIC. https://www.cnnic.cn/NMediaFile/2024/0325/MAIN1711355296414FIQ9XKZV63.pdf
Daei, A., Ashrafi-Rizi, H., & Soleymani, M. R. (2019). Nomophobia and health hazards: Smartphone use and addiction among university students. International Journal of Preventive Medicine, 10(1), Article 202. https://doi.org/10.4103%2Fijpvm.IJPVM_184_19
Di Blasi, M., Gullo, S., Mancinelli, E., Freda, M. F., Esposito, G., Gelo, O. C. G., Lagetto, G., Gioradano, C., Mazzeschi, C., Pazzagli, C., Salcuni, S., & Coco, G. L. (2021). Psychological distress associated with the COVID-19 lockdown: A two-wave network analysis. Journal of Affective Disorders, 284, 18–26. https://doi.org/10.1016/j.jad.2021.02.016
Ding, S., Shi, W., Ding, L., Chen, Y., Dai, J., Yuan, H., & Zhou, G. (2024). The relationship between life events, life satisfaction, and coping style of college students. Psychology, Health & Medicine, 29(2), 398–409. https://doi.org/10.1080/13548506.2022.2115181
Elhai, J. D., Yang, H. B, Fang, J. W., Bai, X. J., & Hall, B. J. (2020). Depression and anxiety symptoms are related to problematic smartphone use severity in Chinese young adults: Fear of missing out as a mediator. Addictive Behaviors, 101, Article 105962. https://doi.org/10.1016/j.addbeh.2019.04.020
Epskamp, S., Cramer, A. O. J., Waldorp, L. J., Schmittmann, V. D., & Borsboom, D. (2012). Qgraph: Network visualizations of relationships in psychometric data. Journal of Statistical Software, 48(4), 1–18. https://doi.org/10.18637/jss.v048.i04
Epskamp, S., Borsboom, D., & Fried, E. I. (2018). Estimating psychological networks and their accuracy: A tutorial paper. Behavior Research Methods, 50(1), 195–212. https://doi.org/10.3758/s13428-017-0862-1
Erentaitė, R., Vosylis, R., Gabrialavičiūtė, I., & Raižienė, S. (2018). How does school experience relate to adolescent identity formation over time? Cross-lagged associations between school engagement, school burnout and identity processing styles. Journal of Youth and Adolescence, 47(4), 760–774. https://doi.org/10.1007/s10964-017-0806-1
Gong, X., Xie, X.-y., Xu, R., & Luo, Y.-j. (2010). 抑郁-焦虑-压力量表简体中文版(DASS-21)在中国大学生中的测试报告[Psychometric properties of the Chinese versions of DASS-21 in Chinese college students]. Chinese Journal of Clinical Psychology, 18(4), 443–446. https://d.wanfangdata.com.cn/periodical/zglcxlxzz201004012
Hirsh-Yechezkel, G., Mandelzweig, L., Novikov, I., Bar-Yosef, N., Livneh, I., Oren, M., Waysberg, R., & Sadetzki, S. (2019). Mobile phone-use habits among adolescents: Predictors of intensive use. Cyberpsychology, Behavior, and Social Networking, 22(3), 212–219. https://doi.org/10.1089/cyber.2018.0177
Jahrami, H., Trabelsi, K., Boukhris, O., Hussain, J. H., Alenezi, A. F., Humood, A., Saif, Z., Pandi-Perumal, S. R., & Seeman, M. V. (2022). The prevalence of mild, moderate, and severe nomophobia symptoms: A systematic review, meta-analysis, and meta-regression. Behavioral Sciences, 13(1), Article 35. https://doi.org/10.3390/bs13010035
Jones, S. R., & Abes, E. S. (2013). Identity development of college students: Advancing frameworks for multiple dimensions of identity. John Wiley & Sons.
Kassis, W., Dueggeli, A., Govaris, C., Kassis, M., Dittmar, M., Aksoy, D., & Favre, C. A. (2024). Longitudinal negotiation, navigation processes, and school success in high school: A two-wave latent transition approach. Adversity and Resilience Science, 5(3), 219–240. https://doi.org/10.1007/s42844-024-00126-3
King, A. L. S., Valenca, A. M., Silva, A. C. O., Baczynski, T., Carvalho, M. R., & Nardi, A. E. (2013). Nomophobia: Dependency on virtual environments or social phobia?. Computers in Human Behavior, 29(1), 140–144. https://doi.org/10.1016/j.chb.2012.07.025
King, A. L. S., Valenca, A. M., Silva, A. C., Sancassiani, F, Machado, S, & Nardi, A. E. (2014). “Nomophobia”: Impact of cell phone use interfering with symptoms and emotions of individuals with panic disorder compared with a control group. Clinical Practice & Epidemiology in Mental Health, 10(1), 28–35. https://doi.org/10.2174/1745017901410010028
Kisely, S., Sawyer, E., Siskind, D., & Lalloo, R. (2016). The oral health of people with anxiety and depressive disorders–a systematic review and meta-analysis. Journal of Affective Disorders, 200, 119–132. https://doi.org/10.1016/j.jad.2016.04.040
Kuscu, T. D., Gumustas, F., Rodopman Arman, A., & Goksu, M. (2021). The relationship between nomophobia and psychiatric symptoms in adolescents. International Journal of Psychiatry in Clinical Practice, 25(1), 56–61. https://doi.org/10.1080/13651501.2020.1819334
Langenkamp, A. G. (2010). Academic vulnerability and resilience during the transition to high school: The role of social relationships and district context. Sociology of Education, 83(1), 1–19. https://doi.org/10.1177/0038040709356563
Li, J. L., Chen, X., Zhao, C. H., & Xu, Y. (2016). 中国儿童青少年抑郁症状流行率的Meta分析 [Prevalence of depression in Chinese children and adolescents: A Meta-analysis]. Chinese Journal of Child Health Care, 24(3), 295–298. http://cjchc.xjtu.edu.cn/CN/10.11852/zgetbjzz2016-24-03-22
Li, W., Zhao, Z., Chen, D., Peng, Y., & Lu, Z. (2022). Prevalence and associated factors of depression and anxiety symptoms among college students: A systematic review and meta-analysis. Journal of Child Psychology and Psychiatry, 63(11), 1222–1230. https://doi.org/10.1111/jcpp.13606
Lovibond, P. F., & Lovibond, S. H. (1995). The structure of negative emotional states: Comparison of the depression anxiety stress scales (DASS) with the Beck depression and anxiety inventories. Behavior Research and Therapy, 33(3), 335–343. https://doi.org/10.1016/0005-7967(94)00075-U
Mihailidis, P. (2014). A tethered generation: Exploring the role of mobile phones in the daily life of young people. Mobile Media & Communication, 2(1), 58–72. https://doi.org/10.1177/2050157913505558
Newman, B. M., Lohman, B. J., Newman, P. R., Myers, M. C., & Smith, V. L. (2000). Experiences of urban youth navigating the transition to ninth grade. Youth & Society, 31(4), 387–416. https://doi.org/10.1177/0044118X00031004001
Newman, D. A. (2014). Missing data: Five practical guidelines. Organizational Research Methods, 17(4), 372–411. https://doi.org/10.1177/1094428114548590
Notara, V., Vagka, E., Gnardellis, C., & Lagiou, A. (2021). The emerging phenomenon of nomophobia in young adults: A systematic review study. Addiction & health, 13(2), 120–135. https://doi.org/10.22122%2Fahj.v13i2.309
Podsakoff, P. M., MacKenzie, S. B., Lee, J.-Y., & Podsakoff, N. P. (2003). Common method biases in behavioral research: A critical review of the literature and recommended remedies. Journal of Applied Psychology, 88(5), 879–903. https://doi.org/10.1037/0021-9010.88.5.879
Ren, S. X., Guli, G. N., & Liu, T. (2020). 中文版无手机恐惧量表的修订 [Revisement of Nomophobia scale for Chinese]. Psychological Exploration, 40(3), 247–253. https://psytxjx.jxnu.edu.cn//oa/darticle.aspx?type=view&id=202003009
Ren, S., Ji, S., Liu, X., & Liu, T. (2024). Exploring the structure of college students’ adaptability by using cross-lagged path analysis: The role of emotional adaptability. PsyCh Journal, 13(2), 276–286. https://doi.org/10.1002/pchj.721
Rodríguez-García, A.-M., Moreno-Guerrero, A.-J., & López Belmonte, J. (2020). Nomophobia: An individual’s growing fear of being without a smartphone—a systematic literature review. International Journal of Environmental Research and Public Health, 17(2), Article 580. https://doi.org/10.3390/ijerph17020580
Schwaiger, E., & Tahir, R. (2022). The impact of nomophobia and smartphone presence on fluid intelligence and attention. Cyberpsychology: Journal of Psychosocial Research on Cyberspace, 16(1), Article 5. https://doi.org/10.5817/CP2022-1-5
Sharma, M., Mathur, D. M., & Jeenger, J. (2019). Nomophobia and its relationship with depression, anxiety, and quality of life in adolescents. Industrial Psychiatry Journal, 28(2), 231–236. https://doi.org/10.4103/ipj.ipj_60_18
Silvers, J. A. (2022). Adolescence as a pivotal period for emotion regulation development. Current Opinion in Psychology, 44, 258–263. https://doi.org/10.1016/j.copsyc.2021.09.023
Subrahmanyam, K., Frison, E., & Michikyan, M. (2020). The relation between face‐to‐face and digital interactions and self‐esteem: A daily diary study. Human Behavior and Emerging Technologies, 2(2), 116–127. https://doi.org/10.1002/hbe2.187
Tao, Y., Hou, W., Niu, H., Ma, Z., Zhang, S., Zhang, L., & Liu, X. (2024). Centrality and bridge symptoms of anxiety, depression, and sleep disturbance among college students during the COVID-19 pandemic—a network analysis. Current Psychology, 43(15), 13897–13908. https://doi.org/10.1007/s12144-022-03443-x
Tolan, O. C., & Karahan, S. (2022). The relationship between nomophobia and depression, anxiety and stress levels of university students. International Journal of Psychology and Educational Studies, 9(1), 115–129. https://dx.doi.org/10.52380/ijpes.2022.9.1.559
Torpil, B., Bahadır, Z., Yılmaz, G. G., & Pekçetin, S. (2022). Comparison of sleep quality and sleepiness in university students with different levels of nomophobia. International Journal of Disabilities Sports and Health Sciences, 5(1), 9–15. https://doi.org/10.33438/ijdshs.1056095
Van Borkulo, C. D., van Bork, R., Boschloo, L., Kossakowski, J. J., Tio, P., Schoevers, R. A., Borsboom, D., & Waldorp, L. J. (2023). Comparing network structures on three aspects: A permutation test. Psychological Methods, 28(6), 1273–1285. https://doi.org/10.1037/met0000476
Van Loo, H. M., Van Borkulo, C. D., Peterson, R. E., Fried, E. I., Aggen, S. H., Borsboom, D., & Kendler, K. S. (2018). Robust symptom networks in recurrent major depression across different levels of genetic and environmental risk. Journal of Affective Disorders, 227, 313–322. https://doi.org/10.1016/j.jad.2017.10.038
Verhoeven, M., Poorthuis, A. M. G., & Volman, M. (2019). The role of school in adolescents’ identity development. A literature review. Educational Psychology Review, 31(1), 35–63. https://doi.org/10.1007/s10648-018-9457-3
Xie, X., Wang, Y., Wang, P., Zhao, F., & Lei, L. (2018). Basic psychological needs satisfaction and fear of missing out: Friend support moderated the mediating effect of individual relative deprivation. Psychiatry Research, 268(1), 223–228. https://doi.org/10.1016/j.psychres.2018.07.025
Yen, P. H., Nhung, N. T. N., & Le, T. T. (2024). Impact of time in college on learner autonomy: A comparative study on English-major students with different academic years. International Journal of Instruction, 17(1), 461–478. https://doi.org/10.29333/iji.2024.17124a
Yildirim, C., & Correia, A.-P. (2015). Exploring the dimensions of nomophobia: Development and validation of a self-reported questionnaire. Computers in Human Behavior, 49, 130–137. https://doi.org/10.1016/j.chb.2015.02.059
Zhou, H., & Long, L. (2004). Statistical remedies for common method biases. Advances in Psychological Science, 12(6), 942–950. https://journal.psych.ac.cn/adps/EN/Y2004/V12/I06/942
Authors’ Contribution
Shixiu Ren: conceptualization, methodology, software, writing—original draft, writing—reviewing & editing. Xiaoxu Lu: conceptualization, data curation, investigation. Shihui Ren: software, data curation. Manyuan Li: Data curation. Tour Liu: conceptualization, methodology, writing—reviewing & editing.
Editorial Record
First submission received:
September 16, 2024
Revisions received:
May 7, 20025
May 26, 2025
Accepted for publication:
June 6, 2025
Editor in charge:
Maèva Flayelle
Introduction
According to the 53rd Statistical Report on Internet Development in China, the number of smartphone users in the country has reached 1,091 billion (China Internet Network Information Center, 2024). This widespread smartphone adoption has led to a concerning increase in excessive usage, resulting in a phenomenon known as nomophobia. Nomophobia, an abbreviation for “no mobile phone phobia,” was introduced by the UK-based research organization YouGov in 2008 (Ren et al., 2020). It is defined as the distress or anxiety experienced when losing access to one’s mobile phone, such as due to battery depletion or inability to use it in the class, and is driven by the fear of missing out (FOMO) theory (King et al., 2013; King et al., 2014; Rodriguez-Garcia et al., 2020). Nomophobia is notably prevalent among younger populations, particularly in adolescents (aged 10 to 17) and young adults (aged 18 to 25), who are early adopters of emerging technologies and digital platforms (Daei et al., 2019; Notara et al., 2021). For instance, a meta-analysis by Jahrami et al. (2022) reported that nomophobia prevalence was highest among university students (97.4%), followed by adolescents in middle and high school (84.2%), underscoring the high susceptibility to nomophobia within these two groups.
Nomophobia has been shown to adversely impact various aspects of adolescents’ and university students’ lives, including their sleeping quality (Torpil et al., 2022), physical health (Daei et al., 2019), attention (Schwaiger & Tahir, 2022), and academic performance (Rodriguez-Garcia et al., 2020). Moreover, several studies have highlighted the increasing negative impact of nomophobia on the mental health of adolescents and young adults, with symptoms such as heightened anxiety, stress, and depression becoming more prevalent (Abdoli et al., 2023; Kuscu et al., 2021; Sharma et al., 2019; Tolan & Karahan, 2021). For instance, Sharma et al. (2019) identified a significant correlation between nomophobia and mental health symptoms, including anxiety and depression, within an adolescent population. Similarly, Abdoli et al. (2023) demonstrated a substantial relationship between nomophobia and mental health concerns among young adults, revealing that individuals with higher levels of nomophobia tend to experience greater anxiety, stress, and depressive symptoms.
Adolescents in middle school and young adults in college represent distinct developmental stages, each characterized by unique psychological and social challenges. Middle school students, particularly in the Chinese context, are in a critical phase of identity formation while simultaneously preparing for future high-stakes examinations such as the college entrance exam “Gaokao” (Erentaite et al., 2018; Newman et al., 2000). During this stage, students commonly face pressures related to academic achievement, peer relationships, and the development of a coherent self-concept (Kassis et al., 2024; Langenkamp, 2010; Verhoeven et al., 2019). In contrast, college students encounter a wider range of developmental tasks, including the pursuit of greater autonomy (Ren et al., 2024; Yen et al., 2024), as well as the challenges associated with financial independence, career planning, the formation of professional identity, and navigating complex social and intimate relationships (Jones & Abes, 2013; Subrahmanyam et al., 2020). Given these differing challenges and life demands, it is not surprising that adolescents in middle school and young adults in college use their mobile phones for different purposes (Hirsh-Yechezkel et al., 2019; Mihailidis, 2014), which might in turn leads to varying manifestations of nomophobia. Moreover, if they are unable to effectively manage these challenges, it could result in heightened anxiety, stress, and an increased risk of depression (Bor et al., 2014). For instance, meta-analyses have shown that the prevalence of depressive symptoms and major depressive disorder among Chinese adolescents is 15.4% (Li et al., 2016), while among college students, the prevalence of depressive symptoms rises to 33.6% (Li et al., 2022). Therefore, it is crucial to compare how nomophobia and mental health are related across these two groups, as the psychological and social dynamics influencing these relationships may differ significantly. This comparison helps to understand the specific ways nomophobia impacts mental health at different stages of life, thereby informing targeted interventions.
However, prior studies examining nomophobia and mental health have primarily concentrated on specific age groups, either adolescents or young adults, and has employed traditional statistical methods such as correlation analysis or regression model (Kuscu et al., 2021; Sharma et al., 2019; Tolan & Karahan, 2021). Consequently, there is a significant gap in the literature regarding comparative studies that not only examine the relationships between multiple dimensions of nomophobia and various mental health symptoms but also compare these relationships across middle school and college student populations. The Network Comparison Test (NCT), a statistical technique used in psychological research, allows for the detection of significant differences in the structural relationship among variables across distinct groups (Van Borkulo et al., 2023). Employing a comparative approach enables a deeper understanding of how nomophobia related with mental health across middle school and college student populations. Such insights are crucial for developing tailored interventions that effectively address the distinct needs of each group, thereby improving outcomes in managing nomophobia and associated mental health symptoms.
Therefore, the present study aims to examine differences in the relationships between nomophobia and mental health symptoms among middle school and college students through network analysis. The analysis proceeds in three steps. First, independent t-tests are conducted as a preliminary analysis to examine differences between middle school and college students. Next, separate network models illustrating the connections between nomophobia and mental health symptoms are constructed independently for each group. Finally, the NCT is utilized to statistically evaluate structural differences in the nomophobia-mental health networks between these two groups. This methodological framework allows for an in-depth exploration of the specific ways nomophobia and mental health symptoms are connected, providing valuable insights into age-related differences. By identifying these differences, the current study aims to inform targeted prevention and support strategies tailored to address the unique developmental needs of adolescents and young adults, ultimately enhancing the efficacy of interventions designed to mitigate the adverse effects of nomophobia.
Methods
Participants
This study recruited two distinct sample groups: one consisting of middle school students and the other of college students, with data collected in May 2024. Utilizing a convenience sampling method, the research aimed to assess the difference of the relationship between nomophobia and mental health symptoms across two groups. All participants consented to the use of their data, and the study was approved by the Human Research Protection Committee of Tianjin Normal University in China (ethical review number: XL2020-08).
For the middle school group, 785 students from 7th to 9th grade completed a 5-minute survey administered via paper-pencil questionnaires. Univariate statistical analyses were conducted for each item to assess the extent of missing data. The results revealed that the missing rate for all items ranged from 0.0% to 1.8%. When the missing data rate was below 10.0%, no significant differences were found between the result obtained using different methods of handling missing values (Newman, 2014). Thus, 92 students with missing data were excluded from the final analysis. The final sample included 693 middle school students, with 389 boys (56.1%) and 304 girls (43.9%), and an average age of 14.009 years (SD = 1.028).
In the college group, 945 students participated, completing a similar 5-minute survey either online (via the Wen Juan Xing App; www.wjx.cn) or through paper-pencil questionnaires. Univariate statistical analyses were conducted to assess the missing data. The results revealed that the missing rate for all items ranged from 0.0% to 0.5%. After excluding 45 students with missing responses, the final sample included 900 college students, including 297 males (33.0%) and 603 females (67.0%), with an average age of 20.448 years (SD = 2.450). This group included 300 freshmen and 600 non-freshmen.
Measurements
The Chinese Version of the Nomophobia Questionnaire
The Chinese version of the Nomophobia Questionnaire was adapted by Ren et al. (2020) from the original Nomophobia Questionnaire developed by Yildirim and Correia (2015). This scale assesses nomophobia through four dimensions: the fear of being unable to access information, losing convenience, losing contact, and losing internet connectivity. It comprises 16 items, with 4 items dedicated to each dimension. An example item is I would feel uncomfortable without constant access to information through my smartphone. Responses are measured using a 7-point Likert scale, ranging from 1 (not met at all) to 7 (completely in conformity with), with higher scores reflecting greater levels of nomophobia. For college students, the overall Cronbach’s α was .949, with individual dimension scores ranging from .836 to .918. The ω coefficient of the whole scale was .949 for college students. For middle school students, the overall Cronbach’s α was .952, and the dimension scores ranged from .851 to .933. The ω coefficient of the whole scale was .952 for middle school students. The results of the CFA fit indices were excellent for middle school students (χ2 = 391.807, p < .001, df = 98.000, CFI = .944, TLI = .931, SRMR = .055, RMSEA = .066), as well as for college students (χ2 = 515.792, p < .001, df = 98.000, CFI = .946, TLI = .934, SRMR = .042, RMSEA = .069).
The Chinese Short Version of the Depression, Anxiety, and Stress Scale
The Chinese short version of the Depression-Anxiety-Stress Scale (DASS-21) was revised by Gong et al. (2010) from the original DASS developed by Lovibond and Lovibond (1995). The DASS-21 comprises three subscales—depression, anxiety, and stress—with 21 items in total, distributed evenly across the dimensions, with 7 items per subscale. An example item is I feel depressed and frustrated. Responses are measured on a 4-point Likert scale, ranging from 1 (Did not apply to me at all) to 4 (Applied to me very much). For college students, the overall Cronbach’s α was .913, with subscale scores ranging from .836 to .918. The ω coefficient of the whole scale was .914 for college students. Among middle school students, the overall Cronbach’s α was .951, with subscale scores ranging from .765 to .836. The ω coefficient of the whole scale was .951 for middle school students. The results of the CFA fit indices were excellent for middle school students (χ2 = 574.837, p < .001, df = 183, CFI = .923, TLI = .911, SRMR = .043, RMSEA = .056), as well as for college students (χ2 = 515.482, p <.001, df = 183, CFI = .932, TLI = .922, SRMR = .041, RMSEA = .045).
Software and Statistical Methods
Initially, independent t-tests and descriptive analyses were conducted using SPSS 26 to examine the differences between middle school and college students. Subsequently, network models for mental health and nomophobia were independently constructed for each group using Gaussian Graphical Models (GGM) via the R package qgraph (Epskamp et al., 2012). Network analysis, originally developed for sociology, has recently been applied to psychology, where nodes represent variables (e.g., mental health symptoms) and edges represent the relationships between these variables (Di Blasi et al., 2021). The Extended Bayesian Information Criterion Graphical Least Absolute Shrinkage and Selection Operator (EBICGLASSO) algorithm was employed to derive a sparse partial correlation matrix, focusing on the most significant connections (Epskamp et al., 2018). To assess the importance of each node, two centrality indices were used in the study: strength centrality and betweenness centrality (Tao et al., 2024). Strength centrality measures the total connections a node has with directly linked nodes, reflecting its overall influence. Betweenness centrality indicates how frequently a node lies on the shortest path between two other nodes, acting as a “bridge” that connects different parts of the network. Nodes with high betweenness centrality are crucial for maintaining network cohesion and facilitating interactions between otherwise distant variables. These centrality indices were calculated using the R package qgraph (Epskamp et al., 2012) to evaluate the relative importance of each variable in the network. Finally, the Network Comparison Test (NCT) was used to detect differences in the network structures of mental health and nomophobia between the two groups. The NCT evaluated disparities in network structure invariance, global strength invariance, and single edge invariance (Van Borkulo et al., 2023), with 1,000 permutations performed in this study. Global strength invariance assesses whether the overall connectivity of the networks differs between groups by evaluating the total strength of all edges. A p-value smaller than .050 for global strength invariance indicates a significant difference in the overall connectivity of the networks. Network structure invariance compares the patterns of connections between nodes to determine if the overall structure of the networks differs. A p-value smaller than .050 for network structure invariance indicates a significant difference in whole network structure. Single edge invariance focuses on comparing the strength of individual edges to identify node relationships that vary significantly across groups. A p-value smaller than .050 for a specific edge indicates a significant difference in that edge between groups. The advantage of NCT lies in its ability to reveal complex, multidimensional differences between groups without relying on a single variable (Van Loo et al., 2018), making it particularly useful for understanding the relationship of mental health and nomophobia and how these relationships differ across populations.
Results
Preliminary Analyses
The results of Harman’s single factor test revealed that there were seven factors had eigenvalues greater than 1 for college students. The first factor accounted for only 30.4% of the variance, which is below the critical threshold of 40.0% (Podsakoff et al., 2003; Zhou & Long, 2004), suggesting the absence of common method bias in the study. Similarly, for middle school students, the test revealed seven factors with eigenvalues greater than 1 for middle school students. The first factor explained only 37.3% of the variance, also falling below the 40.0% threshold, further indicating no common method bias in the study.
Descriptive Results
The results of the independent t-test for the two groups are presented in Table 1. As indicated, significant differences were observed between middle school and college students across the four dimensions of nomophobia and stress. Specifically, college students reported significantly higher levels of stress compared to middle school students and demonstrated higher scores across all four dimensions of nomophobia. Conversely, no significant differences were detected between the two groups concerning anxiety and depression levels.
Table 1. Descriptive and Mean Differences for the Mental Health Symptoms and Nomophobia.
|
Variables |
M (SD) |
t |
|
|
College student |
Middle school student |
||
|
INFO |
13.892 (5.501) |
10.354 (6.285) |
11.745*** |
|
CONV |
14.740 (6.102) |
9.838 (6.861) |
15.053*** |
|
CONT |
17.097 (6.248) |
11.896 (7.951) |
14.617*** |
|
INTE |
14.083 (6.308) |
9.131 (7.045) |
14.760*** |
|
DEP |
11.120 (3.490) |
10.837 (4.524) |
1.410 |
|
ANX |
11.254 (3.191) |
11.268 (4.406) |
0.073 |
|
STR |
12.372 (3.589) |
11.576 (4.533) |
3.914*** |
|
Notes. STR-stress; ANX-anxiety; DEP-depression; INFO-fear of being unable to access information; CONV-fear of losing convenience; CONT-fear of losing contact; INTE-fear of losing internet connectivity; ***p < .001 |
|||
Network Structure Comparison for Nomophobia and Mental Health Symptoms
In this section, two separate network analysis were conducted to investigate the network structure between the four dimensions of nomophobia and three mental health symptoms within each group. Figure 1 presented the network structure of the four dimensions of nomophobia and three mental health symptoms. To assess the consistency and stability of the network, the bootstrap method in the bootnet package was applied. The reliability of the connections in the network was tested using the bootstrap method. After 1,000 bootstrap iterations, the bootstrapped confidence intervals for the weights of the network connections between nomophobia and mental health symptoms indicated that the estimated connections were stable and genuine. For details, refer to Figure A1, where the left side shows the network for middle school students, and the right side shows the network for college students. Regarding network centrality, for college students, the correlation stability coefficients were .594 for node strength and .206 for node betweenness, indicating that these indices remained correlated with the original data (r = .700) even after removing 59.4% of the data for node strength and 20.6% for node betweenness. For middle school students, the correlation stability coefficients were .672 for node strength and .051 for node betweenness, suggesting that these indices remained correlated with the original data (r = .700) even after removing 67.2% of the data for node strength and 5.1% for node betweenness. According to Bringmann et al. (2019), strength centrality is particularly suitable as a measure of node importance in psychological networks. Therefore, based on Epskamp et al. (2018), a stability coefficient greater than .250 is considered indicative of a stable measure. The bootstrapped stability analysis confirmed that the network demonstrated good stability for both college and middle school students. For further details, see Figure A2.
According to Figure 1, similarities were observed in the relationship between nomophobia and mental health symptoms among college students and middle school adolescents. For example, the fear of being unable to access information was significantly correlated with depression, anxiety, and stress in both college and middle school students. Specifically, correlation coefficients ranged from .016 to .055 for college students and from .011 to .085 for middle school students. Similar relationships were also observed across other dimensions (see Figure 1 and Table A2 and Table A3 for detailed results). Moreover, Figure 2 illustrated the centrality indices for various nodes within the networks of both middle school and college students. In both networks, stress exhibited the highest strength centrality, highlighting its central role in the experience of nomophobia and mental health symptoms. Besides, while stress also showed the highest betweenness centrality in the middle school network, the fear of losing convenience emerged as the most influential node in terms of betweenness centrality for college students. These findings suggest that while stress plays a central role in both groups, the fear of losing convenience holds additional importance within the college students’ network.
Furthermore, differences were also identified in the relationship between nomophobia and mental health symptoms across college students and middle school adolescents. To rigorously compares the differences in network structure between the two groups, the NCT method was applied, evaluating the networks from three critical perspectives: global strength, network structure, and individual edges. The NCT results indicate that the invariance of global strength (S = .133, p = .036 is statistically significant, suggesting that the observed differences in network structure are not merely artifacts of sampling variability or error but reflect meaningful distinctions. Furthermore, the results reveal an invariant network structure (M = .162, p = .032), indicating that at least one edge significantly differs between the networks of the two groups. Consequently, we performed exploratory post hoc testing of all edges to investigate which edge(s) differed between networks. The results indicated that five edges differed significantly between the two groups, with two involving the relationship between anxiety and nomophobia. Specifically, the relationship between students’ nomophobia related to the fear of losing convenience and anxiety was significantly different (E = .058, p = .006). A significant correlation was found among middle school students (r = .059, p < .050), whereas no significant relationship was observed in the college student group (r = .000). Another significant difference was noted in the relationship between nomophobia related to the fear of losing internet connectivity and anxiety (E = .044, p = .039), with a negative correlation in middle school students (r = −.023, p < .050) and a positive correlation in college students (r = .020, p < .050). A third differing edge was found in the relationship between the fear of losing internet connectivity and stress (E = .080, p = .026), showing a significant correlation in college students (r = .036, p < 0.050) but not in middle school students (r = .000). The remaining two differing edges were between the dimensions of nomophobia, specifically the fear of being unable to access information-fear of losing contact (E = .162, p = .004) and the fear of being unable to access information-fear of losing internet connectivity (E = .116, p = .039).
Figure 1. Network Structure of Mental Health and Nomophobia for Middle School and College Students.
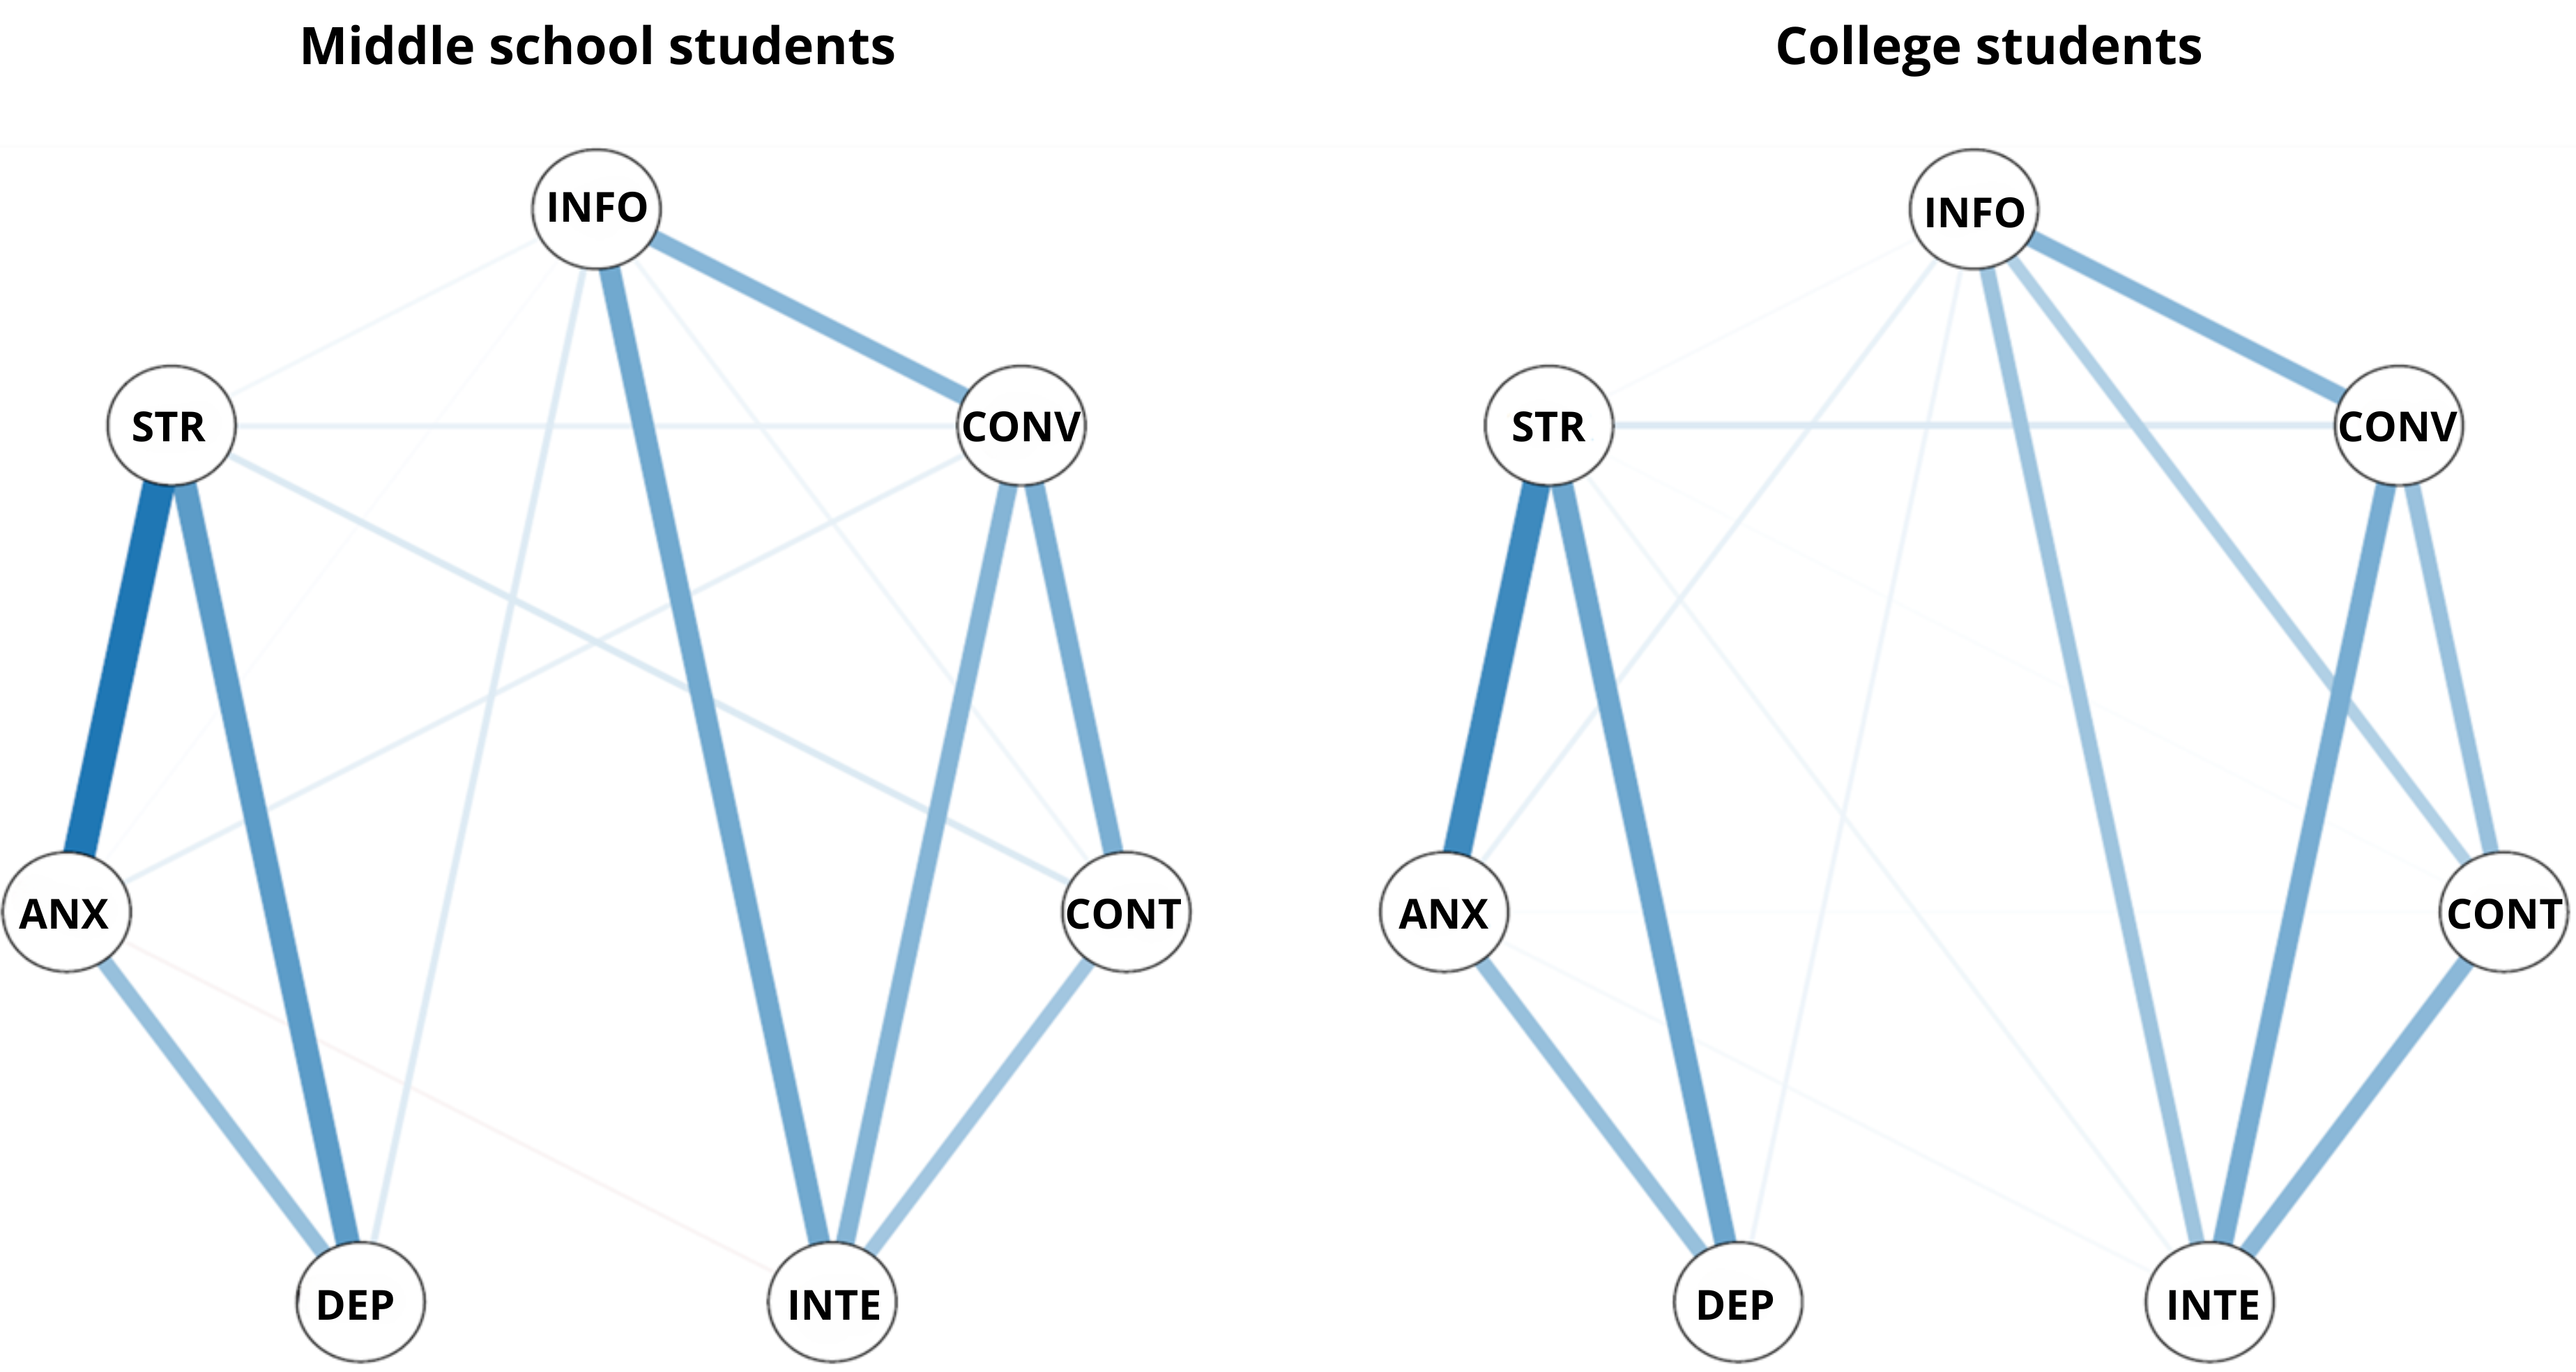
Note. (1) Blue edges represent positive relations and red edges represent negative relations between the network nodes. Greater width of edge indicates stronger associations between the nodes. (2) STR-stress; ANX-anxiety; DEP-depression; INFO-fear of being unable to access information; CONV-fear of losing convenience; CONT-fear of losing contact; INTE-fear of losing internet connectivity.
Figure 2. Centrality Indices of Mental Health and Nomophobia Networks for Middle School and College Students.
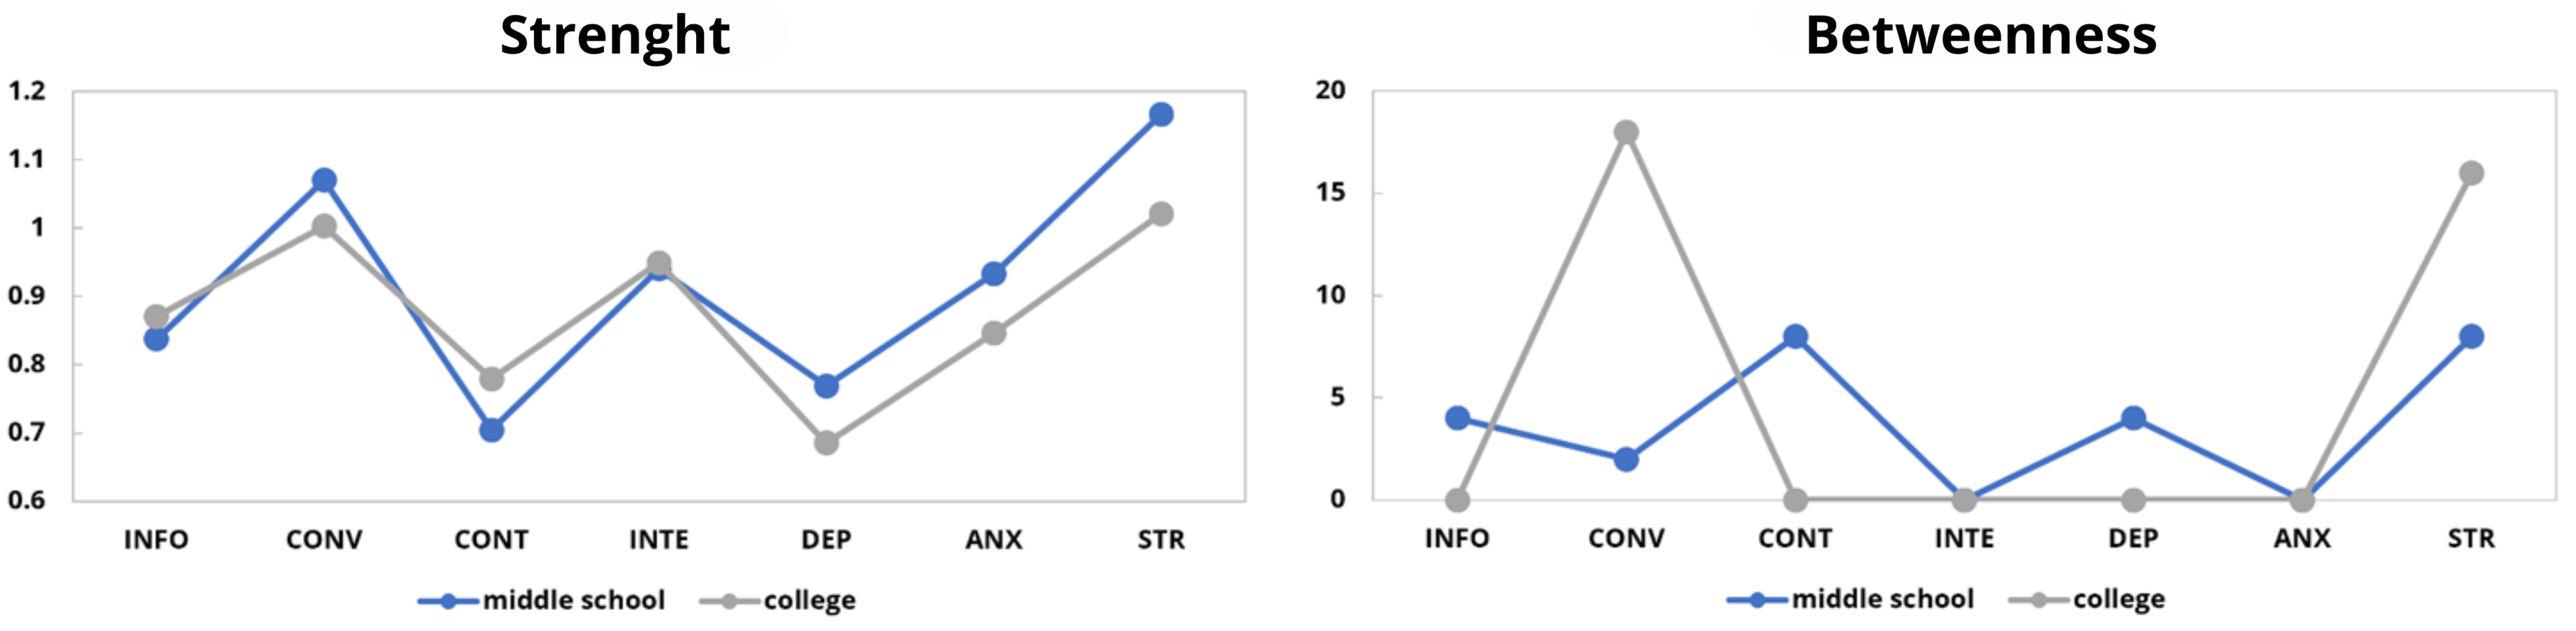
Note. STR-stress; ANX-anxiety; DEP-depression; INFO-fear of being unable to access information; CONV-fear of losing convenience; CONT-fear of losing contact; INTE-fear of losing internet connectivity.
Further Network Comparison for Nomophobia and Anxiety
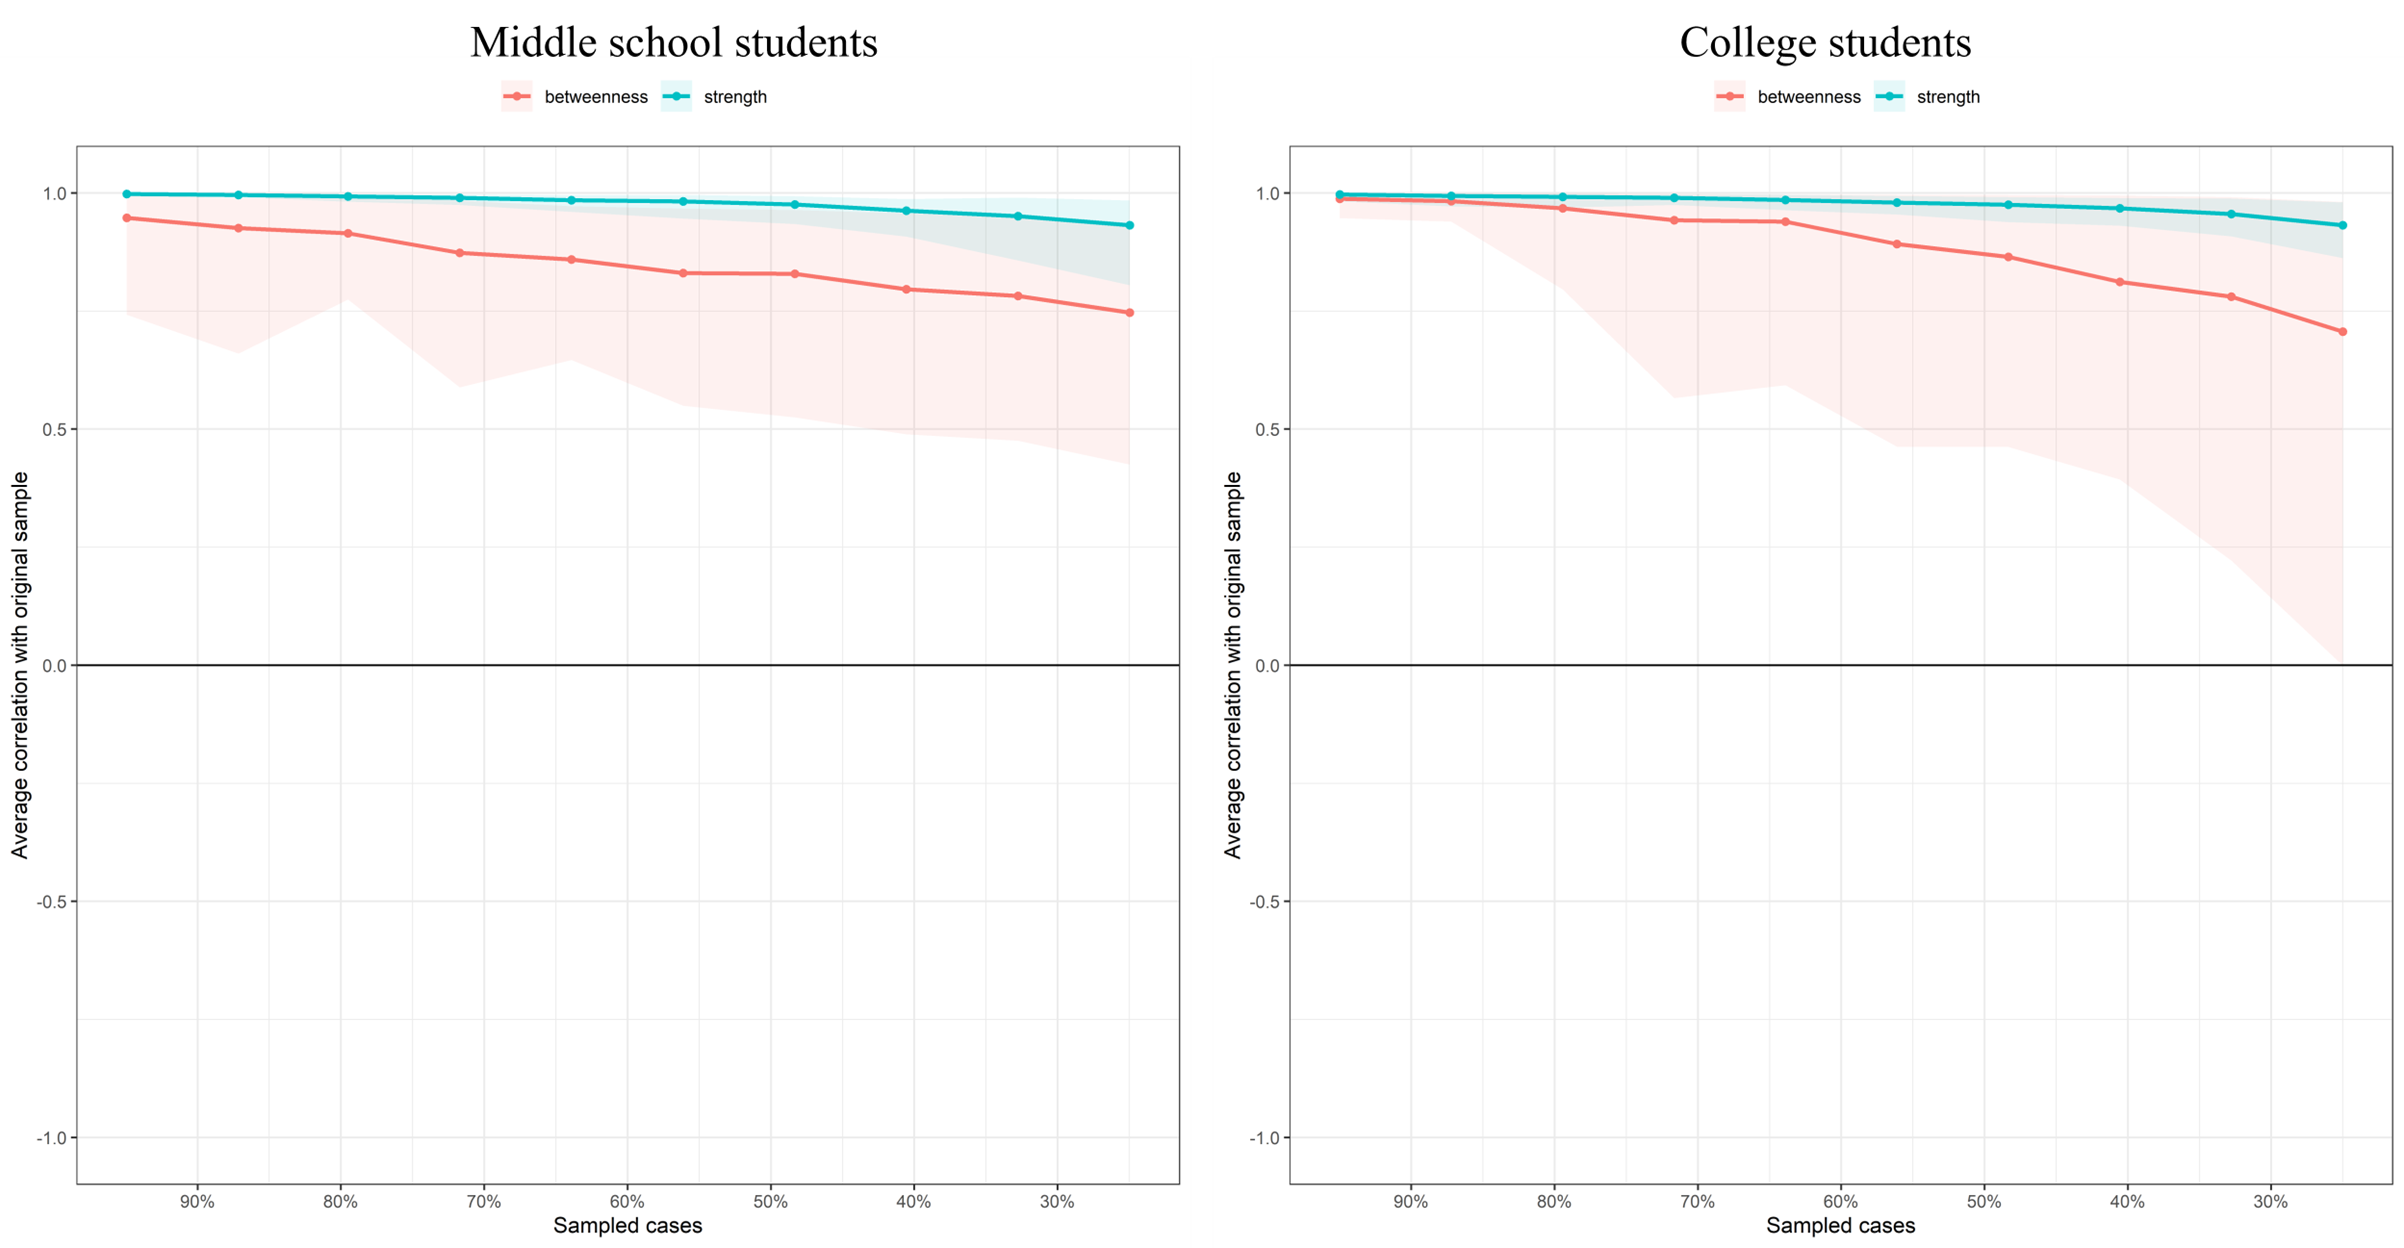
Given that the NCT results indicated that in the network structures of middle school and college students, five edges showed significant differences, with two of these differences related to the anxiety variable, we conducted a further analysis in this section. We subdivided the items of the anxiety subscale according to the symptoms described in the DSM-5, with each item corresponding to a specific manifestation of anxiety as outlined in the DSM-5. Figure 3 presented the network structures of nomophobia and the three mental health symptoms after subdividing the anxiety variable for both group. Figure 4 presented the centrality indices for various nodes within the networks of both middle school and college students. The results of the network and centrality consistency and stability analyses showed that the estimated connections were stable and reliable. For college students, the correlation stability coefficients were .750 for node strength and .361 for node betweenness. For middle school students, the correlation stability coefficients were .750 for node strength and .283 for node betweenness. Detailed results can be found in Figures A3 and A4.
According to the Figure 3, the results showed a similarity in the relationship between mental health symptoms and nomophobia across both groups. For example, the network structure revealed a positive association between the fear of being unable to access information and anxiety. Specifically, the correlation between frequent dry mouth (a symptom of anxiety) and the fear of being unable to access information was .076 for college students and .078 for middle school students. Similar patterns were observed across other dimensions as well; detailed results are provided in Figure 3, Table A4, and Table A5. Moreover, Figure 4 presented the centrality indices for various nodes within the networks of both middle school and college students. In both groups, stress exhibited the highest betweenness and strength centrality, indicating that it played a pivotal role in linking mental health symptoms and nomophobia. This suggests that stress may serve as a central node connecting these domains. Therefore, interventions targeting stress could have wide-reaching effects, potentially alleviating both nomophobia and related mental health symptoms.
Furthermore, differences were also identified in the relationship between nomophobia and mental health symptoms across college students and middle school adolescents. Similarly, in this section, we utilized the NCT to compare the network structures of the two groups. The results of the NCT test indicated that the invariance of global strengt (S = .133, p = .035) was not statistically significant, whereas the invariance of network structure (M = .197, p = .021) was significant. This suggests that at least one edge significantly differed between the networks of the two groups. The analysis identified seven edges that significantly differed between the networks of middle school and college students. Notably, two of these edges involved the relationship between nomophobia (specifically the fear of losing contact) and different anxiety symptoms, showing divergent patterns between the two groups. Specifically, the relationship between students’ nomophobia related to the fear of losing contact and trembling or shaking was significantly different (E = .020, p =.040). A significant correlation was found among college student group (r = .020, p < .050), whereas no significant relationship was observed in the middle school students (r = .000). Furthermore, the relationship between students’ nomophobia related to the fear of losing contact and Fears of showing anxiety that will be negatively evaluated was also significantly different (E = .074, p = .030). A significant correlation was found among middle school students (r = .074, p < .050), whereas no significant relationship was observed in the college student group (r = .000). The remaining differing edges were between nomophobia dimensions—the fear of being unable to access information-fear of losing contact (E = .149, p = .012) and the fear of being unable to access information-fear of losing internet connectivity (E = .102, p = .045)—and between the different anxiety symptoms, specifically feeling of “going crazy”-heart palpitations (E = .126, p = .034) and feeling of “going crazy”-generalized fears (E = .197, p = .003), as well as one edge between stress and trembling or shaking (E = .137, p = .019). Detailed information please refer to Figure 3.
Figure 3. Network Structure of Anxiety and Nomophobia for Middle School and College Students.
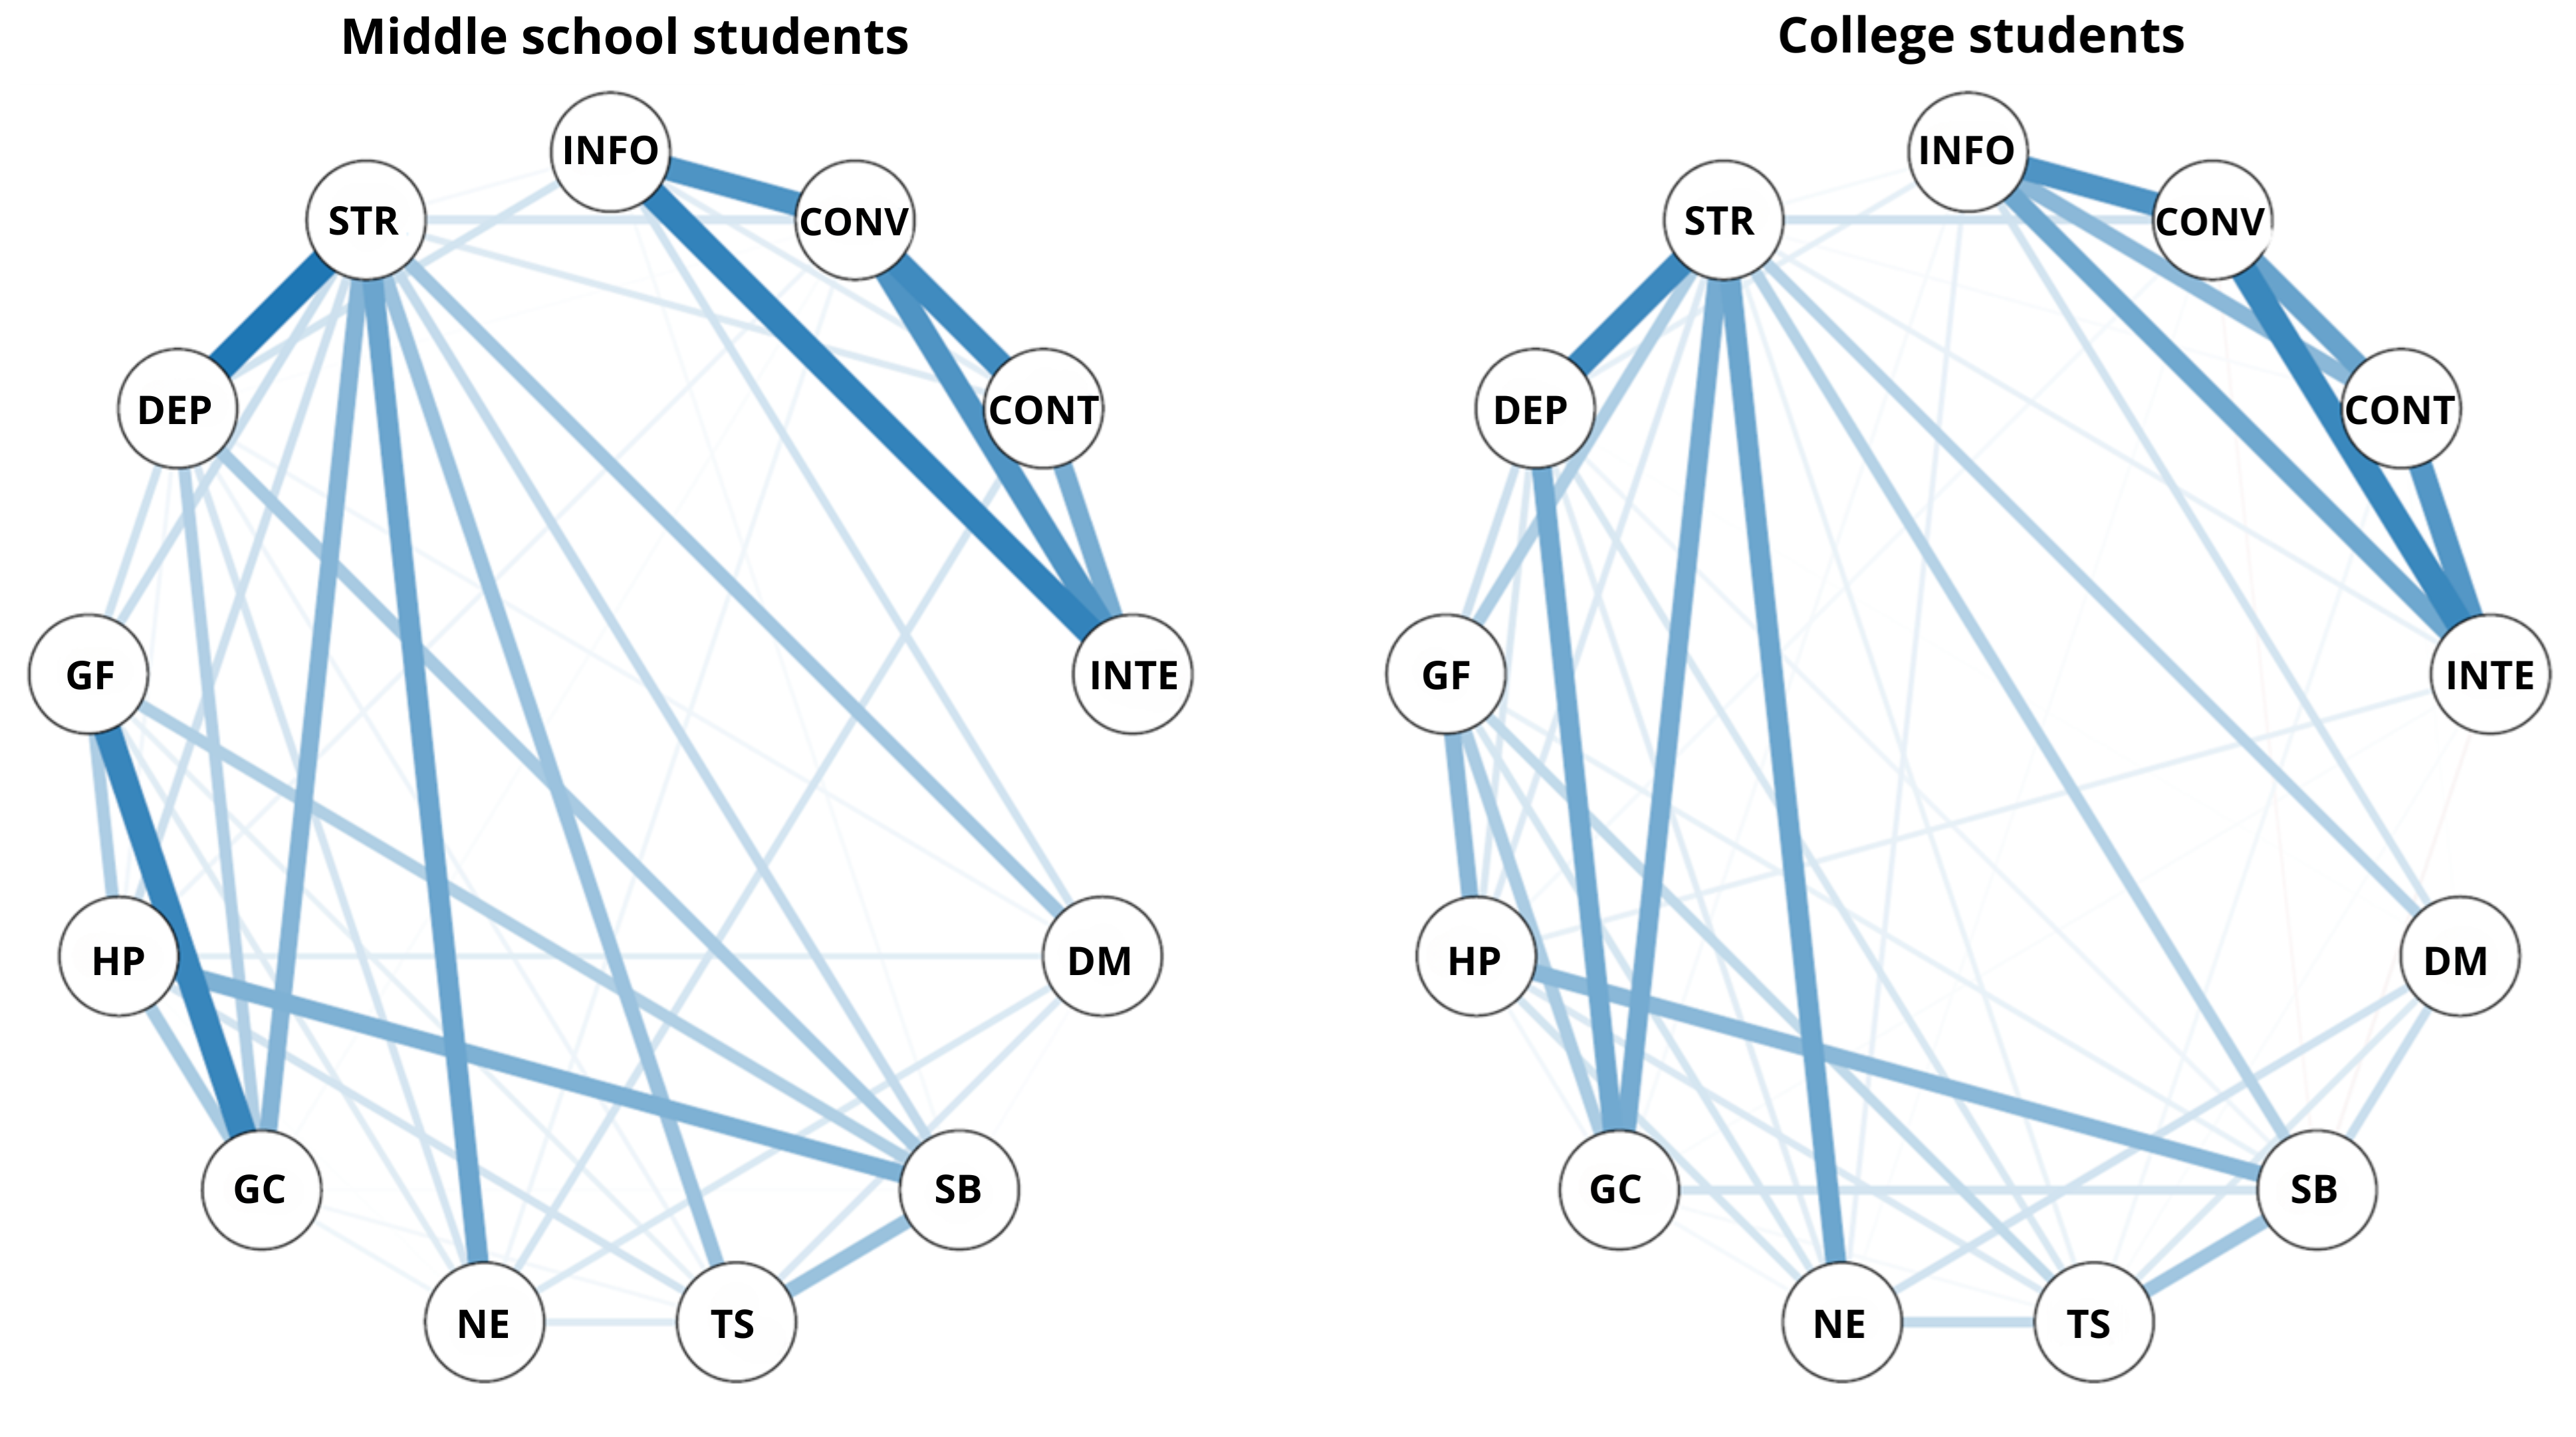
Note. (1) Blue edges represent positive relations and red edges represent negative relations between the network nodes. Greater width of edge indicates stronger associations between the nodes. (2) STR-stress; DEP-depression; INFO-fear of being unable to access information; CONV-fear of losing convenience; CONT-fear of losing contact; INTE-fear of losing internet connectivity; DM- Frequent dry mouth; SB- Sensations of shortness of breath; TS-Trembling or shaking; NE-Fears of showing anxiety that will be negatively evaluated; GC- Feeling of “going crazy”; HP-Heart Palpitations; GF-Generalized fears.
Figure 4. Centrality Indices of Anxiety and Nomophobia Networks for Middle School and College Students.
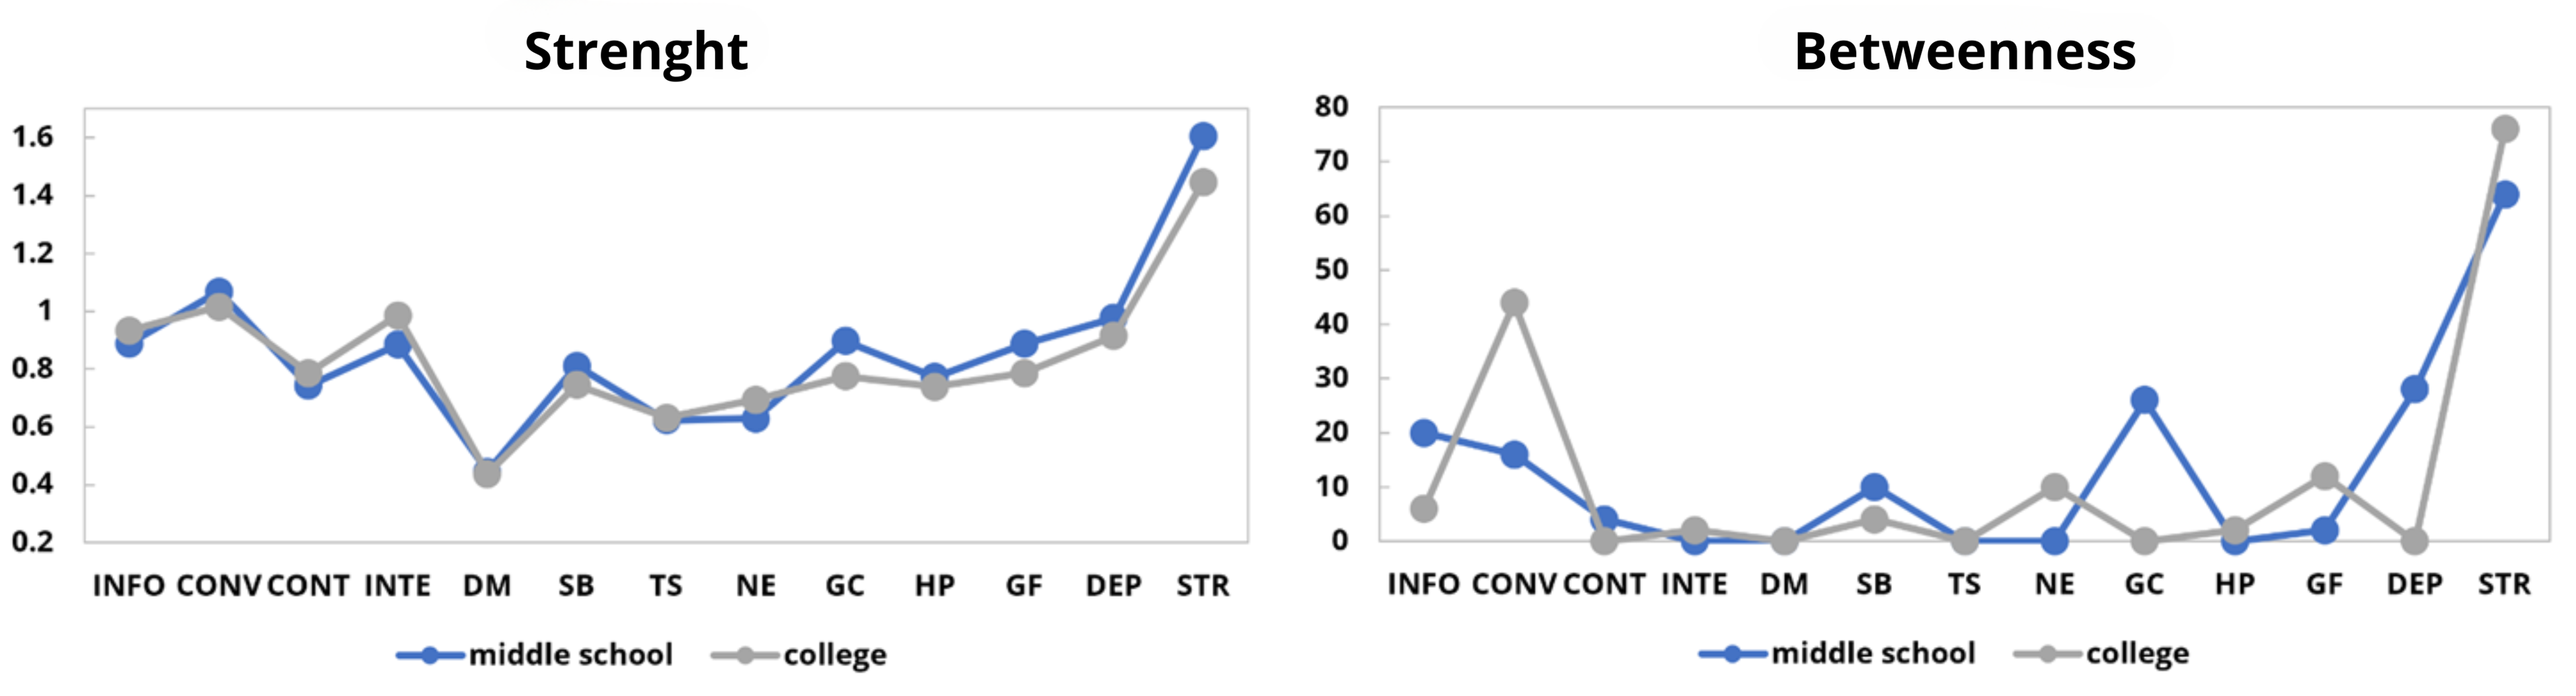
Note. STR-stress; DEP-depression; INFO-fear of being unable to access information; CONV-fear of losing convenience; CONT-fear of losing contact; INTE-fear of losing internet connectivity; DM- Frequent dry mouth; SB- Sensations of shortness of breath; TS-Trembling or shaking; NE-Fears of showing anxiety that will be negatively evaluated; GC- Feeling of “going crazy”; HP-Heart Palpitations; GF-Generalized fears.
Discussion
In this study, a preliminary analysis using independent t-tests revealed that college students reported significantly higher levels of stress and nomophobia compared to their middle school counterparts. To further explore the underlying structure of these relationships, separate network models were constructed for each group to examine the connections among depression, anxiety, stress, and the four dimensions of nomophobia. The results demonstrated significant positive associations between nomophobia and mental health symptoms in both groups. To investigate potential structural differences between the two networks, NCT were conducted. In the initial analysis, where anxiety was treated as a composite score, the most notable differences between the college and middle school networks were found in edges involving anxiety. To gain a more nuanced understanding, the anxiety subscale was further subdivided based on DSM-5 symptomatology in a second comparison. This refined analysis identified seven significant edge differences between the networks of nomophobia and mental health symptoms across the two groups.
The Network Structure Among Middle School Students and College Student
This study identified a significant positive correlation between nomophobia and mental health symptoms among both college and middle school students, aligning with previous findings that associate higher levels of nomophobia with increased anxiety, stress, and depressive symptoms (Abdoli et al., 2023; Sharma et al., 2019). However, a more nuanced analysis of the network structures revealed meaningful differences between the two groups, particularly in the associations between specific dimensions of nomophobia and anxiety. One notable finding was that middle school students demonstrated a strong positive correlation between the fear of losing convenience and anxiety—an association not observed among college students. This may reflect the relatively lower psychological maturity and less-developed coping mechanisms in younger adolescents (Camberis et al., 2014), making them more vulnerable to emotional distress when daily routines or conveniences are disrupted. In contrast, college students, likely equipped with greater psychological resilience and more experience managing independence (Aloka, 2023; Ding et al., 2024), may be less affected by such disruptions. Another striking divergence emerged in the relationship between the fear of losing internet connectivity and anxiety. Among middle school students, this dimension was negatively associated with anxiety, possibly because temporary disconnection is perceived as a relief from academic or social pressures. Conversely, college students showed a positive correlation, suggesting a heightened reliance on constant connectivity for academic work, social engagement, and daily functioning. For this group, disconnection may represent a substantial disruption to both academic success and social integration.
To explore these group-specific patterns more deeply, anxiety was further decomposed into seven distinct symptoms based on DSM-5 criteria, and a subsequent network comparison test was conducted. The results revealed important differences in how these symptoms related to nomophobia, especially the fear of losing contact. For college students, this fear was significantly associated with symptoms such as trembling or shaking, which may reflect somatic expressions of anxiety stemming from their strong dependence on digital communication tools (Jahrami et al., 2022). This relationship, however, was not found in middle school students, likely due to their more limited use of digital platforms and lower levels of technological integration in their daily lives. Interestingly, middle school students demonstrated a significant association between the fear of losing contact and anxiety symptoms related to fears of displaying nervousness in front of others. This pattern may be indicative of their heightened sensitivity to peer evaluation and their still-developing emotional regulation skills. In contrast, college students, who typically possess more stable social identities and greater emotional self-regulation, did not show the same concern. These findings underscore the developmental differences in how anxiety manifests in relation to digital disconnection, and they highlight the importance of tailoring psychological interventions to the unique emotional and cognitive profiles of different age groups (Silvers, 2022).
In addition to identifying differences in the relationship between nomophobia and mental health symptoms across middle school and college students, this study also revealed several important similarities between the two groups. Notably, both groups demonstrated consistent positive associations between the fear of being unable to access information and symptoms of anxiety, depression, and stress. Further analysis showed that this particular dimension of nomophobia was especially linked to anxiety-related symptoms, such as frequent dry mouth—a classic physiological indicator of heightened arousal and psychological tension (Kisely et al., 2016). These cross-group similarities may reflect a shared underlying psychological mechanism: both adolescents and young adults rely heavily on smartphones to maintain access to information, academic content, and social connections. The mere prospect of disconnection may elicit anticipatory anxiety, as individuals worry about missing out on critical updates or being excluded from social or educational contexts. This is consistent with the Fear of Missing Out (FoMO) theory (Elhai et al., 2020; Xie et al., 2018), which posits that individuals experience psychological distress when they perceive themselves as being excluded from information or social experiences.
Implications
This study offers valuable insights into the complex relationship between nomophobia and mental health by comparing the network structure of the college and middle school students. By identifying distinct network structures in the two groups, the findings underscore how developmental stages shape the experience of nomophobia and its associations with symptoms of anxiety, stress, and depression. These results suggest the need for age-specific psychological interventions that reflect the emotional and cognitive capacities of each group. For middle school students, interventions should focus on building emotional regulation and stress management skills, particularly in response to perceived disruptions in convenience or connectivity. Schools can incorporate peer support programs and guided digital literacy education to help younger adolescents manage their dependence on smartphones and reduce anxiety triggered by disconnection. Given their sensitivity to peer evaluation, integrating social-emotional learning components that address self-awareness and self-confidence may also mitigate anxiety symptoms linked to nomophobia. For college students, the findings suggest a different intervention focus. Programs should emphasize healthy technology habits, digital boundaries, and time management, as these students are more likely to rely on their devices for academic, social, and professional purposes. University counseling centers might offer workshops on digital wellness, stress reduction techniques, and cognitive-behavioral strategies to help students reframe anxious thoughts related to constant connectivity. Furthermore, the use of network analysis in this study illustrates the value of identifying central psychological symptoms (such as stress) that serve as key intervention points. Targeting these symptoms may have a broader impact by disrupting the pathways through which nomophobia affects mental health. This methodological approach not only enhances theoretical understanding but also provides a practical framework for developing more precise, developmentally informed interventions. Future research could expand on this work by exploring how cultural, familial, or academic factors further shape the nomophobia–mental health relationship, ultimately guiding more effective prevention and treatment strategies.
Limitation and Future Direction
This study presented several limitations that warrant consideration. First, the cross-sectional design employed in this research precluded the determination of causality. While a significant correlation between nomophobia and mental health issues was identified, the directionality of this relationship remains unclear. To address this limitation, future research should consider adopting a longitudinal design to elucidate the causal pathways between these variables, thereby providing a more robust understanding of their temporal dynamics. Furthermore, the study focused on the relationship between nomophobia and mental health did not account for other potentially influential factors, such as social support, family background, and personality traits. Incorporating these additional variables in future studies through multivariate analyses would offer a more nuanced and comprehensive exploration of the intricate interplay between nomophobia and mental health. Third, recognizing the potential for cultural variations in attitudes towards mobile phone dependency and mental health, future research should consider cross-cultural comparisons to investigate the manifestation and implications of nomophobia across diverse cultural contexts. Such an approach would contribute to the generalizability and applicability of the findings on a global scale. Finally, building on the current findings, future research could aim to develop and evaluate targeted intervention strategies designed to mitigate the adverse effects of nomophobia on mental health across different developmental stages. For instance, interventions for middle school students might emphasize the enhancement of emotional regulation skills, whereas those for college students could focus on fostering adaptability to digital environments.
Conclusion
This study aimed to examine the differences in the relationships between nomophobia and mental health symptoms among middle school and college students using network analysis. A total of 693 middle school adolescents and 900 college students completed the survey. The results revealed strong positive correlations between nomophobia and mental health symptoms in both groups. However, five significant edge differences were identified through the network comparison test, two of which were related to anxiety. To gain deeper insights, the anxiety subscale was subdivided according to DSM-5 symptomatology. The subsequent network comparison test identified seven edges with significant difference between the networks of middle school and college students, with two differences specifically involving the relationship between the fear of losing contact in nomophobia and anxiety symptoms. These findings highlight the distinct ways in which nomophobia associated with mental health symptoms across developmental stages. While both groups experience strong correlations, the relationships vary, suggesting that the interventions may need to be tailored to the specific developmental needs of middle school students and college students.
Conflict of Interest
The authors have no conflicts of interest to declare.
Use of AI Services
The authors declare they have not used any AI services to generate or edit any part of the manuscript or data.
Acknowledgement
This research was supported by the National Natural Science Foundation of China (Grant No. 31800945) and the project named “Design and Development of a Multidimensional Student Mental Health Assessment Model” (Grant No. 53WC2308).
Ethical Approval: All procedures followed were in accordance with the ethical standards of the responsible committee on human experimentation (Tianjin Normal University, China) and with the Helsinki Declaration of 1975, as revised in 2000 (5) (Ethical review number: XL2020-08).
Informed Consent: Informed consent was obtained from all patients for being included in the study.
Data availability statement: The data that support the findings of this study are available from the corresponding author upon reasonable request.
The authors would like to express their gratitude to all participants in this study.
Appendix
Table A1. 21 Items From the Depression, Anxiety, and Stress Scale and DSM-5 Symptoms of Anxiety.
|
Dimension |
Item |
DSM symptoms |
|
Stress |
I find it hard to calm down and rest |
- |
|
I tend to overreact to my environment. |
||
|
I often feel nervous or on edge. |
||
|
I find myself easily anxious. |
||
|
I struggle to relax. |
||
|
I feel intolerant toward things that hinder my work. |
||
|
I find myself easily angered by trivial matters. |
||
|
Anxiety |
I often feel my mouth is dry. |
Frequent dry mouth |
|
I often feel short of breath (such as feeling out of breath or unable to breathe properly). |
Sensations of shortness of breath |
|
|
I have felt shaky (for example, my hands trembling). |
Trembling or shaking |
|
|
I often worry about doing something foolish or embarrassing due to panic. |
Fears of showing anxiety that will be negatively evaluated |
|
|
I feel like I'm on the verge of panic. |
Feeling of “going crazy” |
|
|
I can feel my heart beating abnormally, even without physical exhaustion. |
Heart Palpitations |
|
|
I feel anxious without any clear reason. |
Generalized fears |
|
|
Depression |
I find it difficult to maintain a positive or optimistic outlook. |
- |
|
I struggle to take initiative and get things done. |
||
|
I feel as though there is nothing to look forward to in the future. |
||
|
I feel down and depressed. |
||
|
I have lost interest in everything. |
||
|
I feel like I have no value. |
||
|
I feel as if life has no meaning. |
Table A2. Optimal Network Weights for Nomophobia and Mental Health among Middle School Students.
|
INFO |
CONV |
CONT |
INTE |
DEP |
ANX |
STR |
|
|
INFO |
|
|
|
||||
|
CONV |
.308 |
|
|||||
|
CONT |
.038 |
.338 |
|
||||
|
INTE |
.365 |
.312 |
.240 |
|
|||
|
DEP |
.085 |
.000 |
.000 |
.000 |
|
||
|
ANX |
.011 |
.058 |
.000 |
−.023 |
.267 |
|
|
|
STR |
.032 |
.054 |
.089 |
.000 |
.417 |
.574 |
|
Table A3. Optimal Network Weights for Nomophobia and Mental Health Among College Students.
|
INFO |
CONV |
CONT |
INTE |
DEP |
ANX |
STR |
|
|
INFO |
|
|
|
|
|
|
|
|
CONV |
.308 |
|
|
|
|
|
|
|
CONT |
.200 |
.262 |
|
|
|
|
|
|
INTE |
.249 |
.345 |
.299 |
|
|
|
|
|
DEP |
.042 |
.001 |
.000 |
.000 |
|
|
|
|
ANX |
.055 |
.000 |
.009 |
.020 |
.266 |
|
|
|
STR |
.016 |
.087 |
.010 |
.036 |
.377 |
.495 |
|
Table A4. Optimal Network Weights for Nomophobia and Mental Health After Subdividing the Anxiety Among Middle School Students.
|
INFO |
CONV |
CONT |
INTE |
DM |
SB |
TS |
NE |
GC |
HP |
GF |
DEP |
STR |
|
|
INFO |
|||||||||||||
|
CONV |
.304 |
||||||||||||
|
CONT |
.050 |
.327 |
|||||||||||
|
INTE |
.350 |
.302 |
.232 |
||||||||||
|
DM |
.078 |
.000 |
.000 |
.000 |
|||||||||
|
SB |
.014 |
.000 |
.000 |
.000 |
.007 |
||||||||
|
TS |
.000 |
.000 |
.000 |
.000 |
.064 |
.173 |
|||||||
|
NE |
.000 |
.027 |
.074 |
.000 |
.063 |
.000 |
.055 |
||||||
|
GC |
.000 |
.009 |
.000 |
.000 |
.000 |
.006 |
.019 |
.027 |
|||||
|
HP |
.000 |
.027 |
.000 |
.000 |
.049 |
.221 |
.075 |
.004 |
.148 |
||||
|
GF |
.000 |
.000 |
.001 |
.000 |
.000 |
.136 |
.039 |
.054 |
.342 |
.141 |
|||
|
DEP |
.077 |
.005 |
.000 |
.000 |
.023 |
.150 |
.027 |
.072 |
.135 |
.022 |
.082 |
||
|
STR |
.016 |
.067 |
.059 |
.000 |
.160 |
.103 |
.171 |
.253 |
.212 |
.087 |
.093 |
.384 |
Table A5. Optimal Network Weights for Nomophobia and Mental Health After Subdividing the Anxiety Among College Students.
|
INFO |
CONV |
CONT |
INTE |
DM |
SB |
TS |
NE |
GC |
HP |
GF |
DEP |
STR |
|
|
INFO |
|
|
|
|
|
|
|
|
|
|
|
|
|
|
CONV |
.302 |
|
|
|
|
|
|
|
|
|
|
|
|
|
CONT |
.200 |
.259 |
|
|
|
|
|
|
|
|
|
|
|
|
INTE |
.247 |
.338 |
.294 |
|
|
|
|
|
|
|
|
|
|
|
DM |
.076 |
.000 |
.003 |
.000 |
|
|
|
|
|
|
|
|
|
|
SB |
.000 |
−.010 |
.000 |
−.014 |
.092 |
|
|
|
|
|
|
|
|
|
TS |
.000 |
.000 |
.020 |
.009 |
.060 |
.161 |
|
|
|
|
|
|
|
|
NE |
.038 |
.009 |
.000 |
.000 |
.079 |
.000 |
.102 |
|
|
|
|
|
|
|
GC |
.014 |
.000 |
.000 |
.008 |
.000 |
.075 |
.013 |
.018 |
|
|
|
|
|
|
HP |
.000 |
.017 |
.000 |
.040 |
.000 |
.200 |
.062 |
.075 |
.022 |
|
|
|
|
|
GF |
.000 |
.000 |
.000 |
.000 |
.000 |
.038 |
.106 |
.072 |
.145 |
.200 |
|
|
|
|
DEP |
.042 |
.000 |
.000 |
.000 |
.004 |
.027 |
.065 |
.051 |
.243 |
.064 |
.086 |
|
|
|
STR |
.015 |
.081 |
.011 |
.036 |
.124 |
.128 |
.034 |
.252 |
.238 |
.058 |
.140 |
.332 |
|
Figure A1. Bootstrapped Confidence Intervals for the Network Connection Weights Between Nomophobia and Mental Health Symptoms (n = 1,000).

Figure A2. Stability of Centrality Indices for Each Node in the Nomophobia and Mental Health Symptoms Network (n = 1,000).
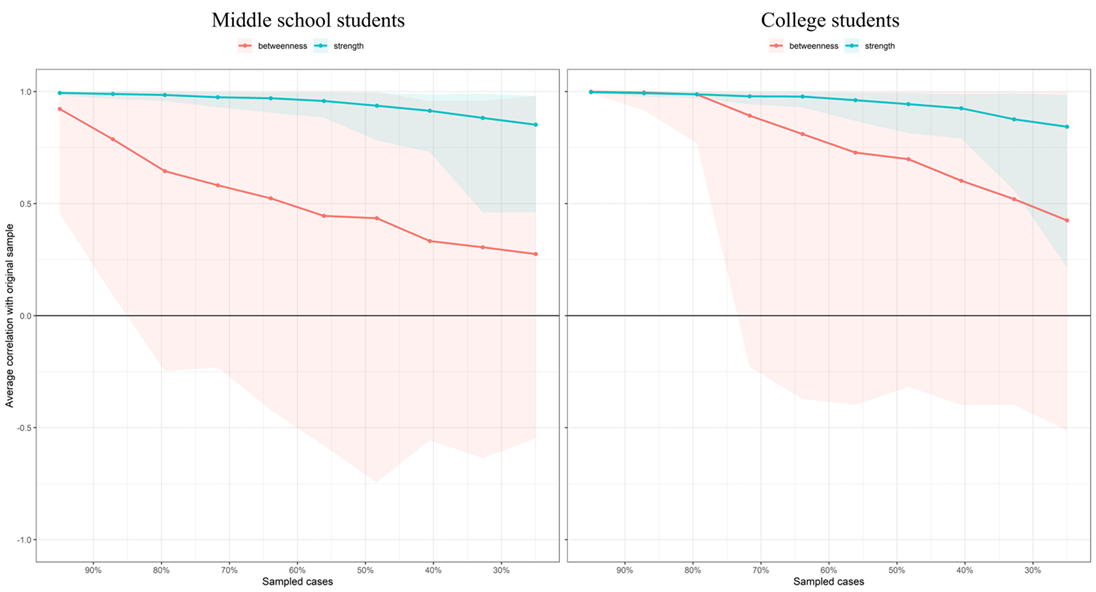
Figure A3. Bootstrapped Confidence Intervals for the Network Connection Weights Between Nomophobia and Mental Health Symptoms After Subdividing the Anxiety (n = 1,000).
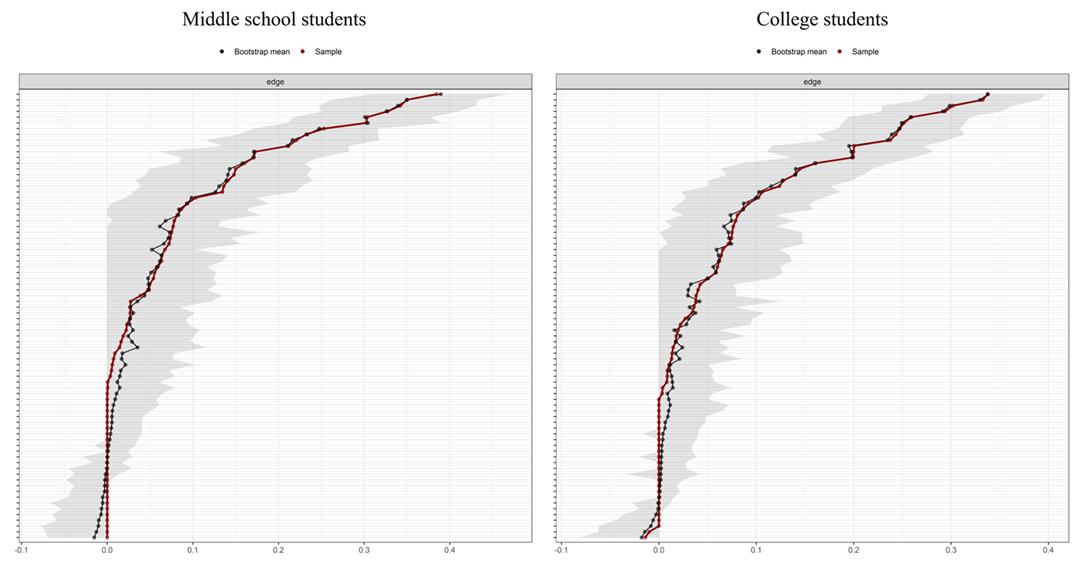
Figure A4. Stability of Centrality Indices for Each Node in the Nomophobia and Mental Health Symptoms Network After Subdividing the Anxiety (n = 1,000).

This work is licensed under a Creative Commons Attribution-ShareAlike 4.0 International License.
Copyright © 2025 Shixiu Ren, Xiaoxu Lu, Shihui Ren, Manyuan Li, Tour Liu