
Do College Students use Facebook to Communicate about Alcohol? An Analysis of Student Profile Pages
Vol.5,No.2(2011)
college drinking norms; facebook; social networking sites; alcohol
Angela K. Fournier
Department of Psychology, Bemidji State University, Bemidji, Minnesota, USA
Angela Fournier, Ph.D. is an Assistant Professor of Psychology at Bemidji State University in Bemidji, MN. She holds a Ph.D. and an M.S. in clinical psychology from Virginia Tech and a B.S. in psychology from Christopher Newport University. Her interests are in applied research to improve large-scale health behavior and the study of social media and technology in health behavior intervention.
Steven W. Clarke
College Alcohol Abuse Prevention Center, Virginia Tech, Blacksburg, Virginia, USA
Dr. Steven Clarke is currently the Director of the Campus Alcohol Abuse Prevention Center at Virginia Tech. He has been working in the alcohol abuse prevention field for 25 years developing alcohol abuse prevention interventions and conducting research on alcohol-related behaviors of college students. His work focuses on the development and evaluation of marketing campaigns, social media, and psychoeducational interventions targeting college students.
Bandura, A. (1977). Social learning theory. Englewood Cliffs, NJ: Prentice Hall.
Bandura, A. (1986). Social foundations of thought and action: A social cognitive theory. Upper Saddle River, NJ: Prentice Hall.
Bosari, B. & Carey, K.B. (2001). Peer influences on college drinking: A review of the research. Journal of Substance Abuse, 13, 391-424.
Carter, C. A., & Kahnweiler, W. M. (2000). The efficacy of the social norms approach to substance abuse prevention applied to fraternity men. Journal of American College health, 49, 66-71.
Ellickson, P. L. Collins, R. L. Hambarsoomians, K., & McCaffrey, D. F. (2005). Does alcohol advertising promote adolescent drinking? Results from a longitudinal assessment. Addiction, 100, 235-246. doi:10.1111/j.1360-0443.2005.00974.x
Facebook. (2010). Facebook statistics. Retrieved July 27, 2010 from http://www.facebook.com/
Haines, M., & Spear, S. F. (1996). Changing the perception of the norm: A strategy to decrease binge drinking among college students. Journal of American College Health, 45, 134-140.
Hargittai, E. (2008). Whose Space? Differences among users and non-users of social network sites. Journal of Computer-Mediated Communication, 13, 276-297. doi:10.1111/j.1083-6101.2007.00396.x
Kramer, N. C., & Winter, S. (2008). Impression management 2.0: The relationship of self-esteem, extraversion, self-efficacy, and self-presentation within social networking sites. Journal of Media Psychology, 20, 106-116. doi:10.1027/1864-1105.20.3.106
Mallett, K. A., Bachrach, R. L., & Turrisi, R. (2009). Examining the unique influence of interpersonal and intrapersonal drinking perceptions on alcohol consumption among college students. Journal of Studies on Alcohol and Drugs, 70, 178-185.
Mattern, J. L., & Neighbors, C. (2004). Social norms campaigns: Examining the relationship between changes in perceived norms and changes in drinking levels. Journal of Studies on Alcohol, 65, 489-493.
Morgan, E. M., Snelson, C., & Elison-Bowers, P. (2010). Image and video disclosure of substance use on social media websites. Computers in Human Behavior, 26, 1405-1411. doi:10.1016/j.chb.2010.04.017
Moreno, M. A., Briner, L. R., Williams, A., Brockman, L., Walker, L., & Christakis, D. A. (2010). A content analysis of displayed alcohol references on a social networking web site. Journal of Adolescent Health, 47, 168-175. doi:10.1016/j.jadohealth.2010.01.001
Moreno, M. A., Briner, L. R., Williams, A., Walker, L., & Christakis, D. A. (2009). Real use or “Real Cool”: Adolescents speak out about displayed alcohol references on social networking websites. Journal of Adolescent Health, 45, 420-422. doi:10.1016/j.jadohealth.2009.04.015
National Institute on Alcohol Abuse and Alcoholism. (2010). Statistical snapshot of college drinking. Retrieved July 27, 2010 from
NIAAASponsoredPrograms/StatisticalSnapshotCollegeDrinking.htm"> http://www.niaaa.nih.gov...StatisticalSnapshotCollegeDrinking.htm
Pempek, T. A., Yermolayeva, Y. A., & Calvert, S. L. (2009). College students’ social networking experiences on Facebook. Journal of Applied Developmental Psychology, 30, 227-238. doi:10.1016/j.appdev.2008.12.010
Perkins, H.W. (1997). College student misperceptions of alcohol and other drug use norms among peers. In Designing alcohol and other drug prevention programs in higher education: Bringing theory into practice (pp. 177 – 206). Newton, MA: The Higher Education Center for Alcohol and Other Drug Prevention.
Perkins, H. W., Meilman, P. W., Leichliter, J. S., Cashin, M. A. & Presley, C. A. (1999). Misperceptions of the norms for the frequency of alcohol and other drug use on college campuses. Journal of American College Health, 47, 253-258.
Perkins, H. W. (2003). The social norms approach to preventing school and college age substance abuse: A handbook for educators, counselors, and clinicians. San Francisco, CA: Jossey-Bass.
Perkins, H. W., & Berkowitz, A. D. (1986). Perceiving the community forms of alcohol use among students: Some research implications for campus alcohol education programming. International Journal of the Addictions, 21, 961-976.
Presley, C. A., Meilman, P. W., & Lyerla, R. (1993). Alcohol and other drugs on American college campuses: Use, consequences, and perceptions of the campus environment (Vol. I: 1989-1991). The Core Institute, Student Health Programs, Carbondale, IL: Southern Illinois University of Carbondale.
Peluchette, J. & Karl, K. (2008). Social networking profiles: An examination of student attitudes regarding use and appropriateness of content. CyberPsychology & Behavior, 11, 95-97. doi:10.1089/cpb.2007.9927
Raacke, J., & Bonds-Raacke, J. (2008). MySpace and Facebook: Applying the uses and gratifications theory to exploring friend-networking sites. CyberPsychology & Behavior, 11, 169-174. doi:10.1089/cpb.2007.0056
Testa, M., Kearns-Bodkin, J. N., & Livingston, J. A. (2009). Effect of precollege drinking intentions on women’s college drinking as mediated via peer social influences. Journal of Studies on Alcohol and Drugs, 70, 575-582.
Walther, J. B., Van Der Heide, B., Kim, S., Westerman, D., & Tong, S. T. (2008). The role of friends’ behavior on evaluations of individuals’ Facebook profiles: Are we known by the company we keep? Human Communication Research, 34, 28-49.
Wechsler, H., Dowdall, G. W., Maenner, G., Gledhil-Hoyt, J., & Lee, H. (1998). Changes in binge drinking and related problems among American college students between 1993 and 1997: Results of the Harvard school of public health college alcohol study. Journal of American College Health, 47, 57-66. doi:10.1080/07448489809595621
Wechsler, H., Lee, J. E., Nelson, T. F., & Kuo, M. (2002). Underage college students’ drinking behavior, access to alcohol, and the influence of deterrence policies: Findings for the Harvard School of Public Health College Alcohol Study. Journal of American College Health, 50, 223-236. doi:10.1080/07448480209595714
Introduction
Student alcohol use and abuse is one of the leading problems facing American colleges and universities. According to the National Institute on Alcohol Abuse and Alcoholism (NIAAA), approximately four out of five college students use alcohol, and more than 40% report engaging in binge drinking (NIAAA, 2010). Heavy alcohol use results in a number of negative consequences for college students, including physical violence, property damage, poor academic or work performance, vehicle crashes, and death (Presley, Meilman, & Lyerla, 1993; Wechsler, Dowdall, Maenner, Gledhil-Hoyt, & Lee, 1998). Though this problem has been targeted by behavioral researchers for decades, the problem has gone largely unabated. Recent studies suggest one important factor in the way college students think about and use alcohol is their perceptions of the alcohol use of others.
Perceived Drinking Norms
The perceived drinking behavior of peers and their approval of drinking are strong predictors of how much a student drinks (Testa, Kearns-Bodkin & Livingston, 2009). Students who live away from home are reported to be more affected by this social influence. Self-reported heavy drinkers often choose peers who are heavy drinkers and environments that provide them with the opportunity to drink (e.g. joining a sorority or fraternity). Not only do they share a similar drinking habit but they also report similar drinking intentions. Many college students perceive drinking as a normal part of the college experience and do not perceive drunkenness as a problem (Mallett, Bachrach & Turrisi, 2009). Furthermore, many students tend to overestimate the amount of alcohol consumed by their peers (Perkins & Berkowitz, 1986). These misperceptions are thought to have a strong influence on consumption, leading some to accept at-risk consumption as normative, enabling high levels of consumption (e.g., Bosari & Carey, 2001; Perkins, 1997; Perkins et al., 1999).
In response to the connection between misperceptions of campus norms and increased drinking, many campuses have implemented social marketing campaigns aimed at providing more accurate information about normative student drinking (e.g., Haines & Spear, 1996; Perkins, 2003). To counter a “drinking culture” on campuses, posters and informational materials are distributed, displaying messages that the majority of students on campus do not abuse alcohol. The goal is for students’ perceptions of social norms related to alcohol to become more reflective of the greater population of students (i.e., those who do not abuse alcohol). Research indicates such campaigns have resulted in positive changes in student perceptions (e.g., Haines & Spear, 1996; Mattern & Neighbors, 2004) and decreases in reported alcohol use (Carter & Kahnweiler, 2000). However, it is likely that perceived social norms are affected not only by campus signs and posters, but also by interactions with peers, either in-person or online.
Social Networking Sites
With the advent of web-based media, students may receive messages about drinking norms from many sources, including online sources such as social networking sites (SNSs). “Social networking sites are virtual places that cater to a specific population in which people of similar interest gather to communicate, share, and discuss ideas” (Raacke & Bonds-Raacke, 2008, p. 169). While research has shown that exposure to alcohol ads on screen media does contribute to drinking among youth (e.g., Ellickson, Collins, Hambarsoomians, & McCaffrey, 2005), little is known about the impact of alcohol-related content in web-based media.
The present study investigated the presence of alcohol-related content on college students’ Facebook profiles. Facebook.com is a social networking site that is free to join and commonly used among college students. Once a person joins the site they can begin to customize their online profile, by posting personal information about themselves, posting photographs and videos, and writing what they are doing on their “wall,” a portion of the page on which friends can post messages to them that others can see. Users can view the Facebook page of other users, once they have requested and been accepted as a “Friend.”At the time of this writing, Facebook reports over 500 million active users (Facebook, 2010). With regard to college students, Wiley and Sisson (2006) found that more than 90% of respondents, college students from a number of universities in the Midwest United States, use the site. With users spending over 700 billion minutes per month on the site (Facebook, 2010), Facebook has been integrated into the daily lives of many young adults in the United States and beyond.
Because the site is so popular among college students, and alcohol abuse is one of the leading problems facing this population, a question of concern is whether students use SNSs, particularly Facebook, to communicate about alcohol. Furthermore, does exposure to alcohol-related content online affect student alcohol use? This could happen through vicarious learning (Bandura, 1977) in which students learn to use alcohol by observing (online) other students’ behavior and the consequences following the observed behavior. According to social cognitive theory, one can learn actual behavior or judgmental standards by observing a model (Bandura, 1986). The people we come in contact with everyday and the images we see in the media are common models for behavior. Furthermore, the comments, pictures, and videos students post on Facebook (on average, students post 90 pieces of content each month, Facebook, 2010), may facilitate college students’ vicarious learning about alcohol use. If so, Facebook may pose a challenge for social marketing approaches aimed at correcting misperceptions about college alcohol use. Although empirical research on SNSs is a growing area, current knowledge of human behavior in these online environments is limited. To date, empirical research on SNSs and alcohol in particular is sparse and has been limited to self-report.
Peluchette and Karl (2008) surveyed 433 undergraduate college students about their use of SNSs and their perceptions of what is appropriate to post on such sites. SNS use was common, with 80% of the sample reporting the use of at least one SNS and 50% of participants reporting logging onto an SNS at least once per day. When asked about posted material that student participants would not want employers or potential employers to view, the most common response was alcohol-related content, such as photographs or comments. Men were significantly more likely to post alcohol-related content and less concerned about such content than women.
Moreno, Briner, Williams, Brockman, Walker, and Christakis (2010) evaluated public profiles of 400 17- to 20-year olds on MySpace, recording references to alcohol use. Over half of the profiles (56.3%) contained references to alcohol. The most common references made related to explicit alcohol use, despite all users being under the legal drinking age. In addition to late adolescents posting a significant amount of alcoholic references on MySpace, a second study showed that adolescents believe alcohol references on MySpace reflect real behavior (Moreno, Briner, Williams, Brockman, Walker, & Christakis, 2009). Photographs containing images of alcohol or alcohol use were perceived as particularly convincing for younger adolescents.
Morgan, Snelson, and Bowers (2010) surveyed Facebook users, inquiring whether or not they posted alcohol-related images or videos on the site. Of 314 college students surveyed, 92% reported having a Facebook or MySpace profile; 32% of them reported having posted pictures of themselves with alcohol-related content. More specifically, 17% of Facebook users had posted such images of themselves. The authors also viewed public photographs and videos on MySpace and YouTube, finding a significant amount of alcohol-related content. Thus far, studies utilizing self-report and observations of public sites have found that many users have alcohol-related content on their SNS profile. Research indicates Facebook is very popular among college students and to date, direct observations of private Facebook alcohol-related content have not been made. The present study aimed to fill this gap in the literature.
Objectives & Hypotheses
The purpose of the present study was to investigate the presence of alcohol-related content on Facebook. Specific objectives were to quantify the proportion of alcohol-related content on student profiles, determine the extent to which students are exposed to content on other students’ profiles, and assess alcohol-related content in the context of underage drinking. Furthermore, the study was aimed at determining whether alcohol-related content on Facebook was related to actual and perceived drinking behavior. It was hypothesized there would be a significant positive relationship between alcohol-related content on Facebook and reported alcohol use, as well as perceived alcohol use of Facebook Friends. Finally, a positive relationship was predicted between reported alcohol use and perceived alcohol use of Facebook Friends.
Method
Participants
Participants were 68 college students (19 men, 49 women) at a state university in the Midwest. In order to participate, these students had to have been enrolled in an introductory psychology course, in which they received extra credit for volunteering, and have an active Facebook account. The participants ranged in age from 18 to 40 (M = 19.9, SD = 3.9), with 93% of them (n = 65) being of traditional college age (i.e., 18-24). Participants were mostly freshmen (73.9%), but also included sophomores (10.1%), juniors (10.1%), and seniors (5.7%). The sample comprised 22% of the introductory psychology course and demographic characteristics of the sample were representative of the course population.
Materials
Materials included a paper-and-pencil questionnaire and participant Facebook profiles. The questionnaire, located in Appendix A, included demographic questions as well as questions about participants’ alcohol use, perceptions of their Facebook “friends1” alcohol use, and their own Facebook use. Participants were also asked to report on a likert scale how well their Facebook profile represents them.
Procedures
Participants were recruited through an announcement in an introductory psychology course. Student participants initially met with researchers in person in order to provide informed consent and complete the questionnaire. At that time, each participant individually logged onto his or her Facebook profile and added the research group as a friend. Participants were informed the researchers would view their Facebook page and systematically record information regarding college student behavior, including alcohol use and Facebook use. They were told researchers may view their page anytime throughout the semester, but were not told when it would be viewed. They were then given their extra credit and had no other direct contact with the researchers until the debriefing stage of the study.
Each participant’s pictures and wall posts were viewed just once, within two weeks of participants’ completing informed consent and the questionnaire. Each profile was observed by two researchers, viewing the page independently and simultaneously in order to ensure reliability of observations. An inter-rater reliability analysis using Cohen’s kappa statistic indicated reliability was excellent for both pictures, kappa = .976, p = .000, and posts, kappa = .967, p = .000. The researchers recorded the quantity of alcohol-related content on the page by tallying photos and wall posts with and without alcohol-related content. Viewing of the content was strictly passive; researchers did not post or comment on participant profiles. When two or more participants happened to be friends with each other, they were grouped in order to measure any similarities in their data.
At the end of the study, all participants were sent a debriefing message through their Facebook account, which is private and similar to an email2. Participants were then removed from the researchers’ friend list, terminating access to all participant profiles.
Pictures. When viewing participants’ pictures, a picture with alcohol-related content was defined as a photograph that included a labeled alcohol container (i.e., beer or liquor bottle) or included drinks that were perceived as containing alcohol (i.e., wine glass with what looked like wine, beer mug with what looked like beer), or was taken in an obvious bar setting (i.e., bar is visible with bottles, signs, etc.). Only pictures with these obvious signs of alcohol were counted as alcohol-related. Ambiguous pictures (e.g., photographs with plastic cups that may have contained unseen alcohol) were not included in analyses. Pictures with comments (e.g., “you look drunk in this picture”) or captions (e.g., “me and the boys after happy hour downtown”) indicating alcohol use were also counted as alcohol-related.
Pilot data suggested that the number of pictures posted by students can range from 0 to over 2,000, making viewing all pictures on each participant’s page unmanageable. Thus, researchers sampled pictures, viewing the first 100 tagged photos (i.e., photographs of the participant posted by the participant or his/her friends), up to 100 pictures from each of the first 3 albums (i.e., photographs posted by the participant), and all profile pictures (i.e., photographs the participant posted at some point as the picture that identifies them on Facebook).
Posts. Researchers viewed posts from participants’ “walls,” the homepage of a Facebook profile, which can be viewed by various people depending on the user’s security settings. Generally, the wall is most often available to the user’s friends. When viewing the wall and recording posts, researchers viewed only the posts visible by scrolling to the bottom of the screen; older posts were not viewed. Generally, posts on an active participants’ page were made within the same day. A post with alcohol-related content was defined as a post that included any of the following keywords: beer, drink, drunk, hangover, liquor, shot, shooter, wine. In addition, a post was deemed alcohol-related if it contained specific names of alcohol (e.g., whiskey, vodka), brands of alcohol (e.g., “got a bottle of Absolute – wanna come over?”), alcoholic drinks (e.g., “going to Margarita Monday”), or mentioned a known local drinking establishment. It is important to note that a post is something written on one’s Facebook page by the user or any of their friends. Researchers did not record who posted the content; tallies were simply made indicating the presence of content on the user’s page, regardless of the author.
Results
Results include findings from questionnaire data and observations from Facebook profiles. Questionnaire data included information on reported alcohol use, perceived drinking norms, and reported Facebook use, as well as demographic information. Observations from Facebook profiles included quantities of total pictures and posts and quantities of pictures and posts with alcohol-related content; percent alcohol-related content was tallied from these values.
Questionnaire Data
Self-reported alcohol use. Self-reported frequency of use indicated 30.9% (n = 21) reported “not at all,” 47.8% (n = 33) marked “one to three times per month,” 13.0% (n = 9) said “once per week,” and 7.2% (n = 5) indicated “two to three times per week.” Results for average quantity per sitting indicated 29% (n = 20) reported they do not drink, 21.7% (n = 15) consume one to two drinks, 39.1% (n = 27) have three to four drinks, and 10.1% (n = 7) have five or more drinks.
Perceptions of Facebook friends’ alcohol use. When asked what percentage of their “close Facebook friends” use alcohol, reports ranged from 0% to 100% with a mean of 44.5%, a median score of 45.0%, and a mode of 50.0%. When asked the frequency with which close Facebook friends use alcohol per month, 3.1% (n = 2) indicated “not at all,” 33.8% (n = 22) marked “one to three times per month,” 38.5% (n = 25) said “once per week,” 23.1% (n = 15) indicated “two to three times per week,” and 1.5% (n = 1) reported “four or more times per week.”
Facebook use. For frequency of Facebook use, 87.9% (n = 58) reported using Facebook once per day or more. With regard to number of hours per week spent on Facebook, answers followed a normal distribution, ranging from 0 (n = 1; 1.5%) to 25 (n = 1; 1.5%), with a mean of 6.6 (SD = 5.6), a median of 5.0 and a mode of 5.0. Researchers recorded the number of friends participants had on Facebook (i.e., the number of other people with access to their profiles). Observed number of friends ranged from 5 to 1,459, with a mean of 436.3 (SD = 289.5), a median of 376.5, and a mode of 301.0. Participants were asked to rate how well their Facebook profile represented their true self, on a scale from 1(completely) to 6 (not at all). The scores ranged from 1 to 5 (M = 3.11, SD = 1.19).
Communicating about alcohol on Facebook. When asked directly how often they use Facebook to communicate about alcohol-related activities, the most common response was “never” (n = 47; 68.1%). However, 29% (n = 20) reported doing so one to three times per month and 2.9 % (n = 2) reported doing so four or more times per week.
Observations from Facebook Profiles
The dependent variable analyzed from Facebook data was the percent of alcohol-related content, dividing the number of pictures or posts containing alcohol by the total number of pictures or posts. Percent alcohol-related content was calculated for pictures and posts, and totaled to determine an overall percentage for each participant’s profile. Table 1 provides descriptive data from participant Facebook profiles, revealing some interesting characteristics of the data.
Table 1. Descriptive data from Facebook observations.
|
|
|
Minimum |
|
Maximum |
Mean (SD) |
|
Median |
|
Mode |
|
|
Pictures* |
|
|
|
|
|
|
|
|
|
|
|
Alcohol-related |
|
0 |
|
41 |
3.8 (7.6) |
|
1.0 |
|
0.0 |
|
|
Total |
|
1 |
|
257 |
118.5 (57.2) |
|
121.5 |
|
172.0 |
|
|
Percent |
|
0 |
|
25 |
3.2 (5.2) |
|
1.1 |
|
0.0 |
|
|
Posts |
|
|
|
|
|
|
|
|
|
|
|
Alcohol-related |
|
0 |
|
4 |
0.2 (0.7) |
|
0.0 |
|
0.0 |
|
|
Total |
|
0 |
|
54 |
18.4 (12.2) |
|
15.5 |
|
15.5 |
|
|
Percent (%) |
|
0 |
|
11 |
0.0 (0.03) |
|
0.0 |
|
0.0 |
|
|
Total Content |
|
|
|
|
|
|
|
|
|
|
|
Alcohol-related |
|
0 |
|
55 |
6.3 (10.3) |
|
3.0 |
|
0.0 |
|
|
Total |
|
1 |
|
292 |
136.9 (63.7) |
|
141.5 |
|
118.0 |
|
|
Percent |
|
0 |
|
29 |
4.3 (5.8) |
|
2.4 |
|
0.0 |
|
|
*Picture data includes pictures viewed by researchers, rather than the total number of pictures on participants' Facebook page. Researchers viewed the first 100 tagged pictures, 100 album pictures, and all profile pictures. |
||||||||||
Descriptives. In general, profiles contained a greater quantity of pictures than posts overall. Likewise, there was a greater percentage of alcohol-related content among pictures (M = 3.2%; SD = 5.2%) than posts (M = .01%; SD = .03%). For each category, the minimum, maximum, and standard deviation scores indicate a high level of variability in the content posted on student profiles. For each variable, the distribution was positively skewed, with most participants having low levels of alcohol-related content.
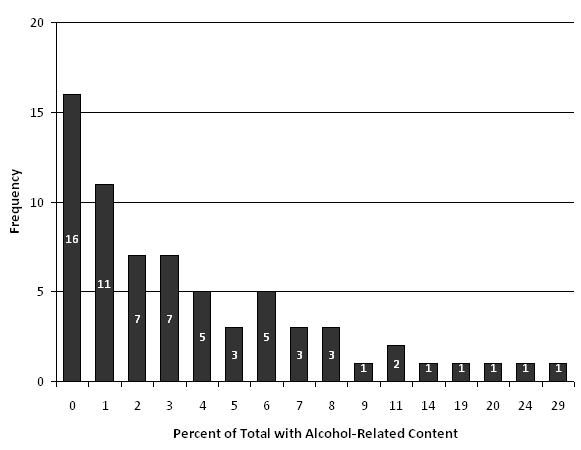
Figure 1. Frequency distribution of the percent of participants’ profiles containing alcohol-related content.
Figure 1 shows the frequency distribution of the overall percentage of Facebook content that was alcohol-related. With regard to overall content, combining data from pictures and posts, the mean percentage of alcohol-related content was 4.3% (SD = 5.8). Note the modal scores for alcohol-related content in Table 1, as well as the modal score for overall alcohol-related content in Figure 1, are 0. However, a minority of the participant profiles contained a substantial amount of alcohol-related content, with the overall alcohol-related content making up 29% of the content on one student’s profile.
Friends. Researchers recorded the number of friends on each participant’s profile. Number of friends ranged from 5 to 1,459 with a mean of 436.3 (SD = 289.5). Most participants (93%) had over 100 friends; the modal number of friends was 301. Many participants were Facebook friends with other participants, referred to here as “common friends.” Figure 2 is a simple sociogram illustrating the Facebook connections between participants in the study. Each node represents a participant. The lines between nodes are nondirectional; they indicate that the two participants are common friends. As you can see in the sociogram, most participants (85%) were friends with at least one other participant and several participants were friends with multiple other participants.
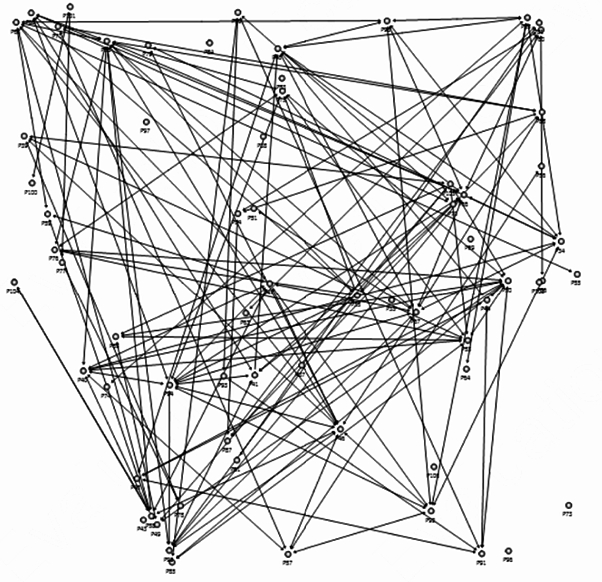
Figure 2 . Sociogram illustrating participants who were mutual Facebook friends.
An attempt was made to determine whether clusters of common friends were similar in regard to the variables in question, namely alcohol-related content on Facebook, alcohol use, or perceived alcohol use of close Facebook friends. Groups were formed within the database; a group was defined as two or more common friends. Groups of 10 or more common friends were analyzed for similarities by calculating t-tests comparing mean alcohol-related Facebook content between the group of common friends and the sample. There were no significant differences found (p’s > .05).
Underage participants. A significant proportion of the participants (85.5%, n = 58) were under 21 years old, the legal drinking age. Comparisons were made between the amount of alcohol-related content on the profiles of those under and over the legal drinking age. The profiles of participants of legal drinking age contained significantly more alcohol-related content (M = 10.9%, SD = 9.7%) than profiles of participants below the legal drinking age (M = 3.2%, SD = 3.9%), t (66) = -2.47, p = .034.
Facebook content and alcohol use. It was predicted that there would be significant positive relationships (1) between alcohol-related content on Facebook and reported alcohol use, (2) between alcohol-related content on Facebook and perceived use among Facebook friends, and (3) between reported alcohol use and perceived alcohol use of Facebook friends. Spearman’s rho calculations resulted in significant positive correlations between Facebook alcohol-related content and both reported frequency of alcohol use, r (68) = .38, p = .001 and reported quantity of alcohol use, r (68) = .38, p = .002. Figure 3 depicts the relationship between alcohol-related content on Facebook and reported quantity of alcohol use.
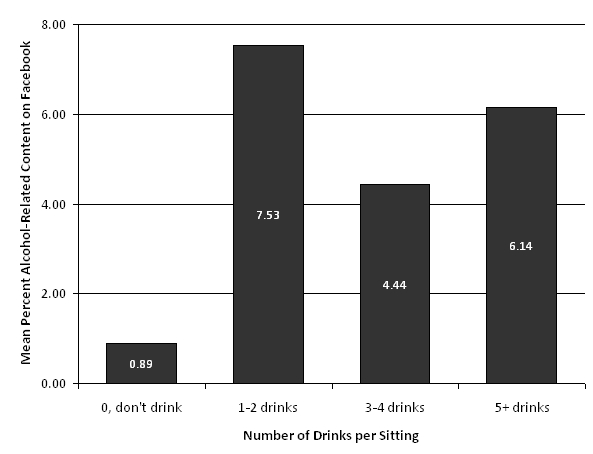
Figure 3. Mean percent of profile containing alcohol-related content
in relation to reported quantity of alcohol consumed in a typical drinking episode.
The hypothesized relationship between alcohol-related content on Facebook and perceived norms among close Facebook friends was tested by calculating Spearman’s rho correlations between the total percentage of alcohol-related content on Facebook and students’ reports of the frequency of alcohol use by their “close Facebook friends.” There was no significant relationship between the variables, r = (68) = .287, p = .134.
Finally, a Spearman’s rho correlation was calculated between participants’ reported frequency of alcohol use and the perceived frequency of alcohol use among their close Facebook friends. This data revealed two interesting patterns. The calculation resulted in a significant positive correlation, r = .50, p = .000. Increased self-reported alcohol use was associated with higher perceptions of others’ alcohol use. In addition, looking at the overall frequency distribution, reports for self use were much lower than reports for alcohol use by others. This distinction between self and others is illustrated in Figure 4.
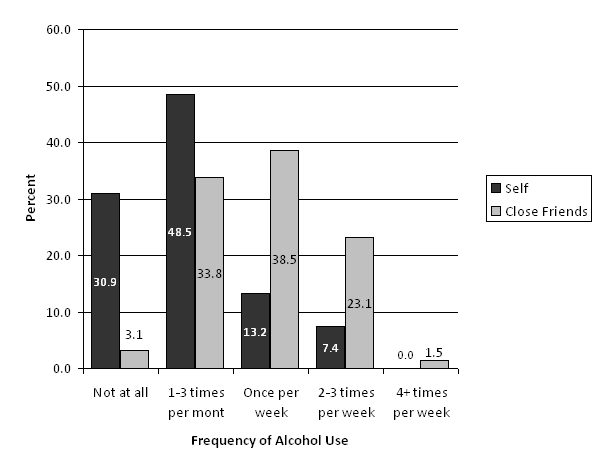
Figure 4. Frequency of alcohol use reported by participants
in comparison to perceived alcohol use of close Facebook friends.
Discussion
The purpose of this study was to explore and quantify the amount of alcohol-related content on Facebook, a popular SNS for college students. Findings indicate students in this sample are exposed to a considerable amount of alcohol-related content. The mean total percent of alcohol-related content was 4.3%. Perhaps more notable than that is the variability in the data; the percent of alcohol-related content on student profiles ranged from 0% to 29%. While many students have no such content on their profiles, some students have a substantial amount of alcohol-related content. Furthermore, these are conservative estimates, as only obvious alcohol-related content was included in the analyses; 27% of participant profiles contained ambiguous photographs that were likely alcohol-related. While these data shed light on the quantity of alcohol-related content, they do not shed light on students’ motivation for posting such content. Research on web-based media suggest many people design their homepage or SNS profile as a form of impression management (e.g., Kramer & Winter, 2008). Thus, posting alcohol-related content may be done to project an ideal image, perhaps one based on perceptions about normative drinking.
Looking again at Figure 2, one can see how interconnected students in the sample were, something that is probably not unique to this sample but instead is likely representative of the typical college campus. An additional factor to consider is the number of Facebook friends students have. Again, the data were variable, but most participants (93%) had over 100 friends. With each friend’s profile potentially containing alcohol-related content, even an average of 4.3% of the content, students can easily be exposed to a great deal of alcohol-related content.
Previous studies investigating Facebook use among college students have found the mean number of friends to be 246 (Walter, Van Der Heide, Kim, Westerman, & Tong, 2008) and 272 (Vanden Boogart, 2006). While our mean number of friends is higher, the previous studies were likely conducted before the advent or popularity of games on Facebook. Several Facebook games are centered around acquiring friends in order to gain points. Users who play such games can have friends numbering into the thousands, most of whom they have never met or interacted with beyond the game. In the present study, the mean percentage of Facebook friends who were reportedly “online only” friends was 6.8% (SD = 16.0%). Future research in which the friends are classified somehow according to amount of interaction between the user and the friend would provide more accurate estimates of content exposure.
In addition to quantifying alcohol-related content, the study was aimed at investigating the relationship between Facebook content and student behavior. Our findings suggest a significant relationship exists between alcohol-related content posted online and reported alcohol use. Specifically, the more alcohol-related content on one’s profile, the greater reported frequency and quantity of alcohol use, and vice versa. This finding is an important first step in determining the relationship between SNS content and student behavior. To date, there is no observational research quantifying online behavior and no data connecting alcohol-related content on SNSs to reported drinking behavior. While the present findings indicate these two variables are related, further work is necessary to explicate the nature of this relationship.
It is especially important to determine whether there is a causal relationship between SNS content and behavior. Students posting alcohol-related content on SNSs may be modeling alcohol use which leads to subsequent alcohol use in other students directly, or indirectly with perceived drinking norms as a potential mediator. That is, the preponderance of alcohol-related content on SNSs may perpetuate the misperceived drinking norms described in the literature (e.g., Perkins & Berkowitz, 1986); the overestimated drinking norms then can lead to increased alcohol use.
While research has shown that students overestimate drinking norms and that higher perceived norms are associated with greater alcohol use (e.g., Mattern & Neighbors, 2004), there are no data investigating the relationship between SNS content and perceived drinking norms. Our hypothesis that participants’ own alcohol-related content would be related to the perceived alcohol use of their Facebook friends was not supported. This could be due to the broad definition of a Facebook friend, which may include a family member, peer, coworker, casual acquaintance, or someone they have never met. While the intention in asking participants about their “close Facebook friends,” was for the participants to report on their peers, they may have been reporting with someone other than a peer in mind. Classifying friends more specifically, as is suggested above, would allow for a better analysis of these variables.
Empirical research investigating this relationship is necessary. More powerful than the present study, experimental research in which SNS content is manipulated and student drinking perceptions and intentions are measured could shed light on this question. Finding a causal relationship between SNS content and student behavior would mean that SNSs, with their pervasive use by college students, could have immense influence on student behavior, both positive and negative. While students may learn dangerous behaviors or develop unhealthy perceptions about standards of behavior, SNSs could be used to spread more accurate messages about behavior and to model more adaptive student behaviors. In other words, the impact of SNS content on behavior could be as much a blessing as a curse. To date, SNSs have not been used for intervention purposes.
It is important to note that 85.1% of participants were under 21 years old, the legal age limit to consume alcohol in the state where the study was conducted. These students, who could not legally purchase or consume alcohol, had both comments indicating alcohol use, and photographs of themselves using alcohol on their profile. This highlights the prevalence of underage drinking among college students. National studies of college students have found 77% of underage students had consumed alcohol in the previous year (Wechsler, Lee, Nelson, & Kuo, 2002). While our percentage is likely inflated, due to participants’ friends being able to post alcohol-related content on their profile, the reality is that most students in the sample had access to alcohol-related content online. Within the subsample of students who reported not using alcohol at all (n = 21), alcohol-related content on their profiles ranged from 0% to 6%, with a mean of 1.3% (SD = 1.7%).
Limitations
The findings of the current study must be considered in the context of limitations in regards to potential selection bias, reactivity, and variability within the data. It is important to note that the sample in this study was one of convenience. Participants self selected into the study. There are typically up to 400 students enrolled in the course per semester. With 68 participants, our sample included approximately 17% of students enrolled in the course. During recruitment, participants were told the study would involve researchers viewing their Facebook profile and recording information about alcohol use and other student behaviors. Thus, students could have opted to participate or not, depending on whether or not they wanted researchers to view their profile, thus systematically biasing the data. While it is possible selection bias could have resulted in inflated rates of alcohol-related content, it is more likely that some students with alcohol-related content opted out of the study to avoid allowing researchers to view their content. This would have resulted in the alcohol-related content rates to be conservative estimates of the actual content.
Reactivity is a second potential confound to the study. Because participants knew researchers would view alcohol-related content, and many participants were underage, it is possible that participants altered their profiles prior to data collection, thus skewing the data. Again, while it is possible participants posted more alcohol-related content in reaction to the research, it is more likely that they removed such content. Thus, while it is unknown whether reactivity was an issue, any reactivity would most likely have resulted in underestimates of alcohol-related content rather than overestimates.
Finally, there are challenges inherent in the very nature of data from SNSs that may have impacted the present findings. Referring again to Table 1, one can see the substantial variability in the data. This variability makes it difficult both to determine whether descriptive statistics (e.g., means) accurately represent the sample and to generalize from the sample to the population. A second challenge inherent in SNS data is the pace at which content changes, in many cases moment-by-moment. The data collected represent a sample of the content on the participants’ profiles at one point in time. It is possible that these data are not the most accurate representation of the profiles.
Conclusion
The amount of alcohol-related content observed, paired with the vast number of profiles participants have access to through their friends, indicate participants in the present study were potentially exposed to a substantial amount of alcohol-related content online. Generalizing to the greater population, these findings suggest college students are exposed to a great deal of alcohol-related content. With over 90% of college students using the site (Pempek et al., 2009), there is great potential for exposure to messages about alcohol use. As with other forms of media, this exposure may have important effects on students’ thoughts and behavior.
Future research must assess the effect of SNS content. Specifically, studies are necessary to determine whether SNS content can detrimentally affect student perceptions of normal drinking behavior and whether the content affects actual drinking behavior. Should SNS content be found to impact thoughts and behaviors, intervention strategies targeting and utilizing this media will need to be explored.
Notes
1. Throughout this paper, the word friend refers specifically to a friend on Facebook.
2. The debriefing statement summarized the overall purpose of the study and some general findings, as well as a statement about the legal drinking age and consequences of underage drinking. In order to avoid further contributing to inaccurate perceived drinking norms, the debriefing message did not inform students of the amount of alcohol-related content observed or alcohol use reported in the study.
Appendix A: Questionnaire
1. Gender
2. Class standing
3. Age
4. How often do you drink alcohol in a typical month?
• Not at all
• 1-3 times per month
• Once per week
• 2-3 times per week
• 4 or more times per week
5. When you drink, about how much do you have per sitting?
• One or two drinks
• Three or four drinks
• Five or more drinks
• Not Applicable, I don’t drink.
6. What percentage of your close Facebook friends use alcohol?
7. Of your close Facebook friends that use alcohol how often do they drink in a typical month?
• Not at all
• 1-3 times per month
• Once per week
• 2-3 times per week
• 4 or more times per week
8. How often do you use Facebook?
• More than once a day
• Once a day
• 4 or more times per week
• 2-3 times per week
• Once a week
• 2-3 times per month
• Once a month
9. How many hours per week do you spend on Facebook?
10. On a scale from 1(completely) to 6 (not at all), how well do you feel your Facebook page represents the “true” you?
11. How often do you use Facebook to communicate about alcohol related activities (e.g., parties)?
• Not at all
• 1-3 times per month
• Once per week
• 2-3 times per week
• 4 or more times per week
12. What percentage of your Facebook friends are online-only friends (you’ve never met them)?
13. What percentage of your Facebook friends are family members? co-workers? close friends?

This work is licensed under a Creative Commons Attribution-NonCommercial-NoDerivatives 4.0 International License.
Copyright © 2011 Angela K. Fournier, Steven W. Clarke