
The role of nonverbal communication cues in reducing videoconference fatigue: A comparison of 2D and virtual reality videoconference platforms
Vol.20,No.2(2026)

Videoconferencing for work and study purposes has become increasingly prevalent in people's daily lives. However, the negative effects of prolonged and frequent use of videoconferencing, particularly videoconference fatigue (VF), have also become more severe. With technological advancements, virtual reality (VR) videoconferencing has been proposed as a potential solution to mitigate these negative impacts, especially concerning nonverbal communication cues. This study investigates the varying effects of VR conferencing and traditional 2D videoconferencing on users’ nonverbal communication cues and VF. In total, 216 university students (Mage = 22.65, SD = 3.28; 44% male, 56% female) were randomly paired and assigned to use either VR or Zoom for a videoconferencing task. The findings revealed that students using VR reported fewer negative outcomes from nonverbal communication cues compared to those using Zoom. Among the nonverbal communication cues studied, only perceptions of feeling physically trapped significantly influenced VF, while mirror anxiety, production of nonverbal cues, and hyper-gaze were not found to be related. The results suggest that VR conferencing may offer a more effective approach to reducing VF by minimizing the negative effects of nonverbal communication cues.
nonverbal communication cues; virtual reality; videoconference fatigue; Zoom; feeling physically trapped
Benjamin Li
Wee Kim Wee School of Communication and Information, Nanyang Technological University, Singapore, Singapore
Benjamin Li is an Associate Professor at the Wee Kim Wee School of Communication and Information, Nanyang Technological University, Singapore. He studies the effects of communication and media technologies on human behavior and psychology.
Heng Zhang
School of Journalism and Communication, Chongqing University, Chongqing, China
Heng Zhang is an Associate Professor at the School of Journalism and Communication, Chongqing University. His research focuses on media effects, with a particular emphasis on how emerging technologies shape human cognition, emotion, and behavior.
Altman, I., & Taylor, D. A. (1973). Social penetration: The development of interpersonal relationships. Holt, Rinehart & Winston.
Amponsah, S., van Wyk, M. M., & Kolugu, M. K. (2022). Academic experiences of “Zoom-fatigue” as a virtual streaming phenomenon during the COVID-19 pandemic. International Journal of Web-Based Learning and Teaching Technologies (IJWLTT), 17(6), 1–16. https://doi.org/10.4018/IJWLTT.287555
AVIXA. (2023, December 6). 8 emerging conferencing technology trends for 2024. AVIXA Xchange. https://xchange.avixa.org/posts/8-emerging-conferencing-technology-trends-for-2024
Bailenson, J. N. (2021). Nonverbal overload: A theoretical argument for the causes of Zoom fatigue. Technology, Mind, and Behavior, 2(1), 1–6. https://doi.org/10.1037/tmb0000030
Baillon, A., Selim, A., & van Dolder, D. (2013). On the social nature of eyes: The effect of social cues in interaction and individual choice tasks. Evolution and Human Behavior, 34(2), 146–154. https://doi.org/10.1016/j.evolhumbehav.2012.12.001
Bambaeeroo, F., & Shokrpour, N. (2017). The impact of the teachers’ non-verbal communication on success in teaching. Journal of Advances in Medical Education & Professionalism, 5(2), 51–59. https://pubmed.ncbi.nlm.nih.gov/28367460
Bavelas, J. B., & Chovil, N. (2006). Nonverbal and verbal communication: Hand gestures and facial displays as part of language use in face-to-face dialogue. In V. Manusov & M. L. Patterson (Eds.), The SAGE handbook of nonverbal communication (pp. 97–115). Sage Publications. https://doi.org/10.4135/9781412976152.n6
Bennett, A. A., Campion, E. D., Keeler, K. R., & Keener, S. K. (2021). Videoconference fatigue? Exploring changes in fatigue after videoconference meetings during COVID-19. Journal of Applied Psychology, 106(3), 330–344. https://doi.org/10.1037/apl0000906
Bente, G., Rüggenberg, S., Krämer, N. C., & Eschenburg, F. (2008). Avatar-mediated networking: Increasing social presence and interpersonal trust in net-based collaborations. Human Communication Research, 34(2), 287–318. https://doi.org/10.1111/j.1468-2958.2008.00322.x
Beyea, D., Lim, C., Lover, A., Foxman, M., Ratan, R., & Leith, A. (2025). Zoom fatigue in review: A meta-analytical examination of videoconferencing fatigue’s antecedents. Computers in Human Behavior Reports, 17, Article 100571. https://doi.org/10.1016/j.chbr.2024.100571
Biocca, F. (1997). The cyborg’s dilemma: Progressive embodiment in virtual environments. Journal of Computer-Mediated Communication, 3(2), Article JCMC324. https://doi.org/10.1111/j.1083-6101.1997.tb00070.x
Bullock, A. N., Colvin, A. D., & Jackson, M. S. (2022). “All zoomed out”: Strategies for addressing Zoom fatigue in the age of COVID-19. In D. Guralnick, M. E. Auer, & A. Poce (Eds.), Innovations in learning and technology for the workplace and higher education (pp. 61–68). Springer. https://doi.org/10.1007/978-3-030-90677-1_6
Carțiș, A. (2023). “Zoom fatigue” in higher education: Videoconferencing impact on students’ fatigue. In E. Soare & C. Langa (Eds.), Education Facing Contemporary World Issues – EDU WORLD 2022 (Vol. 5, pp. 1355–1364). European Publisher. https://doi.org/10.15405/epes.23045.138
Coursaris, C. K., Van Osch, W., & Balogh, B. A. (2016). Do Facebook likes lead to shares or sales? Exploring the empirical links between social media content, brand equity, purchase intention, and engagement. In Proceedings of the 49th Hawaii International Conference on System Sciences (HICSS) (pp. 3546–3555). IEEE. https://doi.org/10.1109/HICSS.2016.444
Davis, F. D. (1989). Perceived usefulness, perceived ease of use, and user acceptance of information technology. MIS Quarterly, 13(3), 319–340. https://doi.org/10.2307/249008
Döring, N., De Moor, K., Fiedler, M., Schoenenberg, K., & Raake, A. (2022). Videoconference fatigue: A conceptual analysis. International Journal of Environmental Research and Public Health, 19(4), Article 2061. https://doi.org/10.3390/ijerph19042061
Elbogen, E. B., Lanier, M., Griffin, S. C., Blakey, S. M., Gluff, J. A., Wagner, H. R., & Tsai, J. (2022). A national study of Zoom fatigue and mental health during the COVID-19 pandemic: Implications for future remote work. Cyberpsychology, Behavior, and Social Networking, 25(7), 409–415. https://doi.org/10.1089/cyber.2021.0257
Fauville, G., Luo, M., Queiroz, A. C. M., Bailenson, J. N., & Hancock, J. (2021a). Nonverbal mechanisms predict Zoom fatigue and explain why women experience higher levels than men. SSRN Electronic Journal . https://doi.org/10.2139/ssrn.3820035
Fauville, G., Luo, M., Queiroz, A. C. M., Bailenson, J. N., & Hancock, J. (2021b). Zoom exhaustion & Fatigue Scale. Computers in Human Behavior Reports, 4, Article 100119. https://doi.org/10.1016/j.chbr.2021.100119
Fauville, G., Luo, M., Queiroz, A. C. M., Lee, A., Bailenson, J. N., & Hancock, J. (2023). Video-conferencing usage dynamics and nonverbal mechanisms exacerbate Zoom fatigue, particularly for women. Computers in Human Behavior Reports, 10, Article 100271. https://doi.org/10.1016/j.chbr.2023.100271
George, T. J., Atwater, L. E., Maneethai, D., & Madera, J. M. (2022). Supporting the productivity and wellbeing of remote workers: Lessons from COVID-19. Organizational Dynamics, 51(2), Article 100869. https://doi.org/10.1016/j.orgdyn.2021.100869
Gunawardena, C. N., & Zittle, F. J. (1997). Social presence as a predictor of satisfaction within a computer‐mediated conferencing environment. American Journal of Distance Education, 11(3), 8–26. https://doi.org/10.1080/08923649709526970
Hair, J. F. Jr., Matthews, L. M., Matthews, R. L., & Sarstedt, M. (2018). PLS-SEM or CB-SEM: Updated guidelines on which method to use. International Journal of Multivariate Data Analysis, 1(2), 107–123. https://doi.org/10.1504/IJMDA.2017.087624
Hinds, P. J. (1999). The cognitive and interpersonal costs of video. Media Psychology, 1(4), 283–311. https://doi.org/10.1207/s1532785xmep0104_1
Ishii, K., Lyons, M. M., & Carr, S. A. (2019). Revisiting media richness theory for today and future. Human Behavior and Emerging Technologies, 1(2), 124–131. https://doi.org/10.1002/hbe2.138
Joshi, P. K., & Bodkha, P. G. (2021). A comparative evaluation of students’ insight of face to face classroom lectures and virtual online lectures. National Journal of Physiology, Pharmacy and Pharmacology, 11(1), 28–33. https://doi.org/10.5455/njppp.2021.10.08225202026082020
Kappas, A., & Krämer, N. C. (Eds.). (2011). Face-to-face communication over the internet: Emotions in a web of culture, language and technology. Cambridge University Press. https://doi.org/10.1017/CBO9780511977589
Keller, J., & Pfattheicher, S. (2011). Vigilant self–regulation, cues of being watched and cooperativeness. European Journal of Personality, 25(5), 363–372. https://doi.org/10.1002/per.797
Li, B. (B). J., & Yee, A. Z. H. (2023). Understanding videoconference fatigue: A systematic review of dimensions, antecedents and theories. Internet Research, 33(2), 796–819. https://doi.org/10.1108/INTR-07-2021-0499
Lim, C., & Ratan, R. (2025). Zoom fatigue and facial dissatisfaction relate to virtual meeting engagement differently in the U.S. and South Korean contexts. Cyberpsychology, Behavior, and Social Networking, 28(2), 82–89. https://doi.org/10.1089/cyber.2024.0099
Lim, C., Ratan, R., Foxman, M., Beyea, D., Jeong, D., & Leith, A. P. (2025). Examining attitudes about the virtual workplace: Associations between zoom fatigue, impression management, and virtual meeting adoption intent. PLoS ONE, 20(2), Article e0312354. https://doi.org/10.1371/journal.pone.0312354
Macchi, G., & De Pisapia, N. (2024). Virtual reality, face-to-face, and 2D video conferencing differently impact fatigue, creativity, flow, and decision-making in workplace dynamics. Scientific Reports, 14, Article 10260. https://doi.org/10.1038/s41598-024-60942-6
Mamtani, H., Karaliuniene, R., Filippis, R. de, & Nagendrappa, S. (2022). Impact of videoconferencing applications on mental health. BJPsych International, 19(1), Article E1. https://doi.org/10.1192/bji.2021.40
Matthews, B., See, Z. S., & Day, J. (2021). Crisis and extended realities: Remote presence in the time of COVID-19. Media International Australia, 178(1), 198–209. https://doi.org/10.1177/1329878X20967165
Oh, S. Y., Bailenson, J., Krämer, N., & Li, B. (2016). Let the avatar brighten your smile: Effects of enhancing facial expressions in virtual environments. PLoS ONE, 11(9), Article e0161794. https://doi.org/10.1371/journal.pone.0161794
Ratan, R., Miller, D. B., & Bailenson, J. N. (2022). Facial appearance dissatisfaction explains differences in Zoom fatigue. Cyberpsychology, Behavior, and Social Networking, 25(2), 124–129. https://doi.org/10.1089/cyber.2021.0112
Riedl, R. (2022). On the stress potential of videoconferencing: Definition and root causes of Zoom fatigue. Electronic Markets, 32(1), 153–177. https://doi.org/10.1007/s12525-021-00501-3
Shockley, K. M., Gabriel, A. S., Robertson, D., Rosen, C. C., Chawla, N., Ganster, M. L., & Ezerins, M. E. (2021). The fatiguing effects of camera use in virtual meetings: A within-person field experiment. Journal of Applied Psychology, 106(8), 1137–1155. https://doi.org/10.1037/apl0000948
Slovacek, C. L. (2003). Desktop video-conferencing tasks: The effects of telepresence and teledata on cognitive load, conversational repair, and satisfaction [Doctoral dissertation, Rensselaer Polytechnic Institute]. https://www.proquest.com/docview/305310588/abstract/19082A6A40A24080PQ/1
Speidel, R., Felder, E., Schneider, A., & Öchsner, W. (2023). Virtual reality against Zoom fatigue? A field study on the teaching and learning experience in interactive video and VR conferencing. GMS Journal for Medical Education, 40(2), Article Doc19. https://doi.org/10.3205/zma001601
Speidel, R., Schneider, A., Körner, J., Grab-Kroll, C., & Öchsner, W. (2021). Did video kill the XR star? Digital trends in medical education before and after the COVID-19 outbreak from the perspective of students and lecturers from the faculty of medicine at the University of Ulm. GMS Journal for Medical Education, 38(6), Article Doc101. https://doi.org/10.3205/zma001497
ten Broeke, P., Olthof, M., Beckers, D. G. J., Hopkins, N. D., Graves, L. E. F., Carter, S. E., Cochrane, M., Gavin, D., Morris, A. S., Lichtwarck-Aschoff, A., Geurts, S. A. E., Thijssen, D. H. J., & Bijleveld, E. (2020). Temporal dynamics of sitting behavior at work. Proceedings of the National Academy of Sciences USA, 117(26), 14883–14889. https://doi.org/10.1073/pnas.2001284117
Thurlow, C., Tomic, A., & Lengel, L. (2004). Computer mediated communication. Sage Publications.
Tomprou, M., Kim, Y. J., Chikersal, P., Woolley, A. W., & Dabbish, L. A. (2021). Speaking out of turn: How video conferencing reduces vocal synchrony and collective intelligence. PLoS ONE, 16(3), Article e0247655. https://doi.org/10.1371/journal.pone.0247655
Valois, P., & Godin, G. (1991). The importance of selecting appropriate adjective pairs for measuring attitude based on the semantic differential method. Quality and Quantity, 25(1), 57–68. https://doi.org/10.1007/BF00138756
Velasco, C., Heltne, H. W., & Adserø, I. (2022, August 15). Are we ready for business meetings in virtual reality? BI Business Review. https://www.bi.edu/research/business-review/articles/2022/08/are-we-ready-for-business-meetings-in-virtual-reality/
Walther, J. B. (2007). Selective self-presentation in computer-mediated communication: Hyperpersonal dimensions of technology, language, and cognition. Computers in Human Behavior, 23(5), 2538–2557. https://doi.org/10.1016/j.chb.2006.05.002
Wang, I., & Ruiz, J. (2021). Examining the use of nonverbal communication in virtual agents. International Journal of Human–Computer Interaction, 37(17), 1648–1673. https://doi.org/10.1080/10447318.2021.1898851
Wiederhold, B. K. (2020). Connecting through technology during the coronavirus disease 2019 pandemic: Avoiding “Zoom fatigue.” Cyberpsychology, Behavior, and Social Networking, 23(7), 437–438. https://doi.org/10.1089/cyber.2020.29188.bkw
Williams, N. (2021). Working through COVID-19: ‘Zoom’ gloom and ‘Zoom’ fatigue. Occupational Medicine, 71(3), 164. https://doi.org/10.1093/occmed/kqab041
Xu, J., Whelan, E., O’Brien, A., & O’Hora, D. (2024). Does self-view mode generate more videoconferencing fatigue in women than men? An experiment using EEG signals. Cyberpsychology, Behavior, and Social Networking, 27(6), 426–430. https://doi.org/10.1089/cyber.2023.0577
Zhang, H., & Li, B. J. (2025). Investigating the effect of virtual backgrounds in 2D and virtual reality videoconferencing platforms on attention control and videoconference fatigue. International Journal of Human–Computer Interaction, 1–20. https://doi.org/10.1080/10447318.2025.2588711
Authors' Contribution
Benjamin Li: project administration, writing—review & editing, writing—original draft, resources, methodology, investigation, funding acquisition, conceptualization. Heng Zhang: writing—review & editing, writing—original draft, methodology, investigation, formal analysis, data curation, conceptualization.
Editorial Record
First submission received:
February 18, 2025
Revisions received:
July 17, 2025
December 17, 2025
February 20, 2026
Accepted for publication:
February 20, 2026
Editor in charge:
Lenka Dedkova
Introduction
In modern society, the distance between people is no longer measured solely by geography. Whether it’s colleagues from multinational companies or family and friends in different cities, videoconferencing allows us to overcome spatial boundaries and maintain close connections. This was especially evident during the COVID-19 pandemic when widespread lockdowns, and social distancing measures made face-to-face interactions difficult. It was during this period that videoconferencing emerged as a crucial tool for maintaining emotional bonds and ensuring the continuity of daily operations (Döring et al., 2022; Elbogen et al., 2022). Moreover, videoconferencing has not only transformed the way we work, learn, and communicate but also to some extent redefined concepts of intimacy and teamwork (Carțiș, 2023; George et al., 2022; Li & Yee, 2023; Lim et al., 2025). Compared to phone calls or emails, videoconferencing enables us to communicate while observing each other’s expressions and body language, adding warmth and authenticity to our interactions (Fauville et al., 2023). In this increasingly virtual world, videoconferencing has become an indispensable tool, bridging work and life while sustaining relationships across distances.
While videoconferencing has brought significant convenience to work and learning, some concerns have been raised regarding its increased use. In particular, videoconference fatigue (VF) has emerged as an important issue, as supported by a growing body of studies (e.g., Beyea et al., 2025; Fauville et al., 2023). VF is described as a “non-pathological tiredness resulting from videoconferencing that manifests in physical, emotional, cognitive, and social forms” (Li & Yee, 2023, p. 813). Recent studies have shown that prolonged VF can lead to burnout and increase depression, stress, and anxiety, adversely affecting mental health and well-being (Fauville et al., 2023; Williams, 2021).
During videoconferencing, people can transmit not only their voices but also see each other’s facial expressions, making it a mediated communication method similar to face-to-face interaction. In general, videoconferencing compensates for the lack of non-verbal communication cues present in other forms of computer-mediated communication (CMC), enhancing the sense of being present with others (Fauville et al., 2023). However, recent studies have also indicated that the non-verbal communication cues in videoconferencing can actually increase VF (Fauville et al., 2021a, 2023; Lim & Ratan, 2025; Xu et al., 2024). This may be because in contrast to face-to-face communication, traditional videoconferencing still lacks many non-verbal cues, such as full-body gestures, posture, and other signals below the shoulders that convey meaning and emotional nuance (Bailenson, 2021; Matthews et al., 2021). Even with participants’ video cameras turned on, videoconferencing may fail to capture certain gestures and spatial positioning (Speidel et al., 2023). Combined with the delays in video and audio transmission, this lack of signals makes it difficult for people to interpret speech content and predict pauses in conversation (Bailenson, 2021; Speidel et al., 2023).
However, with technological advancements, alternatives to 2D videoconferencing have gradually emerged in people’s lives—virtual reality (VR) conferencing. Unlike the traditionally flat 2D world of most videoconferencing platforms, VR can provide an immersive experience, offering depth and a sense of “being there” (Biocca, 1997). This experience is achieved through a combination of audio, visual, and sometimes tactile elements that together create a feeling of being in a 3D environment (Macchi & De Pisapia, 2024). Communication becomes more natural, familiar, and even more collaborative when users can move around in a virtual environment rather than being confined to the “Brady Bunch boxes” on a screen (Wiederhold, 2020). In other words, in 2D videoconferencing, users’ body language may not be fully displayed due to the limitations of the screen. However, in VR conferencing, users are in a space without physical constraints, allowing all of their movements to be fully represented through avatars. This provides a more comprehensive and enriched set of non-verbal communication cues. Therefore, we believe that VR, compared to 2D videoconferencing (e.g., Zoom), might help alleviate VF caused by non-verbal communication cues.
In this study, we will compare the impact of non-verbal cues in 2D videoconferencing (Zoom) versus VR conferencing. The aim is to explore whether VR conferencing can compensate for the deficiencies of non-verbal communication cues in 2D videoconferencing, thereby alleviating users’ VF, and enhancing their positive attitudes towards videoconferencing. By addressing these gaps, this study contributes to the understanding of how different videoconferencing platform (2D and VR) impact user experience and communication effectiveness, offering insights into potential improvements in virtual conferencing design and user satisfaction.
Literature Review
VR Conferencing and 2D Videoconferencing
2D videoconferencing typically relies on video calls and screen sharing, with participants communicating through cameras and microphones. While 2D videoconferencing has a lower technical threshold and broad applicability, its flat interaction mode somewhat limits the naturalness and depth of communication. In 2D videoconferencing, nonverbal cues such as gestures and spatial distance are limited, which can affect the efficiency and accuracy of communication (Speidel et al., 2023). Additionally, in 2D videoconferencing, especially in educational settings, teachers often complain that students turn off their cameras and microphones, resulting in a one-sided lecture where teachers receive no feedback (Joshi & Bodkha, 2021; Speidel et al., 2021). The lack of these verbal and nonverbal communication cues can undermine social presence, potentially leading to higher VF among users (Gunawardena & Zittle, 1997).
With the rapid development of remote work and virtual meeting technologies, virtual reality conferencing and traditional 2D videoconferencing have become essential tools for communication and collaboration. There are significant differences in experience and functionality between VR conferencing and 2D videoconferencing. First, VR conferencing provide an immersive environment, offering participants an experience as if they are in a real conference room (Wiederhold, 2020). Participants can interact with others through virtual avatars, using gestures and body language for more natural communication (Velasco, 2022). More importantly, users can walk freely within the virtual room, rather than being confined to their computer screens. These affordances suggest that VR conferencing may change how nonverbal communication cues are produced and perceived compared to 2D videoconferencing, with potential implications for VF.
Building on this comparison, the next section focuses on nonverbal communication cues in videoconferencing and introduces four key mechanisms that prior research has identified as central to VF.
Nonverbal Communication Cues
Research on CMC indicates that verbal and nonverbal communication cues significantly influence users’ perceptions of their technological experiences (Fauville et al., 2023; Thurlow et al., 2004). Earlier studies predominantly focused on verbal communication, often overlooking the importance of nonverbal cues. While nonverbal communication elements have long been studied in mediated contexts, the advent of videoconferencing brought renewed attention to these elements due to the visual dimension it adds to remote interactions. Nonverbal communication, including facial expressions, gestures, posture, and eye contact, plays a crucial role in face-to-face interactions (Bavelas & Chovil, 2006; Kappas & Krämer, 2011). These cues not only help convey emotions and intentions but also enhance understanding and memory retention of information (Bambaeeroo & Shokrpour, 2017; Wang & Ruiz, 2021). Compared to other CMC methods, videoconferencing is unique in its ability to provide more communication cues, especially nonverbal ones (Fauville et al., 2023). In videoconferencing, participants can both hear and see each other in real-time. According to social presence theory, the more verbal and nonverbal communication cues users can perceive in CMC, the stronger their sense of being together with others (Altman & Taylor, 1973; Walther, 2007).
However, the principles of the hyperpersonal communication model suggest that the cue-rich nature of videoconferencing can also make it particularly demanding (Slovacek, 2003; Walther, 2007). This is because users may need to exert more cognitive effort both to produce (e.g., aligning facial expressions with self-presentation) and process (e.g., interpreting others' gestures or micro-expressions) these nonverbal communication cues (Fauville et al., 2023; Walther, 2007). Bailenson (2021) further proposed a theoretical explanation for how nonverbal communication can lead to cognitive overload, as well as VF. This framework posits that videoconferencing can be exhausting because it induces nonverbal overload, driven by the need to attend to nonverbal cues in an online environment, such as synchronizing eye contact with multiple participants or monitoring oneself through the self-view function. Recently, Fauville et al., (2023) provided empirical support for Bailenson’s framework, identifying four nonverbal mechanisms that contribute to VF: (a) mirror anxiety, (b) the production and interpretation of nonverbal cues, (c) hyper-gaze, and (d) the feeling of being physically trapped.
Building on this framework, we argue that VR conferencing has the potential to alleviate these four nonverbal challenges compared to 2D videoconferencing. In traditional 2D videoconferencing, participants constantly see their real-time video image, which can trigger self-evaluation and mirror anxiety (Bailenson, 2021). By contrast, VR conferencing allows users to interact through avatars, shifting attention away from their physical appearance and reducing the pressure of self-monitoring (Speidel et al., 2023). Conventional 2D videoconferencing also attenuates many subtle nonverbal signals due to technical limitations (Fauville et al., 2021b, 2023), whereas VR platforms can use motion tracking to enable avatars to convey body language and facial expressions more naturally (Bente et al., 2008), thereby lowering the cognitive effort required to produce nonverbal cues (Bailenson, 2021; Speidel et al., 2023). Furthermore, 2D videoconferencing often induces a sense of hyper-gaze, as users feel that multiple others are looking at them at close range (Bailenson, 2021). VR conferencing, in contrast, restores more natural interpersonal distances in a three-dimensional space, which reduces the sensation of being intensely observed and the associated cognitive strain. Finally, whereas participants in 2D videoconferencing must remain within a narrow camera frame and often hold a fixed posture, VR conferencing allows users to move freely within the virtual environment, adjust their posture, or stand up, which helps to alleviate the feeling of being physically trapped and reduces physical fatigue.
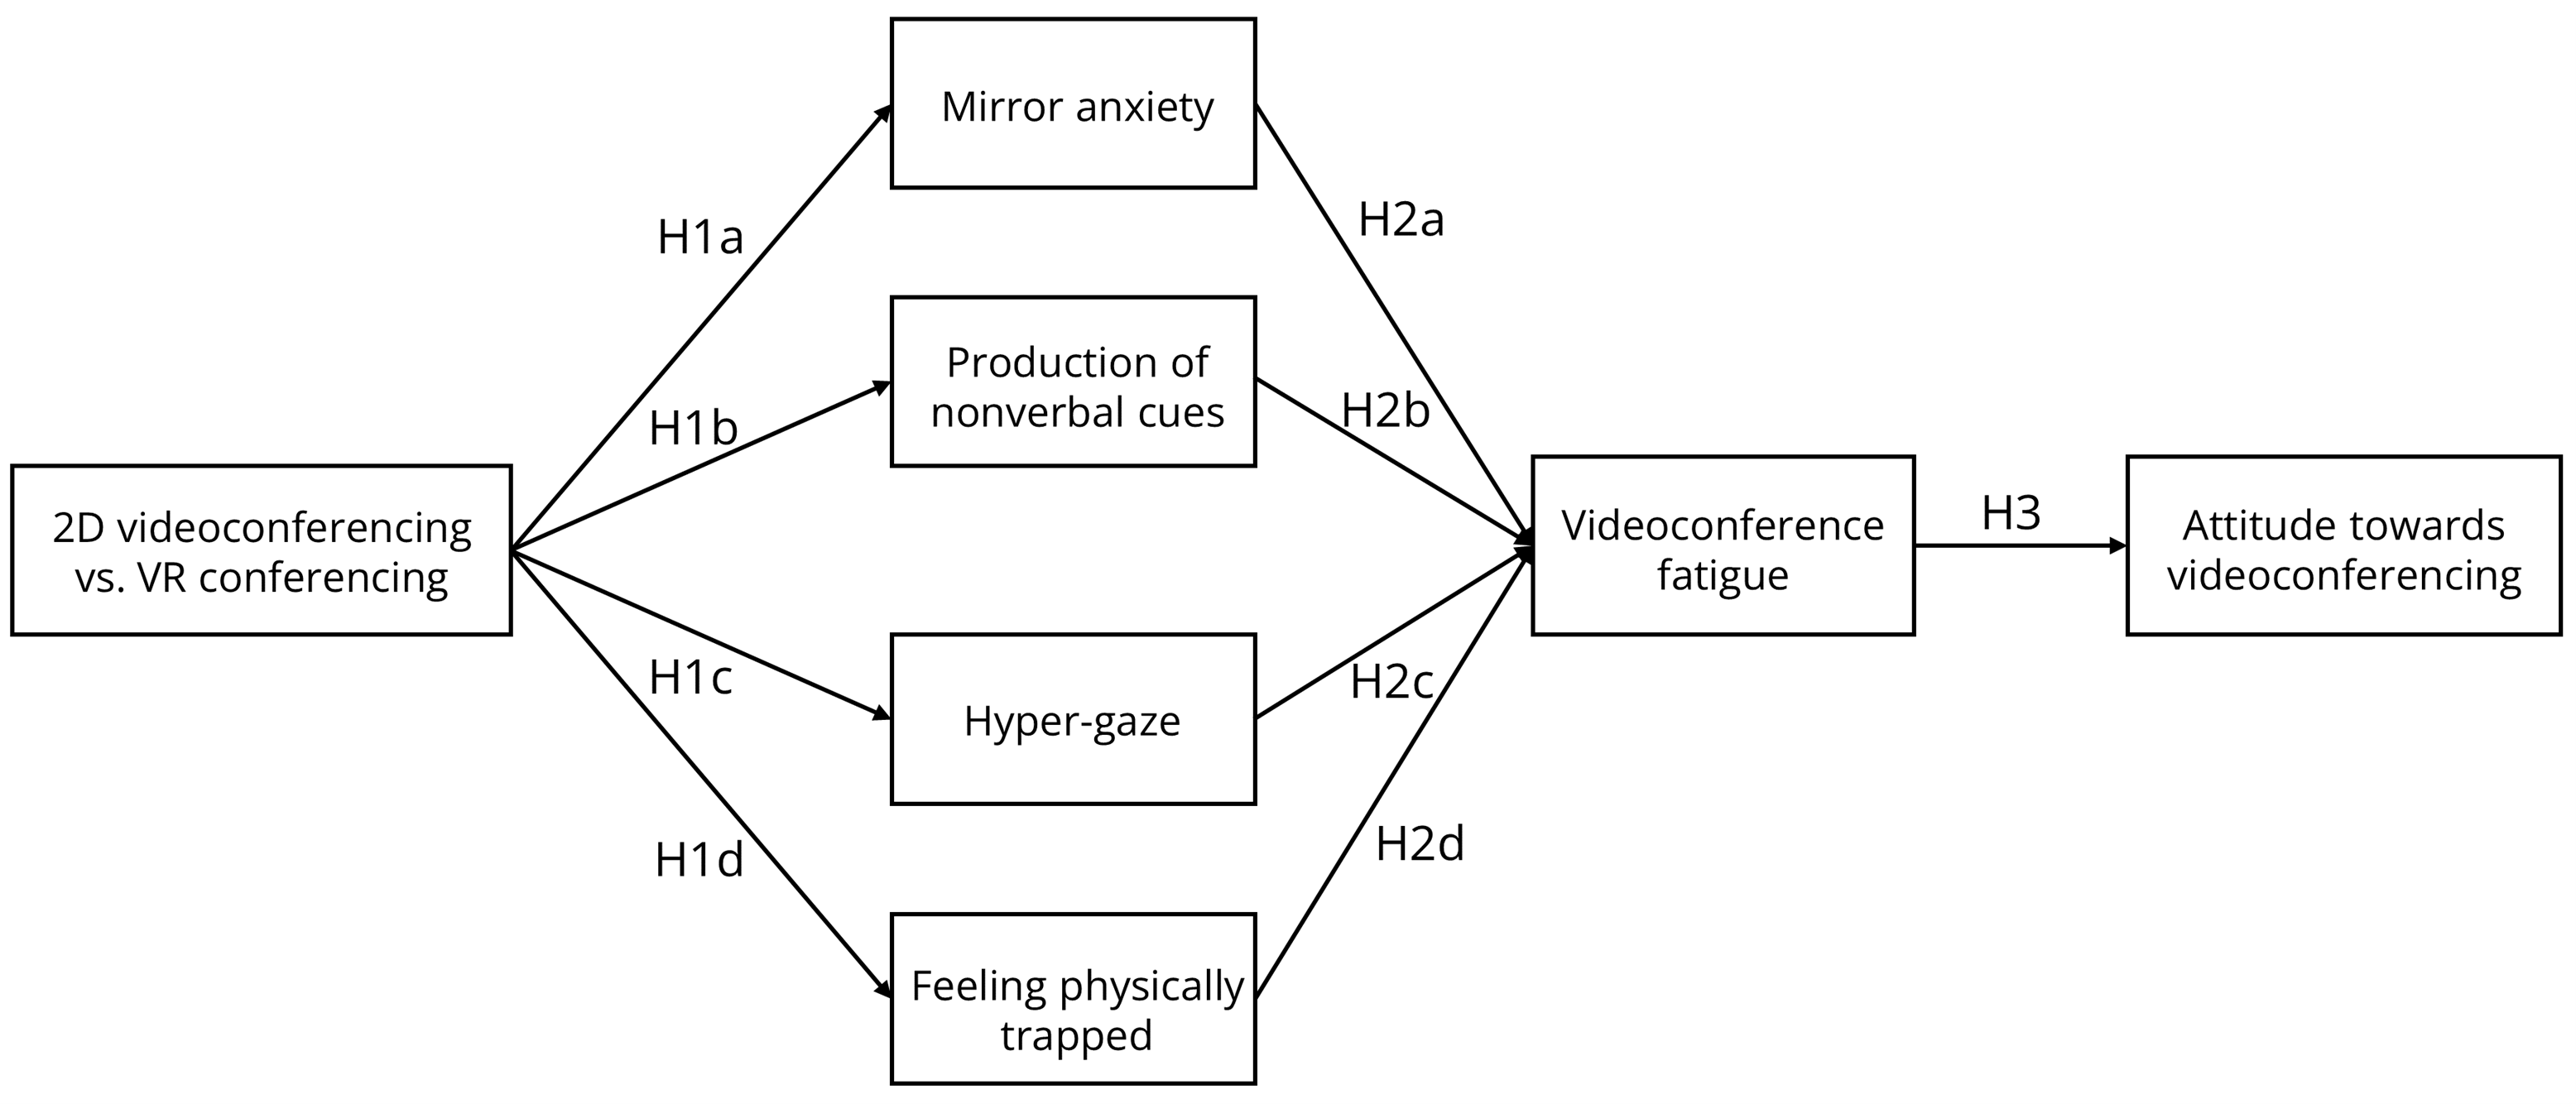
Taken together, these arguments suggest that VR conferencing, by providing an immersive and more flexible environment for nonverbal interaction, may mitigate the four nonverbal mechanisms identified by Fauville et al. (2023) and, in turn, reduce VF relative to 2D videoconferencing. Thus, we propose the following hypothesis:
H1: Users of VR conferencing will experience lower levels of (a) mirror anxiety, (b) production of nonverbal cues, (c) hyper-gaze, and (d) feeling physically trapped compared to users of 2D videoconferencing.
In summary, VR conferencing, by offering richer and more natural nonverbal communication possibilities, has the potential to overcome some of the limitations of 2D videoconferencing and reduce VF. In the following sections, we further examine how these nonverbal communication cues are related to VF in our empirical model.
Mirror Anxiety
Mirror anxiety refers to the discomfort and heightened self-consciousness individuals experience when viewing their real-time video reflection during videoconferencing (Fauville et al., 2021a, 2023). Unlike face-to-face communication, where self-awareness is less pronounced, participants in videoconferences are compelled to continually monitor their appearance and behavior as their own image is constantly displayed on the screen (Li & Yee, 2023; Ratan et al., 2022). This incessant self-surveillance imposes a significant psychological burden, as individuals strive to present themselves favorably, thereby depleting cognitive resources and amplifying stress and fatigue (Bailenson, 2021). The constant focus on self-presentation can also lead to performance anxiety, as individuals worry about how they are perceived by others.
Moreover, repeated exposure to one’s image can intensify self-critique, fostering negative emotions and self-evaluation, which detrimentally affect performance and job satisfaction, leading to long-term psychological fatigue (Li & Yee, 2023; Ratan et al., 2022; Shockley et al., 2021). The phenomenon of mirror anxiety is further exacerbated by societal pressures and professional expectations to maintain a certain standard of appearance and behavior, which can be particularly stressful in formal or high-stakes meetings. Additionally, mirror anxiety can distract participants, diminishing their attention to meeting content and thereby reducing work efficiency, which further contributes to VF. This distraction can also lead to a sense of disengagement from the meeting, as participants become preoccupied with their self-image rather than the discussion at hand. Thus, we propose the following hypothesis:
H2a: Mirror anxiety is positively correlated with VF.
Production of Nonverbal Cues
The second mechanism involves the intricate dynamics of producing nonverbal cues within the videoconferencing context (Bailenson, 2021; Fauville et al., 2023). Videoconferencing necessitates a greater cognitive load compared to audio-only interactions due to the simultaneous management of audio and video streams which can lead to issues (Amponsah et al., 2022). The fixed perspective of the camera renders nonverbal cues, such as head orientation and gaze, more ambiguous and challenging to interpret (Fauville et al., 2023; Tomprou et al., 2021). This ambiguity can lead to misunderstanding and miscommunication, as participants may misinterpret the intended meaning of these cues.
Importantly, videoconferencing not only complicates the interpretation of nonverbal cues but also increases the need for their production. The absence of natural conversational rhythms and rich contextual signals present in face-to-face communication often compels participants to exaggerate their facial expressions and gestures to convey their communicative intent clearly (Fauville et al., 2021a; Hinds, 1999). This exaggerated production of nonverbal cues adds emotional, cognitive, and physical demands, thereby contributing to VF (Bailenson, 2021).
Although Fauville et al. (2023) identified gesture interpretation as one of the key mechanisms of non-verbal cues, this study focuses on gesture production for the following reasons. First, gesture production introduces unique emotional and physical demands in videoconferencing environments, a pathway distinct from interpretational fatigue (Bailenson, 2021). Notably, in many meetings, participants may turn off their cameras, making it impossible for others to see their gestures and facial expressions. However, users often continue to produce gestures and facial movements out of habit to support their verbal communication, regardless of whether their camera is on or off. Second, research on CMC has shown that users often pay more attention to managing their own nonverbal expressions than observing others during interactions (Bailenson, 2021; Fauville et al., 2021a). Third, while the frequency of gestures and expressions may vary among individuals, these personal communication habits tend to remain stable across different videoconferencing contexts, making gesture production a consistent factor affecting user experience. Therefore, this study focuses on gesture production as a contributor to videoconferencing fatigue. Based on this, we propose the following hypothesis:
H2b: The production of nonverbal cues is positively correlated with VF.
Hyper-Gaze
The third mechanism, hyper-gaze, pertains to the sensation that one is being intensely observed by multiple participants simultaneously, a feeling that is particularly pronounced in videoconferencing (Bailenson, 2021; Fauville et al., 2023). In face-to-face interactions, eye contact is intermittent, allowing individuals to regulate their cognitive load by averting their gaze. However, in videoconferencing, participants often feel compelled to maintain constant eye contact to demonstrate attentiveness, which intensifies cognitive demands and contributes to fatigue (Li & Yee, 2023). This phenomenon of sustained gaze not only increases the cognitive load but also amplifies the psychological pressure of being continuously watched, compelling individuals to rigorously self-regulate their behavior to avoid social missteps that could harm their reputation (Baillon et al., 2013; Keller & Pfattheicher, 2011). The pressure to maintain appropriate eye contact can also lead to feelings of vulnerability and self-consciousness, as participants become acutely aware of their every movement and expression.
According to media richness theory, the vividness and real-time nature of videoconferencing amplify the intensity of this experience, further exacerbating cognitive and psychological fatigue (Ishii et al., 2019). The constant awareness of being observed can create a heightened state of alertness, leading to increased stress and anxiety over time. This sustained state of hyper-awareness can detract from participants’ ability to engage meaningfully with the meeting content, as they become more focused on managing their appearance and behavior. Hence, we propose the following hypothesis:
H2c: Hyper-gaze is positively correlated with VF.
Feeling Physically Trapped
The final mechanism concerns the sensation of being physically trapped during videoconferences (Fauville et al., 2023). Unlike face-to-face meetings, where participants can naturally adjust their posture, move around, or take brief breaks, videoconferencing often necessitates maintaining a fixed posture within the camera's frame for extended periods (Bailenson, 2021). This enforced immobility can lead to physical discomfort, such as muscle stiffness and neck pain, thereby increasing physical fatigue. The lack of physical movement can also contribute to feelings of restlessness and agitation, as participants are unable to release pent-up energy through natural movement.
Furthermore, participants must adhere to videoconferencing etiquette, such as sitting upright and consistently maintaining eye contact, which imposes an additional psychological burden (ten Broeke et al., 2020). The constant need to monitor and adjust one's posture to remain within the camera's view can lead to a sense of physical confinement and restriction. These combined physical and psychological constraints not only make participants feel physically confined but also significantly elevate VF, underscoring the dual pressures exerted by this mode of communication. The cumulative effect of these pressures can lead to a decline in overall well-being, as participants struggle to balance the demands of maintaining an appropriate appearance and engaging with the meeting content. Hence, we propose the following hypothesis:
H2d: Feeling physically trapped is positively correlated with VF.
Overall, this study focuses on four nonverbal mechanisms, including mirror anxiety, hyper-gaze, the feeling of being physically trapped, and the production of nonverbal cues. Prior work has repeatedly highlighted these mechanisms as central to how virtual meetings reshape users’ embodied experience and may contribute to videoconference fatigue. Mirror anxiety captures the self-focused visual attention elicited by the constant display of one’s own face on screen; hyper-gaze reflects the perception of being intensely and continuously watched by multiple others in a grid-like interface; the feeling of being physically trapped describes the bodily restriction associated with having to remain within a narrow visible area during meetings; and the production of nonverbal cues refers to users’ deliberate efforts to adjust or exaggerate gestures and facial expressions to compensate for the reduced richness and potential distortion of nonverbal signals in mediated interaction (Fauville et al., 2023; Mamtani et al., 2022). Taken together, these four mechanisms represent complementary dimensions of nonverbal experience, including self-focused attention, perceived social evaluation, bodily restriction, and expressive effort. These dimensions are theorized to place sustained demands on cognitive and emotional resources during virtual meetings. In this study, we therefore treat them as key nonverbal pathways through which different videoconferencing modalities (2D vs. VR) may differentially shape videoconference fatigue.
Additionally, conceptual and empirical work suggests that VF is not only an acute strain reaction to a single meeting but also a cumulative negative experience associated with the intensive and repeated use of videoconferencing tools, which can, over time, shape users’ overall evaluations of videoconferencing (Bennett et al., 2021; Döring et al., 2022; Riedl, 2022). As noted earlier, the constant need to monitor one’s appearance, manage nonverbal cues, cope with hyper-gaze, and sit with restricted movement makes virtual meetings feel exhausting, irritating, and difficult to control (Fauville et al., 2021b). Repeated exposure to these aversive experiences is likely to be encoded as negative affective associations with videoconferencing itself, leading individuals to perceive it as effortful, stressful, and less enjoyable.
Moreover, Lim et al. (2025) reported that higher levels of VF were negatively associated with users’ behavioral intention to adopt virtual meeting technologies, suggesting that fatigue can undermine people’s willingness to rely on such tools in the future. Similarly, Zhang and Li (2025) found that greater VF in both 2D and virtual reality conferencing environments was linked to more negative attitudes toward videoconferencing. Given that attitudes toward a technology are a central antecedent of behavioral intention in technology adoption research (Davis, 1989), it is reasonable to expect that VF erodes users’ overall attitude toward videoconferencing. Hence, the following hypothesis is proposed:
H3: The level of VF experienced by videoconference users is inversely proportional to attitude towards videoconferencing.
Figure 1 illustrates the conceptual model that is tested in this study.
Figure 1. Proposed Conceptual Model.
Methods
Study Participants and Research Design
Participants were 216 university students recruited from a large university in Singapore through course announcements and campus mailing lists. The sample included 95 men (44%) and 121 women (56%). Ages ranged from 18 to 37 years (M = 22.65, SD = 3.21). In terms of education, almost all participants had completed at least pre-university education: 31.5% reported having “A” Level qualifications, 25.5% held a diploma or advanced diploma, 26.4% were pursuing a Bachelor’s degree, and 14.8% were enrolled in a Master’s programme, with only a very small minority reporting lower or higher qualifications. As an indicator of socioeconomic status, monthly household income was broadly distributed across income brackets, with roughly one third of participants reporting incomes below SGD 7,000, about one third between SGD 7,001 and SGD 13,000, and the remainder above SGD 13,000. With regard to nationality, 52.8% of participants were Singaporean citizens, 7.9% were Singapore permanent residents, and 39.4% were international (non-resident) students.
In total, 216 university students took part in the experiment and were randomly assigned to one of two software conditions. In the 2D videoconferencing condition, participants used Zoom as the conferencing software. In the VR condition, participants used VRChat as the conferencing platform.
The study received approval from the Institutional Review Board of Nanyang Technological University. Participation was voluntary, with informed consent obtained from all respondents before the experiment began. Participants received $12 upon completing the experiment as compensation for their time.
Procedure
The procedure followed was adapted from Oh et al. (2016), who conducted a similar experiment using videoconference-mediated dyadic communication. Each pair of participants was placed in separate rooms on different floors to prevent any interaction before the experiment. Before the experiment began, participants provided informed consent. They were then instructed to complete two collaborative tasks with their partner via the assigned videoconferencing platform.
In the first task, “20 Questions,” one participant silently selected an object and the partner had up to 20 yes–no questions to infer what the object was. To succeed, partners had to formulate strategic questions, listen carefully to the answers, and coordinate turn-taking throughout the interaction. In the second task, “Stranded Island,” each dyad was given 15 minutes to imagine that they had survived a plane crash and were stranded on an island. From a list of 15 items, they had to discuss and jointly decide on three objects that would best help them survive. Both tasks required sustained mutual attention, negotiation, and the exchange of verbal and nonverbal cues, and were pretested in a pilot study to ensure that instructions and timing were appropriate. They were selected because they simulate the heightened cognitive and communicative demands of real virtual meetings, such as sustained mutual attention and ongoing two-way communication. Together, the two tasks lasted approximately 30 minutes. After completing the second task, participants filled out a post-experiment questionnaire that measured attention control, cognitive load, negative affect, attention fatigue, videoconference fatigue, attitudes toward videoconferencing, and demographic variables.
Equivalence of Experimental Groups
To examine whether the two experimental groups were comparable at baseline, we tested for differences in gender and age between the VR and Zoom conditions. A chi-square test indicated no significant association between condition and gender, χ² (1, N = 216) = 0.47, p = .49, φ = .05. An independent-samples t-test showed that participants in the Zoom condition were on average slightly older than those in the VR condition, t(214) = 2.07, p = .039, Cohen’s d = .28. Although this age difference reached statistical significance, the effect size was small (Cohen’s d = 0.28), suggesting that participants’ age was largely comparable across conditions. Given the relatively large sample size, even small mean differences can reach statistical significance; therefore, we focus on the effect size when evaluating the practical importance of this difference.
Measures
Videoconference Fatigue
This was measure using the Zoom Exhaustion and Fatigue (ZEF) scale (Fauville et al., 2021b). The fifteen items were measured on a five-point Likert scale (1 = not at all,
5 = extremely) and averaged to form an overall score for VF (M = 2.27, SD = .89, α = .95). The items contain five dimensions: general, visual, social, motivational, and emotional. General fatigue comprised of three items (e.g., How tired do you feel after videoconference?). Visual fatigue was measured with three items (e.g., How blurred does your vision get after videoconference?). Social fatigue comprised of three items (e.g., How much do you tend to avoid social situations after videoconference?). Motivational fatigue was measured with three items (e.g., How much do you dread having to do things after videoconference?). Emotional fatigue comprised of three items (e.g., How emotionally drained do you feel after videoconference?). The reliability of these items was acceptable (CR = 0.96, AVE = 0.61). A single composite score for VF was calculated by averaging the five dimensions, consistent with the procedure used in the original scale development and validation study (Fauville et al., 2021b).
Nonverbal Mechanisms
The nonverbal mechanisms are assessed through four aspects identified in Fauville et al.’s study (2023): mirror anxiety, the production of nonverbal communication cues, hyper-gaze, and feeling physically trapped. Mirror anxiety was measured with three items (e.g., During a videoconference, how concerned do you feel about what people think of your appearance?; M = 2.84, SD = 1.12, α = .88, CR = 0.89, AVE = 0.81). The production of nonverbal communication cues was measured with one item (During a videoconference, how much do you need to think about your body language?; M = 2.91, SD = 1.31). Hyper-gaze was measured with one item (During a videoconference, how often do you feel like people are staring at you?; M = 2.75, SD = 1.33) Feeling physically trapped was measured with three items (e.g., During a videoconference, how physically constrained do you feel?; M = 3.35, SD = 1.16, α = .82, CR = 0.82, AVE = 0.73).
Attitude Towards Videoconferencing
This was measured using 4 item pairs from the Valois and Godin’s study (1991). Examples of the item pairs include Bad and Good (M = 3.71, SD = .72, α = .88). The items were measured on a 5-point bipolar scale, and a higher score will indicate more positive attitude towards videoconferencing. The reliability of these items was acceptable (CR = 0.88, AVE = 0.73).
Data Analysis
Data analysis was conducted using IBM SPSS Statistics (v28.0.1.1) for independent samples t-tests and SmartPLS v3.3.9 for partial least squares structural equation modeling (PLS-SEM). This method was chosen due to its insensitivity to sample distribution. PLS-SEM allows us to delineate the relationships between various internal and external constructs within the structural model, as well as their associated items within the measurement model (Coursaris et al., 2016). Consequently, this analysis aids in evaluating the magnitude of each construct and their theoretical interrelations, thereby supporting the underlying theory.
Convergent validity, discriminant validity, construct means, and Cronbach’s alpha were tested, with results presented in Table 1. Also, the results meet the following criteria, the extracted mean variance (AVE) ≥ 0.5, composite reliability (CR) ≥ 0.7 (Hair et al., 2018). Thus, data show that all the extracted variables meet these thresholds, which proves the reliability and validity of the research data.
Results
To examine whether VF differs between VR conferencing and 2D videoconferencing, we conducted an independent samples t-test using bootstrapping (5,000 samples). The results indicated that participants reported significantly lower VF in VR conferencing (M = 2.02, SD = 0.82) compared to 2D videoconferencing (M = 2.51, SD = 0.89), t(214) = 4.16, p < .001. The mean difference was 0.49 (95% CI [0.26, 0.71]), indicating a moderate to large effect size (Cohen’s d = .86, 95% CI [.29, .84]). This suggests that VR conferencing may lead to lower VF as compared to traditional 2D videoconferencing. For the sake of transparency and to facilitate the interpretation of the model estimates, Table 2 presents the means and standard deviations of all outcome variables (the four nonverbal mechanisms, attitudes, and VF) separately for the Zoom and VR conditions. Moreover, Table 3 presents the correlations among all main study variables.
Table 1. Measurement Items, Measures and Descriptive Statistics for Covariates.
|
|
Wording |
M |
SD |
|
Mirror anxiety (MA, CR = 0.89, AVE = 0.81) |
2.84 |
1.12 |
|
|
MA1 |
During a videoconference/VR conferencing, how concerned do you feel about seeing yourself? |
2.87 |
1.18 |
|
MA2 |
During a videoconference/ VR conferencing, how concerned do you feel about what people think of your appearance? |
2.8 |
1.24 |
|
MA3 |
During a videoconference/ VR conferencing, how distracting is it to see yourself? |
2.86 |
1.34 |
|
Production of nonverbal communication cues (PNCC) |
|||
|
PNCC1 |
During a videoconference/ VR conferencing, how much do you need to think about your body language? |
2.91 |
1.31 |
|
Hyper-gaze (HG) |
|||
|
HG1 |
During a videoconference/ VR conferencing, how often do you feel like people are staring at you? |
2.75 |
1.33 |
|
Feeling physically trapped (FPT, CR = 0.82, AVE = 0.73) |
3.35 |
1.16 |
|
|
FPT1 |
During a videoconference/ VR conferencing, how often do you need to stay seated? |
3.55 |
1.34 |
|
FPT2 |
During a videoconference/ VR conferencing, how often do you feel you need to stay within the camera’s frame? |
3.36 |
1.36 |
|
FPT3 |
During a videoconference/VR conferencing, how physically |
3.14 |
1.32 |
|
Videoconferencing fatigue (CR = 0.84, AVE = 0.61) |
2.27 |
0.89 |
|
|
General 1 |
How tired do you feel after videoconferencing/ VR conferencing? |
2.31 |
1.04 |
|
General 2 |
How exhausted do you feel after videoconferencing/ VR conferencing? |
2.23 |
1.17 |
|
General 3 |
How mentally drained do you feel after videoconferencing/ VR conferencing? |
2.22 |
1.08 |
|
Visual 1 |
How blurred does your vision get after videoconferencing/ VR conferencing? |
2.16 |
1.12 |
|
Visual 2 |
How irritated do your eyes feel after videoconferencing/ VR conferencing? |
2.24 |
1.12 |
|
Visual 3 |
How much do your eyes hurt after videoconferencing/VR conferencing? |
2.18 |
1.12 |
|
Social 1 |
How much do you tend to avoid social situations after videoconferencing/VR conferencing? |
2.11 |
1.12 |
|
Social 2 |
How much do you want to be alone after videoconferencing/VR conferencing? |
2.33 |
1.2 |
|
Social 3 |
How much do you need time alone by yourself after videoconferencing/VR conferencing? |
2.41 |
1.19 |
|
Motivational 1 |
How much do you dread having to do things after videoconferencing/VR conferencing? |
2.4 |
1.25 |
|
Motivational 2 |
How often do you feel like doing nothing after videoconferencing/VR conferencing? |
2.63 |
1.33 |
|
Motivational 3 |
How often do you feel too tired to do other things after videoconferencing/VR conferencing? |
2.52 |
1.17 |
|
Emotional 1 |
How emotionally drained do you feel after videoconferencing/ VR conferencing? |
2.33 |
1.15 |
|
Emotional 2 |
How irritable do you feel after videoconferencing/VR conferencing? |
2.04 |
1.08 |
|
Emotional 3 |
How moody do you feel after videoconferencing/VR conferencing? |
1.88 |
0.98 |
|
Attitude towards videoconferencing/ VR conferencing (VA, CR = 0.82, AVE = 0.66) |
3.77 |
0.89 |
|
|
VA1 |
Bad − Good |
3.97 |
0.95 |
|
VA2 |
Unpleasant − Pleasant |
3.75 |
1.03 |
|
VA3 |
Boring − Enjoyable |
3.5 |
1.21 |
|
VA4 |
Worthless − Valuable |
3.85 |
0.97 |
Table 2. Descriptive Statistics of Outcome Variables by Condition (Zoom vs. VR).
|
|
Zoom |
VR |
||
|
|
M |
SD |
M |
SD |
|
Mirror anxiety |
3.31 |
0.94 |
2.38 |
1.11 |
|
Production of nonverbal cues |
3.4 |
1.2 |
2.43 |
1.25 |
|
Hyper-gaze |
3.27 |
1.24 |
2.23 |
1.21 |
|
Feeling physically trap |
3.89 |
0.81 |
2.82 |
1.22 |
|
Videoconference fatigue |
2.51 |
0.89 |
2.02 |
0.82 |
|
Videoconference attitude |
3.41 |
0.75 |
4.13 |
0.88 |
Table 3. Correlations Among the Main Study Variables.
|
|
1 |
2 |
3 |
4 |
5 |
6 |
|
1. Mirror anxiety |
1 |
|
|
|
|
|
|
2. Production of nonverbal cues |
.651** |
1 |
|
|
|
|
|
3. Hyper-gaze |
.678** |
.710** |
1 |
|
|
|
|
4. Feeling physically trap |
.668** |
.620** |
.657** |
1 |
|
|
|
5. Videoconference fatigue |
.443** |
.396** |
.455** |
.482** |
1 |
|
|
6. Videoconference attitude |
−.404** |
−.323** |
−.347** |
−.445** |
−.620** |
1 |
|
Note. *p < .05, **p < .01, ***p < .001. |
||||||
Table 4 shows the results of the structural model and presents the coefficients of each path. Significant relationships were found between videoconferencing modality and mirror anxiety (β = −.84, p < .001), production of nonverbal cues (β = −.74, p < .001), hyper-gaze (β = −.78, p < .001), and feeling physically trapped (β = −.92, p < .001), hence H1a, H1b, H1c, and H1d were supported. In other words, compared to participants using 2D videoconferencing, those using VR conferencing experienced lower levels of mirror anxiety, hyper-gaze, and feelings of being physically trapped, and expended less cognitive effort on producing nonverbal cues. In the structural model, the dummy-coded experimental condition (0 = Zoom, 1 = VR) thus had very strong effects on all four nonverbal mechanisms. These relatively large standardized coefficients (ranging from −.74 to −.92) reflect the substantial mean differences between the Zoom and VR groups on these constructs (see Table 2). Although such large effects are uncommon in social science research, they are plausible in the controlled laboratory context of this study and should be interpreted with caution.
We did not find evidence supporting associations between mirror anxiety (β = .12, p = .181), production of nonverbal cues (β = .02, p = .817), or hyper-gaze (β = .18, p = .064) and VF, and thus these results do not support H2a, H2b, and H2c. When all four nonverbal mechanisms were entered simultaneously as predictors of VF, only feeling physically trapped showed a significant effect (β = .29, p = .001), whereas the path from hyper-gaze to VF, although of small-to-medium magnitude (β = .18), did not reach conventional significance (p = .064), and its 95% confidence interval included zero. This indicates that the unique contribution of hyper-gaze beyond the other mechanisms is statistically inconclusive and should be interpreted with caution. By contrast, there was a significant relationship between feeling physically trapped and VF (β = .29, p = .001), hence H2d was supported. Moreover, VF was found to be negatively associated with attitude towards videoconferencing (β = −.62, p < .001), hence H3 was supported. Figure 2 shows the results of the path analysis in our proposed conceptual model.
Table 4. Model Results.
|
|
β |
SE |
p |
95% CI |
Hypothesis support |
|
Zoom/VR → Mirror anxiety |
−.839 |
0.115 |
< .001 |
[−1.052, −0.603] |
H1a supported |
|
Zoom/VR → Production of nonverbal cues |
−.742 |
0.122 |
< .001 |
[−0.976, −0.501] |
H1b supported |
|
Zoom/VR → Hyper-gaze |
−.783 |
0.119 |
< .001 |
[−1.010, −0.546] |
H1c supported |
|
Zoom/VR → Feeling physically trap |
−.919 |
0.109 |
< .001 |
[−0.976, −0.501] |
H1d supported |
|
Mirror anxiety → Videoconference fatigue |
.121 |
0.09 |
.181 |
[−0.056, 0.295] |
H2a not supported |
|
Production of nonverbal cues → Videoconference fatigue |
.022 |
0.097 |
.817 |
[−0.170, 0.212] |
H2b not supported |
|
Hyper-gaze → Videoconference fatigue |
.181 |
0.098 |
.064 |
[−0.015, 0.369] |
H2c not supported |
|
Feeling physically trap → Videoconference fatigue |
.285 |
0.088 |
.001 |
[0.120, 0.467] |
H2d supported |
|
Videoconference fatigue → Videoconference attitude |
−.624 |
0.049 |
< .001 |
[−0.718, −0.530] |
H3 supported |
|
Note. 1. The conferencing modality variable was coded as 0 for Zoom and 1 for VR; 2. Reported coefficients are standardized path coefficients (β) estimated with PLS-SEM in SmartPLS. |
|||||
Figure 2. Path Analysis in Proposed Conceptual Model.
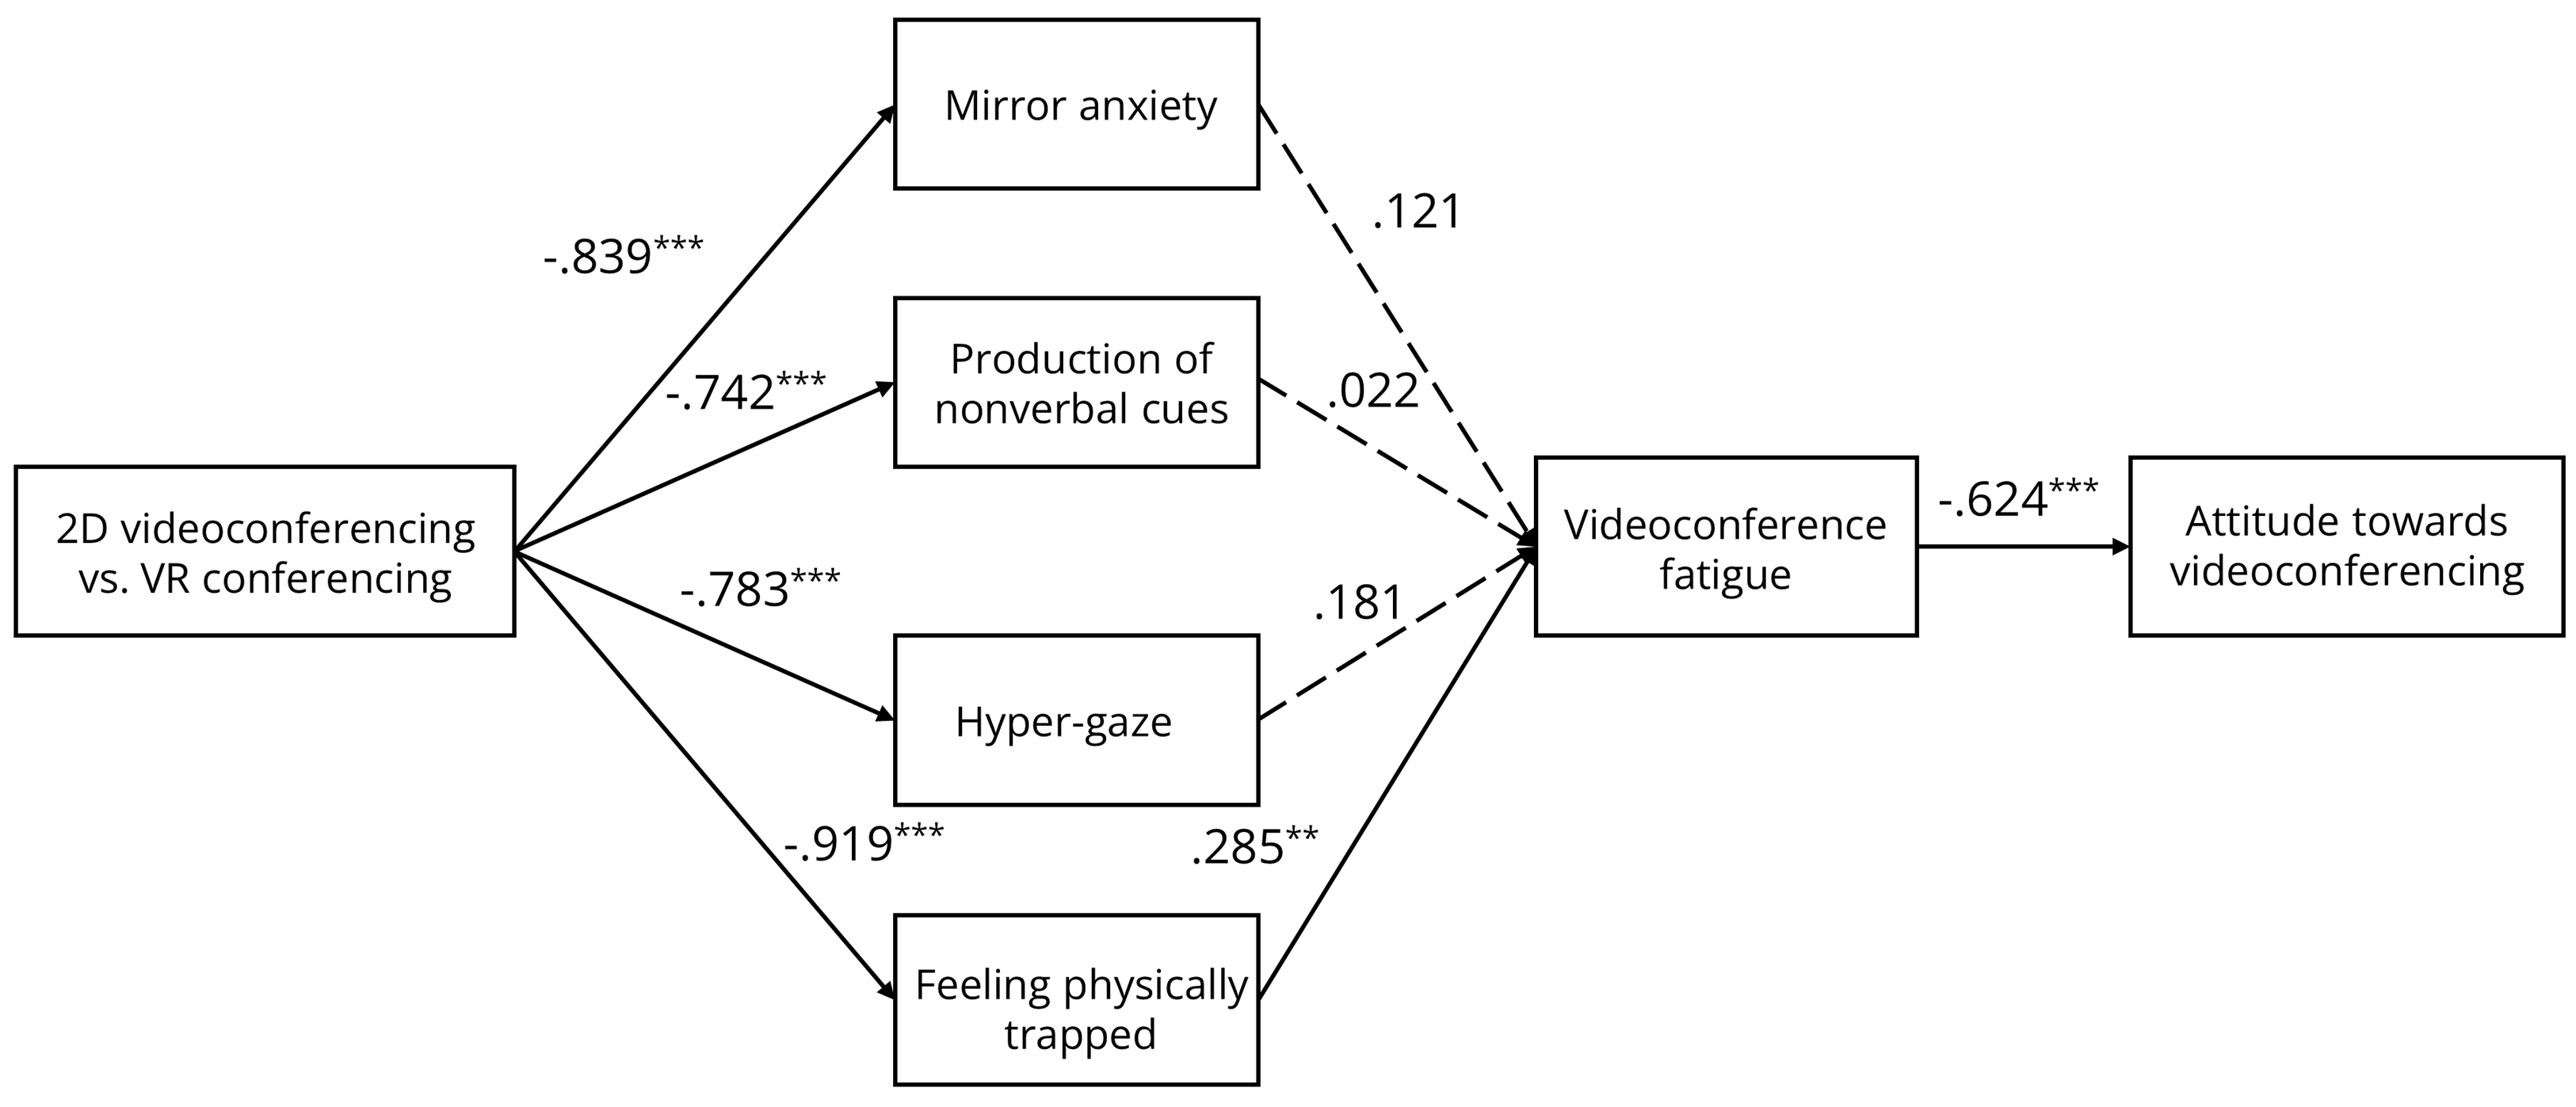
Note. *p < .05, **p < .01, ***p < .001.
Discussion
This study examines how VR conferencing and 2D videoconferencing affect nonverbal communication cues and subsequently the experience of VF. While nonverbal communication encompasses numerous mechanisms, the focus was on four specific aspects: mirror anxiety, production of nonverbal cues, hyper-gaze, and feeling physically trapped. Furthermore, the exploration centered on how these four aspects influence VF and how this fatigue ultimately affects attitudes toward videoconferencing.
Firstly, our results indicate that among the four nonverbal mechanisms, only feeling physically trapped leads to VF. The other three mechanisms: mirror anxiety, production of nonverbal cues, and hyper-gaze did not show significant associations with VF. This finding does not entirely align with previous research, which demonstrated that all four nonverbal mechanisms positively correlate with VF (Fauville et al., 2023). It is, however, understandable why our study’s results may differ from previous findings.
It is well-known that videoconferencing became an integral part of work and study due to the COVID-19 pandemic and has continued to be widely used since then. Research by Fauville et al. (2021b) was conducted in 2021 when videoconferencing was still a relatively new technology for many participants. In contrast, our data were collected in 2023, by which time videoconferencing had become a familiar tool for our participants. Over the past few years, participants have frequently used videoconferencing to maintain their learning progress. Consequently, user habits regarding videoconferencing have changed. Early studies, conducted when videoconferencing first became prevalent, found that many users were not yet familiar with the technology and therefore more prone to fatigue (Bullock et al., 2022). However, as time progressed, users adapted to videoconferencing and developed coping strategies such as adjusting their posture, using the “hide self-view” or “Zoom out self-view” feature to reduce mirror anxiety, and taking regular breaks to alleviate physical discomfort (AVIXA, 2023).
From the perspective of user behavior, the mechanisms include the production of nonverbal cues and the feeling of being physically trapped. First, our results indicate that the production of nonverbal cues did not show a significant association with VF. While gesture production can theoretically contribute to cognitive, emotional, and physical demands during videoconferencing, our findings suggest that its direct impact on fatigue may be less pronounced than previously assumed. This highlights the need for further investigation into the conditions under which gesture production contributes to VF and the factors that may moderate this relationship. On the other hand, the feeling of being physically trapped continues to contribute to user VF. Regardless of how familiar users are with the technology, they are still confined to sitting in front of the camera for extended periods. This physical confinement leads to discomfort and fatigue, which users continue to face.
Moreover, the higher the perceived VF, the more negative the users’ attitudes towards videoconferencing, which is consistent with previous research (Fauville, et al., 2021b). This highlights the critical importance of improving user experience and reducing VF, as videoconferencing has become an indispensable means of communication in people’s daily lives. Given the growing reliance on this technology for both professional and personal interactions, ensuring that users can engage in videoconferencing without excessive fatigue is essential.
Our study indicates that compared to 2D videoconferencing, VR conferencing can effectively mitigate the negative impact of nonverbal communication cues. Firstly, users experience less mirror anxiety in VR conferencing. This is because users can represent themselves with avatars, which they can customize before the meeting begins, eliminating concerns about their physical appearance. These avatars mask sources of anxiety related to appearance and behavior, significantly reducing mirror anxiety. Unlike 2D videoconferencing, users in VR meetings do not constantly see their own faces. Instead, much like in face-to-face interactions, they focus more on the facial expressions and body language of others rather than their own.
Then, users experience less hyper-gaze in VR conferencing because the distance between users’ gazes mimics natural interaction distances, unlike the close-up view common in 2D videoconferencing. In 2D settings, users often feel intensely observed by multiple participants simultaneously, increasing cognitive load and stress (Bailenson, 2021). However, VR conferencing simulates natural face-to-face interactions, allowing participants to maintain normal social distances and providing a greater sense of space (Speidel et al., 2023). This spatial adjustment alleviates the psychological pressure of being constantly watched, reducing cognitive fatigue.
Next, the negative impact of producing nonverbal cues is also diminished in VR conferencing. The technical limitations of 2D videoconferencing make it difficult to convey subtle nonverbal cues, requiring participants to expend additional cognitive resources to generate and interpret these cues (Bailenson, 2021; Fauville et al., 2023). VR conferencing, on the other hand, utilizes motion capture technology to accurately convey body language and facial expressions through avatars (Speidel et al., 2023). Participants can move freely in a three-dimensional space, using natural gestures, which reduces the cognitive load associated with generating nonverbal cues.
Then, in 2D videoconferencing, participants must maintain a fixed posture to remain within the camera’s view, limiting natural body movements and leading to physical discomfort and fatigue over extended periods. In contrast, VR conferencing allows participants to move freely within the virtual space, adjust their posture, or even stand up and move around, reducing physical discomfort and stiffness, thereby lowering physical fatigue. Overall, VR conferencing, through its unique use of avatars and interactive methods, effectively alleviates the fatigue caused by mirror anxiety, hyper-gaze, challenges in producing nonverbal cues, and physical constraints, making it a more user-friendly and efficient alternative to 2D videoconferencing.
Importantly, our results also demonstrate that higher levels of VF are associated with lower positive attitudes toward videoconferencing. This finding suggests that reducing physical fatigue through VR conferencing may not only improve immediate comfort during meetings but also enhance users’ overall attitudes toward the use of videoconferencing technologies, which is critical for sustaining engagement in virtual work and learning environments.
Theoretical and Practical Implications
Firstly, this study expands the understanding of nonverbal communication cues in videoconferencing, particularly in terms of mirror anxiety, the production of nonverbal cues, hyper-gaze, and the feeling of being physically trapped. By exploring the different impacts of these mechanisms in VR and 2D videoconferencing, it provides new perspectives and data support for the theory of nonverbal communication. This not only enriches the existing theoretical framework but also lays a solid foundation for further academic research into the potential and limitations of VR technology. Additionally, the study reveals that the factors influencing VF in 2D settings may change as users transition from being new to becoming proficient with the technology. Therefore, this type of research should be continuously validated over time. Furthermore, by demonstrating that lower levels of VF are associated with more positive attitudes toward videoconferencing, this study highlights the broader impact of VF reduction on users’ willingness to engage in virtual communication environments.
Practically, the study empirically validates the potential advantages of VR technology in alleviating VF, providing robust data to support investment decisions in videoconferencing technology by businesses and educational institutions. Through practical testing and user feedback, the research identifies current pain points and shortcomings in videoconferencing systems, offering specific directions for improvement. For example, the use of avatars to reduce mirror anxiety and motion capture technology to enhance nonverbal communication can significantly increase user satisfaction and comfort. Reducing VF not only improves the immediate user experience but also encourages continued use and acceptance of videoconferencing technologies. These insights provide actionable solutions that can be directly applied to enhance existing videoconferencing systems.
Limitations and Future Directions
While this study provides significant insights into the dynamics of different interaction modes through experimentation, it is essential to recognize its limitations and suggest directions for future research. Firstly, since VR technology is still in its early stages, many participants may have a strong interest in VR, which could temporarily alleviate feelings of fatigue. Therefore, future studies should be conducted after VR technology has become more widely used and its novelty has worn off to ensure the reliability and generalizability of the results. Additionally, the sample for this experiment consisted mainly of university students, which limits the generalizability of the findings. Future research should aim to expand the sample size and ensure diversity, including participants of different ages, professional backgrounds, and cultural contexts, to enhance the representativeness and applicability of the results. Moreover, this study only focused on the short-term effects of VR conferencing, which may not fully capture the actual impact and potential issues of long-term use of VR conferencing. Future research should design longitudinal studies to track participants’ fatigue and attitude changes after prolonged use of VR conferencing to gain a more comprehensive understanding. This will help reveal the real long-term effects of using VR technology and provide valuable insights for optimizing and improving VR conferencing tools. Lastly, we did not conduct an a priori power analysis. Instead, we performed a post hoc power analysis for two-tailed correlation tests (α = .05) based on our sample size (N = 216). The analysis indicated that the study had very high power to detect medium-sized effects (r ≈ .30; power > .99), but only moderate power for smaller effects comparable to the hyper-gaze path (r ≈ .18; power ≈ .76). Thus, medium and large effects are likely to be detected reliably, whereas smaller effects may not always reach significance and should be interpreted with caution.
In conclusion, this study directly compares VR conferencing with traditional 2D videoconferencing to examine their differential impacts on VF and attitudes towards videoconferencing. Our findings demonstrate that VR conferencing significantly reduces VF compared to 2D videoconferencing, and this is facilitated through lower reports of the negative effects of nonverbal communication cues, such as mirror anxiety, hyper-gaze, and the feeling of being physically trapped. This reduction in VF is further associated with more positive attitudes toward the use of videoconferencing technologies, suggesting that VR conferencing not only improves immediate user comfort but also enhances users’ willingness to engage in future virtual meetings. Importantly, the use of VR in videoconferencing remains in its early stages, providing substantial opportunities for further exploration. By systematically comparing VR and 2D videoconferencing, this study clarifies the specific advantages and limitations of each modality, providing actionable insights for researchers and practitioners seeking to optimize virtual meeting experiences.
Conflict of Interest
The authors have no conflicts of interest to declare.
Use of AI Services
The authors declare they have not used any AI services to generate or edit any part of the manuscript or data.
Acknowledgement
The author(s) declare financial support was received for the research, authorship, and/or publication of this article. This work was supported by a Singapore Ministry of Education Tier 1 Research (Gant Number: RG40/22) and by the AI Singapore Research Programme (Gant Number: AISG2-RP-2020–017).

This work is licensed under a Creative Commons Attribution-ShareAlike 4.0 International License.
Copyright © 2026 Benjamin Li, Heng Zhang