
Investigating the cross-sectional and longitudinal relationship of X and LINE use with online relationship and life satisfaction: A 4-Year cohort study among Japanese adults
Vol.19,No.4(2025)

The rise of social media has sparked extensive research on its relationship with well-being, yet drawing definitive conclusions remains challenging due to the multifaceted nature and diversification of these platforms. To gain a clearer understanding of this relationship, it is essential to explore how various social media platforms both cross-sectionally and longitudinally relate to well-being as well as to explore direct and indirect relationships mediated by other factors. Such investigation is lacking especially in Non-Western context. To address this gap, the author examined the cross-sectional and longitudinal relationships of X (formerly Twitter) and LINE use with life satisfaction—a key indicator of well-being—both directly and indirectly through the quality of online relationships, within a 4-year cohort of 1,674 Japanese adults. Multivariate latent growth curve modeling revealed a mixed relationship between X use and life satisfaction. Direct relationships with life satisfaction were negative, both cross-sectionally and longitudinally. In contrast, an indirect relationship—mediated by online relationships—was positive both cross-sectionally and longitudinally. In contrast, LINE use consistently showed positive relationships with life satisfaction, with both direct and indirect positive cross-sectional associations through online relationships. These findings underscore the growing diversity of social media platforms and the need to recognize that the relationship between social media use and life satisfaction varies depending on the platform in both Western and non-Western contexts. To support well-being, public education and digital literacy efforts should address the risks of excessive use of open-network platforms like X, while avoiding overgeneralizations to closed-network platforms like LINE, which may enhance well-being through supportive relationships.
X; Twitter; LINE; Japanese; social media; life satisfaction; well-being
Yu Takizawa
College of Education, Psychology, and Social Work, Flinders University, Adelaide
Yu Takizawa is a lecturer at the College of Education, Psychology, and Social Work at Flinders University, Australia. He holds a PhD in Digital Technology and Psychology from the University of Queensland in Australia and has over 10 years of experience in research and clinical practice. His primary research interests include the integration of digital technology in mental health, the application of neuroscience in mental health interventions, and the development and evaluation of teacher training programs focused on mental health support.
Ahmad, Z., Soroya, S. H., & Mahmood, K. (2023). Bridging social capital through the use of social networking sites: A systematic literature review. Journal of Human Behavior in the Social Environment, 33(4), 473–489. https://doi.org/10.1080/10911359.2022.2064025
Aichner, T., Grünfelder, M., Maurer, O., & Jegeni, D. (2021). Twenty-five years of social media: A review of social media applications and definitions from 1994 to 2019. Cyberpsychology, Behavior, and Social Networking, 24(4), 215–222. https://doi.org/10.1089/cyber.2020.0134
Akkaş, C., & Turan, A. H. (2023). Social network use and life satisfaction: A systematic review. Mental Health and Social Inclusion, 28(3), 231–251. https://doi.org/10.1108/MHSI-03-2023-0037
Alavi, M., Visentin, D. C., Thapa, D. K., Hunt, G. E., Watson, R., & Cleary, M. (2020). Chi-square for model fit in confirmatory factor analysis. Journal of Advanced Nursing, 76(9), 2209–2211. https://doi.org/10.1111/jan.14399
Beyens, I., Pouwels, J. L., van Driel, I. I., Keijsers, L., & Valkenburg, P. M. (2024). Social media use and adolescents’ well-being: Developing a typology of person-specific effect patterns. Communication Research, 51(6), 691–716. https://doi.org/10.1177/00936502211038196
Bruns, A., & Highfield, T. (2015). Is Habermas on Twitter? Social media and the public sphere. In A. Bruns, G. Enli, E. Skogerbø, A. O. Larsson, & C. Christensen (Eds.), The Routledge companion to social media and politics (pp. 56–73). Routledge.
Chen, J., & Wang, Y. (2021). Social media use for health purposes: Systematic review. Journal of Medical Internet Research, 23(5), Article e17917. https://doi.org/10.2196/17917
Cheong, J., MacKinnon, D. P., & Khoo, S. T. (2003). Investigation of mediational processes using parallel process latent growth curve modeling. Structural Equation Modeling: A Multidisciplinary Journal, 10(2), 238. https://doi.org/10.1207/S15328007SEM1002_5
Choi, D.-H. (2024). Impact of social media use on the life satisfaction of adolescents in South Korea through social support and social capital. SAGE Open, 14(2), 1–12. https://doi.org/10.1177/21582440241245010
Coyne, S. M., Rogers, A. A., Zurcher, J. D., Stockdale, L., & Booth, M. (2020). Does time spent using social media impact mental health?: An eight year longitudinal study. Computers in Human Behavior, 104, Article 106160. https://doi.org/10.1016/j.chb.2019.106160
Datareportal. (2024). Global social media statistics. https://datareportal.com/global-digital-overview
De Neve, J.-E., & Sachs, J. D. (2020). The SDGs and human well-being: A global analysis of synergies, trade-offs, and regional differences. Scientific Reports, 10(1), Article 15113. https://doi.org/10.1038/s41598-020-71916-9
Delle, F. A., Clayton, R. B., Jordan Jackson, F. F., & Lee, J. (2023). Facebook, Twitter, and Instagram: Simultaneously examining the association between three social networking sites and relationship stress and satisfaction. Psychology of Popular Media, 12(3), 335–343. https://doi.org/10.1037/ppm0000415
Diener, E. (2000). Subjective well-being: The science of happiness and a proposal for a national index. American Psychologist, 55(1), 34–43. https://doi.org/10.1037/0003-066X.55.1.34
Diener, E., Emmons, R. A., Larsen, R. J., & Griffin, S. (1985). The Satisfaction With Life Scale. Journal of Personality Assessment, 49(1), 71–75. https://doi.org/10.1207/s15327752jpa4901_13
Duncan, S. C., Duncan, T. E., Biglan, A., & Ary, D. (1998). Contributions of the social context to the development of adolescent substance use: A multivariate latent growth modeling approach. Drug and Alcohol Dependence, 50(1), 57–71. https://doi.org/10.1016/S0376-8716(98)00006-4
Glowacki, E. M., Wilcox, G. B., & Glowacki, J. B. (2021). Identifying #addiction concerns on Twitter during the COVID-19 pandemic: A text mining analysis. Substance Abuse, 42(1), 39–46. https://doi.org/10.1080/08897077.2020.1822489
Grieve, R., Indian, M., Witteveen, K., Anne Tolan, G., & Marrington, J. (2013). Face-to-face or Facebook: Can social connectedness be derived online? Computers in Human Behavior, 29(3), 604–609. https://doi.org/10.1016/j.chb.2012.11.017
Hair, J., Hult, G. T. M., Ringle, C., & Sarstedt, M. (2022). A Primer on Partial Least Squares Structural Equation Modeling (PLS-SEM). Sage.
Haslam, S. A., Jetten, J., Postmes, T., & Haslam, C. (2009). Social identity, health and well-being: An emerging agenda for applied psychology. Applied Psychology, 58(1), 1–23. https://doi.org/10.1111/j.1464-0597.2008.00379.x
Hsieh, A. Y., Lo, S. K., Chiu, Y. P., & Hwang, Y. (2024). Social anxiety and online media choice: Visual anonymity as a key. International Journal of Human-Computer Interaction, 40(23), 7908–7914. https://doi.org/10.1080/10447318.2023.2278303
Huang, L., Zheng, D., & Fan, W. (2022). Do social networking sites promote life satisfaction? The explanation from an online and offline social capital transformation. Information Technology & People, 35(2), 703–722. https://doi.org/10.1108/ITP-03-2020-0143
Huppert, F. A. (2009). Psychological well-being: Evidence regarding its causes and consequences. Applied Psychology: Health and Well-Being, 1(2), 137–164. https://doi.org/10.1111/j.1758-0854.2009.01008.x
IBM Corp. (2021). IBM SPSS Statistics for Windows, Version 28.0. IBM Corp.
Jaidka, K. (2022). Cross-platform- and subgroup-differences in the well-being effects of Twitter, Instagram, and Facebook in the United States. Scientific Reports, 12(1), Article 3271. https://doi.org/10.1038/s41598-022-07219-y
Karim, F., Oyewande, A. A., Abdalla, L. F., Chaudhry Ehsanullah, R., & Khan, S. (2020). Social media use and its connection to mental health: A systematic review. Cureus, 12(6), Article e8627. https://doi.org/10.7759/cureus.8627
Kim, E. S., Delaney, S. W., Tay, L., Chen, Y., Diener, E., & Vanderweele, T. J. (2021). Life satisfaction and subsequent physical, behavioral, and psychosocial health in older adults. The Milbank Quarterly, 99(1), 209–239. https://doi.org/10.1111/1468-0009.12497
Kimura, E. (2023). 大学生のソーシャルメディア利用の規定要因: Twitter,Instagram,TikTokに着目して [Social media communication among Japanese university students: Focusing on determinants of using Twitter, Instagram, and TikTok]. Journal of Advanced Media Studies, 102, 21–35. https://doi.org/10.24460/jamsmedia.102.0_21
Kross, E., Verduyn, P., Sheppes, G., Costello, C. K., Jonides, J., & Ybarra, O. (2021). Social media and well-being: Pitfalls, progress, and next steps. Trends in Cognitive Sciences, 25(1), 55–66. https://doi.org/10.1016/j.tics.2020.10.005
Lin, S., Liu, D., Niu, G., & Longobardi, C. (2022). Active social network sites use and loneliness: The mediating role of social support and self-esteem. Current Psychology, 41(3), 1279–1286. https://doi.org/10.1007/s12144-020-00658-8
Lup, K., Trub, L., & Rosenthal, L. (2015). Instagram #Instasad?: Exploring associations among Instagram use, depressive symptoms, negative social comparison, and strangers followed. Cyberpsychology, Behavior, and Social Networking, 18(5), 247–252. https://doi.org/10.1089/cyber.2014.0560
MacCallum, R. C., Browne, M. W., & Sugawara, H. M. (1996). Power analysis and determination of sample size for covariance structure modeling. Psychological Methods, 1(2), 130–149. https://doi.org/10.1037/1082-989X.1.2.130
Marttila, E., Koivula, A., & Räsänen, P. (2021). Does excessive social media use decrease subjective well-being? A longitudinal analysis of the relationship between problematic use, loneliness and life satisfaction. Telematics and Informatics, 59, Article 101556. https://doi.org/10.1016/j.tele.2020.101556
Muthén, L. K., & Muthén, B. O. (1998). Mplus user’s guide. Muthén & Muthén.
Phua, J., Jin, S. V., & Kim, J. (Jay). (2017). Uses and gratifications of social networking sites for bridging and bonding social capital: A comparison of Facebook, Twitter, Instagram, and Snapchat. Computers in Human Behavior, 72, 115–122. https://doi.org/10.1016/j.chb.2017.02.041
Ruggeri, K., Garcia-Garzon, E., Maguire, Á., Matz, S., & Huppert, F. A. (2020). Well-being is more than happiness and life satisfaction: A multidimensional analysis of 21 countries. Health and Quality of Life Outcomes, 18(1), 192. https://doi.org/10.1186/s12955-020-01423-y
Ryan, R., & Deci, E. (2001). On happiness and human potentials: A review of research on hedonic and eudaimonic well-being. Annual Review of Psychology, 52(1), 141–166. https://doi.org/10.1146/annurev.psych.52.1.141
Sajuria, J., vanHeerde-Hudson, J., Hudson, D., Dasandi, N., & Theocharis, Y. (2014). Tweeting alone? An analysis of bridging and bonding social capital in online networks. American Politics Research, 43(4), 708–738. https://doi.org/10.1177/1532673X14557942
Sakurai, R., Nemoto, Y., Mastunaga, H., & Fujiwara, Y. (2021). Who is mentally healthy? Mental health profiles of Japanese social networking service users with a focus on LINE, Facebook, Twitter, and Instagram. PLOS ONE, 16(3), Article e0246090. https://doi.org/10.1371/journal.pone.0246090
Simons, M., Reijnders, J., Janssens, M., Lataster, J., & Jacobs, N. (2022). Staying connected in old age: Associations between bonding social capital, loneliness and well-being and the value of digital media. Aging & Mental Health, 27(1), 147–155. https://doi.org/10.1080/13607863.2022.2036947
Social Media Lab. (2024). 2024年12月版!性別・年齢別 SNSユーザー数(X(Twitter)、Instagram、TikTokなど13媒体)[July 2025 edition! Gender and age breakdown of SNS users (13 platforms including X (Twitter), Instagram, TikTok, etc.)]. https://gaiax-socialmedialab.jp/socialmedia/435
Spottswood, E. L., & Wohn, D. Y. (2020). Online social capital: Recent trends in research. Current Opinion in Psychology, 36, 147–152. https://doi.org/10.1016/j.copsyc.2020.07.031
Sumino, Z. (1994). The development of Japanese version of the Satisfaction with Life Scale (SWLS). In Proceedings of the 51st annual meeting of Japanese Association of Educational Psychology, 36, (Vol. 36, p. 192).
Suzuki, S., & Takemura, K. (2013). Culture and social media: Exploration of differences between the United States and Japan. In M. A. Gonzalez-Perez, V. Taras, & M. Caprar (Eds.), Social media in strategic management (Vol. 11, pp. 245–258). Emerald Group Publishing. https://doi.org/10.1108/S1877-6361(2013)0000011016
Tateno, M., Teo, A. R., Ukai, W., Kanazawa, J., Katsuki, R., Kubo, H., & Kato, T. A. (2019). Internet addiction, smartphone addiction, and hikikomori trait in Japanese young adult: Social Isolation and social network. Frontiers in Psychiatry, 10. https://doi.org/10.3389/fpsyt.2019.00455
Tu, Z., He, J., Li, Y., Wang, Z., Wang, C., Tian, J., & Tang, Y. (2023). Can restricting while-in-bed smartphone use improve sleep quality via decreasing pre-sleep cognitive arousal among Chinese undergraduates with problematic smartphone use? Longitudinal mediation analysis using parallel process latent growth curve modeling. Addictive Behaviors, 147, Article 107825. https://doi.org/10.1016/j.addbeh.2023.107825
Valkenburg, P. M. (2022). Social media use and well-being: What we know and what we need to know. Current Opinion in Psychology, 45, Article 101294. https://doi.org/10.1016/j.copsyc.2021.12.006
Valkenburg, P. M., & Peter, J. (2009). Social consequences of the internet for adolescents: A decade of research. Current Directions in Psychological Science, 18(1), 1–5. https://doi.org/10.1111/j.1467-8721.2009.01595.x
Verduyn, P., Gugushvili, N., & Kross, E. (2022). Do social networking sites influence well-being? The extended active-passive model. Current Directions in Psychological Science, 31(1), 62–68. https://doi.org/10.1177/09637214211053637
Verduyn, P., Gugushvili, N., Massar, K., Täht, K., & Kross, E. (2020). Social comparison on social networking sites. Current Opinion in Psychology, 36, 32–37. https://doi.org/10.1016/j.copsyc.2020.04.002
Wang, X., & Cheng, Z. (2020). Cross-sectional studies: Strengths, weaknesses, and recommendations. CHEST, 158(1), S65–S71. https://doi.org/10.1016/j.chest.2020.03.012
Authors’ Contribution
This study was devised and conducted by Yu Takizawa.
Editorial record
First submission received:
January 30, 2025
Revisions received:
May 17, 2025
June 26, 2025
Accepted for publication:
June 30, 2025
Editor in charge:
Alexander P. Schouten
Introduction
Driven by the widespread use of mobile devices and applications, the use of social media has experienced a surge over the past decade, with 5.22 billion people using these platforms in 2024, accounting for 63.8% of the global population and 94.5% of internet users (Datareportal, 2024). Social media encompasses a diverse range of digital platforms (e.g., YouTube, Instagram, TikTok, Snapchat, Pinterest, Facebook, LinkedIn, X, and Google+) that allow users to create and share various types of content, such as text, images, videos, and audio (Aichner et al., 2021). These platforms enable individuals to express their personal opinions, engage in discussions, share entertainment, news, and other forms of media, as well as stay updated on global events and trends (Chen & Wang, 2021). Social media not only provides a space for self-expression but also facilitates interaction, enabling users to connect with friends, family, and even strangers who share similar interests or viewpoints (Kross et al., 2021). Beyond personal connections, social media platforms also serve as powerful tools for businesses, influencers, and organizations to reach and engage with a wider audience, build communities, promote products or ideas, and drive social change (Karim et al., 2020). Social media has become an integral part of modern life, influencing communication, culture, and the way we consume information.
The rapid expansion of social media has generated considerable public and academic debate about its possible impact on individuals' well-being. Well-being extends beyond the mere absence of mental illness; it reflects a holistic state of positive functioning in which individuals experience a balance of emotional, psychological, and social health (Huppert, 2009). This state enables people to lead fulfilling and meaningful lives characterized by satisfaction, comfort, and happiness (Ruggeri et al., 2020). Maintaining positive well-being is essential for personal growth, thriving in one’s personal life, and contributing to the sustainable development of global societies (De Neve & Sachs, 2020). Despite numerous studies conducted over the past decade, the relationship between social media use and well-being remains inconclusive, with conflicting results suggesting a complex and multifaceted connection that warrants further exploration.
Relationship Between Social Media Use and Well-Being
A substantial body of research indicates that overall social media use is negatively correlated with well-being, with longer and more frequent use predicting lower levels of well-being (Valkenburg, 2022). These negative effects are often attributed to the increasing reliance on social media for information, entertainment, and social connection, which makes it increasingly difficult for users to disengage (Akkaş & Turan, 2023). This dependency can foster addictive behaviors that interfere with daily tasks and disrupt other crucial aspects of life, leading to a diminished quality of life (Kross et al., 2021). Moreover, excessive social media use has been linked to sedentary lifestyles, reduced face-to-face social interactions, and decreased physical activity, all of which contribute to poorer overall well-being (Coyne et al., 2020). Research also highlights how social media use can lower well-being by fostering social comparison and diminishing self-esteem (Verduyn et al., 2020).
Nevertheless, other studies have highlighted that the effects of social media on well-being vary depending on individual usage patterns. Active use—such as direct engagement and meaningful interactions—is generally associated with better well-being outcomes. In contrast, passive use—such as browsing content without interaction—has been linked to negative outcomes, including increased social comparison, feelings of envy, and reduced well-being (Marttila et al., 2021). Verduyn et al. (2022) extended the traditional active–passive use framework by proposing the extended active–passive model, which posits that the impact of active use depends on the presence of reciprocity and the nature of the engagement, whether it leads to positive or negative experiences. Similarly, the impact of passive use is shaped by the self-relevance of the content and the emotional valence of the stories encountered—particularly those involving success or failure. Moreover, Beyens et al. (2024) emphasize that individual susceptibility plays a crucial moderating role in the psychological outcomes of social media use, underscoring the influence of personality traits and cognitive processes in shaping user experiences.
Further, studies have shown that social media use can enhance well-being by improving the quality of online relationships (Spottswood & Wohn, 2020). The quality of online relationships has been identified as a key mediator in the positive association between social media use and well-being. Prior research suggests that social media fosters both bridging and bonding social capital. Bridging social capital involves connections with individuals outside one's immediate social circle—such as acquaintances, colleagues, or members of different communities—and provides access to diverse perspectives, information, and resources (Ahmad et al., 2023). In contrast, bonding social capital refers to strong, close-knit relationships among individuals who share a common identity or background, such as family members, close friends, or culturally similar peers. It is typically characterized by emotional support, mutual trust, shared values, and reciprocal obligations (Huang et al., 2022). While social media can facilitate both types of social capital, evidence indicates that bonding social capital more strongly contributes to relationship quality by fostering meaningful online connections that serve as valuable psychosocial resources (Phua et al., 2017).
Together, these findings reveal both positive and negative implications of social media use, with outcomes varying based on user behavior, individual differences, and cognitive patterns. This highlights the nuanced and multifaceted nature of the relationship between social media and well-being. However, much of the existing literature has focused predominantly on Facebook or aggregated multiple platforms under a single umbrella, thereby limiting the ability to discern platform-specific effects. In response, a growing number of scholars have called for a more differentiated approach that reflects the evolving nature and increasing diversification of social media platforms, in order to more accurately understand their unique and complex influence on well-being.
Relationships Between Different Social Media Use and Well-Being
Social media can be broadly categorized into open- and closed-network types. Examples of open-network platforms include X (formerly Twitter), Instagram, and LinkedIn, which allow users to interact and share content with individuals they may not personally know, facilitating communication across broader communities. These platforms primarily foster bridging social capital by expanding users’ networks beyond pre-existing relationships. Users also tend to engage with these platforms passively, often encountering self-relevant content and success stories that can encourage unhelpful social comparison (Sajuria et al., 2014). In contrast, platforms such as Snapchat, WhatsApp, and WeChat are closed-network social media, typically used for communication among individuals with pre-existing relationships. These platforms promote bonding social capital by reinforcing existing relationships through more intimate and supportive interactions (Simons et al., 2022). Users of these platforms tend to engage in active, reciprocal interactions, which are more likely to result in positive experiences. Some platforms exhibit blended characteristics. For example, Facebook is often seen as an open-network platform due to its public content sharing and group features, yet it also supports bonding through private messaging and closed groups.
Addressing limitations in past research, an increasing number of studies now compare the relationship between different social media platforms and well-being. For example, Jaidka (2022) analyzed the longitudinal relationships of open-network social media (X and Instagram) and blended social media (Facebook) with well-being using national Consumer Survey Country-Level data (2016-2018) in the United States and Google Trends API DMA-level data (2016–2018). The study found that frequent Instagram use had a consistent negative relationship with well-being, while frequent use of X had either a negative or no relationship with well-being. In contrast, frequent Facebook use had consistent positive relationship with well-being. Similarly, Delle et al. (2023) conducted a cross-sectional study with 211 adults aged 18-46 in the United States, examining the relationship between the use of open-network social media (X and Instagram) and blended social media (Facebook) with romantic stress and relationship well-being. The study found that Instagram and X use were negatively associated with well-being with higher romantic stress, while Facebook use had no such effect. The negative relationship between X and Instagram use and well-being may be partly attributed to its emphasis on photo- and video-based content, which can promote social comparison and poor body image (Lup et al., 2015).
These findings highlight that different social media platforms can foster bonding social capital to varying degrees. In particular, the use of closed-network platforms (e.g., Snapchat) and blended platforms (e.g., Facebook)—which are more strongly associated with the development of bonding social capital—may be more effective in promoting well-being than open-network platforms (e.g., X and Instagram), which are primarily linked to bridging social capital. However, a significant research gap remains, as no prior studies have directly examined how different patterns of social media use relate to the quality of online relationships and, in turn, how this relationship impacts individual well-being. Additionally, cultural differences in social media use may further complicate the association between social media engagement and well-being.
Cultural Differences in Social Media Use and Well-Being
Notable cultural differences exist in social media use between Western and non-Western contexts, particularly in platform preferences. In Japan, Western-developed open-network platforms such as X and Instagram, along with the blended platform Facebook, are widely used (Social Media Lab, 2024). However, the Korean-developed closed-network platform LINE—rarely used in Western contexts—is the most popular closed-network platform in Japan. In contrast, Western alternatives such as WhatsApp and Snapchat are used far less frequently. Like WhatsApp and Snapchat, LINE is a closed-network platform oriented around bonding social capital, enabling users to send messages, photos, and videos, and to create and share stories within a close circle of family, friends, and acquaintances. Although LINE does not offer self-destructing messages or posts, it shares key features with Snapchat, including private messaging, stickers, and group chats. Recent data show that X has over 67 million monthly active users in Japan (approximately 46% of the population), while LINE is used by more than 97 million people—around 93% of the population (Social Media Lab, 2024). Moreover, users in non-Western contexts generally prioritize anonymity and favor visual, group-oriented content, whereas users in Western contexts tend to use social media for personal expression, openly presenting their identities (Suzuki & Takemura, 2013; Tateno et al., 2019).
There are some studies that investigated the relationship between different social media use and well-being. For instance, Sakurai et al. (2021) conducted a cross-sectional study involving 8,576 Japanese adults and found that frequent checking of LINE and frequent posting on Facebook were positively associated with well-being among young adults, whereas frequent posting on X was negatively associated with well-being and linked to increased psychological distress. These findings are broadly consistent with patterns observed in Western contexts, where the use of closed-network platforms (e.g., Snapchat) and blended platforms (e.g., Facebook)—which foster bonding social capital—is generally associated with greater well-being than open-network platforms (e.g., X and Instagram), which are more closely linked to bridging social capital. However, research examining the relationship between specific social media platforms and well-being remains relatively limited in non-Western contexts, particularly longitudinal studies that explore how these relationships evolve over time.
Present Study
Key gaps in the existing research include the lack of studies examining how the use of different social media platforms is related to the quality of online relationships, and how this, in turn, affects well-being. Additionally, there is a scarcity of longitudinal research investigating the relationship between social media use and well-being in non-Western contexts.
To address these gaps, the present study aimed to explore the relationships between the use of two types of social media platforms and well-being among Japanese adults. Specifically, it examined the use of X—an open-network social media platform popular in Japan—and LINE—a widely used closed-network platform—in relation to well-being. This study examined how different types of social media use relate to life satisfaction. Life satisfaction—an individual’s overall evaluation of their quality of life and contentment with their existence—serves as a critical indicator of well-being (Kim et al., 2021). Unlike happiness, which is often a fleeting and momentary emotion, life satisfaction represents a more enduring, holistic sense of contentment, making it a more stable and reliable measure of overall well-being (Diener, 2000).
To analyze the complex and dynamic interplay between social media use, online relationships, and life satisfaction, this study investigated both (1) the direct relationship between X and LINE use and life satisfaction, and (2) the indirect relationship between X and LINE use and life satisfaction, mediated by the quality of online relationships. Understanding this dynamic requires considering how these factors evolve over time. While cross-sectional studies provide valuable insights, they are limited in their ability to capture the complex, temporal changes in these relationships (Wang & Cheng, 2020). Therefore, this study employed both cross-sectional and longitudinal analyses to offer a more comprehensive understanding of the momentary and developmental interconnections between social media use, online relationships, and life satisfaction.
For the purpose of study, the present study explored answers to four research questions:
Q1: What are the direct cross-sectional relationships of X and LINE use with life satisfaction?
Q2: What are the direct longitudinal relationships of X and LINE use with life satisfaction?
Q3: What are the indirect cross-sectional relationships of X and LINE use with life satisfaction mediated by the quality of online relationship?
Q4: What are the indirect longitudinal relationships of X and LINE use with life satisfaction mediated by the quality of online relationship?
Methods
Overview
The present study employed quantitative research methods to explore both cross-sectional and longitudinal relationships of two forms of social media use with the quality of online relationships and life satisfaction. It analysed online survey data collected from an adult cohort over a four-year period, spanning from 2021 to 2024.
Participants
The study sample consisted of 1,674 Japanese adults (886 men and 788 women) who participated in annual online surveys from 2021 to 2024. In 2021, participants were aged 18 to 61, and by 2024, their ages ranged from 21 to 64. The sample was drawn from 10 prefectures in Kanto and Kinki region in Japan, including Tokyo, Kanagawa, Saitama, Chiba, Osaka, Kyoto, Hyogo, Shiga, Nara, and Wakayama, reflecting a typical adult population in Japan. Demographic details of the participants are provided in Table 1.
Procedure
This study utilized open-source online survey data collected by My Voice Corporation (https://www.myvoice.co.jp/), a market research company, on behalf of the Yoshida Hideo Memorial Foundation (https://www.yhmf.jp/en/) between 2021 and 2024. The Foundation made the raw data publicly accessible to support research in communication and marketing. The surveys were conducted twice a year, targeting approximately 5,000 registered adult respondents (ages 18–64). To ensure cohort consistency, participants were re-recruited annually starting in 2021, with new respondents added as needed to maintain the target of 5,000 participants. The surveys collected information on demographics, lifestyle, consumption habits, internet and media use, and psychological well-being. They were conducted each year in April and between October and December. This study specifically analyzed data from the April surveys conducted between 2022 and 2024, focusing on question items relevant to its research objectives. A longitudinal subsample of 1,674 participants (32.1% of the initial 5,208 respondents in April 2021) participated consistently in the annual April surveys through 2024.
Measures
Overview
The online survey gathered participants' demographic details, such as gender, age, geographic location, marital status, and employment status. It also evaluated two types of social media use (X and LINE), as well as the quality of online relationships and life satisfaction.
Life Satisfaction
The Satisfaction with Life Scale (SWLS; Diener et al., 1985) is a widely used five-item self-report tool designed to assess an individual's overall cognitive judgment of life satisfaction. Suitable for individuals aged 10 and older, the scale uses a seven-point Likert scale (1 = strongly disagree, 7 = strongly agree) for each item. The SWLS provides a global assessment of life satisfaction without focusing on specific domains such as health or finances, allowing respondents to incorporate and weigh these areas in their responses as they deem appropriate. Scores range from 7 to 35, with higher scores indicating greater life satisfaction. The Japanese version of the SWLS, translated by Sumino (1994), demonstrated good internal reliability (α = .84) and convergent validity, showing significant correlations between SWLS score and happiness measure (r = .62) among Japanese adults.
Quality of Online Relationship
The online survey included an original item designed to assess the quality of respondents' online relationships, specifically asking, “How would you rate the quality of your current online relationships with others?” Responses were measured using a six-point Likert scale (1 = no full-filling online relationship; 6 = I have a full-filling online relationship).
Table 1. Sample Demographics.
|
|
2021 |
2022 |
2023 |
2024 |
||||
|
|
n |
% |
n |
% |
n |
% |
n |
% |
|
Gender |
|
|
|
|
|
|
|
|
|
Male |
886 |
52.9 |
886 |
52.9 |
886 |
52.9 |
886 |
52.9 |
|
Female |
788 |
47.1 |
788 |
47.1 |
788 |
47.1 |
788 |
47.1 |
|
Age |
|
|
|
|
|
|
|
|
|
18–29 |
110 |
6.6 |
86 |
5.1 |
74 |
4.4 |
61 |
3.6 |
|
30–39 |
358 |
21.4 |
325 |
19.4 |
281 |
16.8 |
257 |
15.4 |
|
40–49 |
580 |
34.6 |
542 |
32.4 |
535 |
32.0 |
488 |
29.2 |
|
50–59 |
532 |
31.8 |
573 |
34.2 |
584 |
34.9 |
614 |
36.7 |
|
60–64 |
94 |
5.6 |
148 |
8.8 |
200 |
11.9 |
254 |
15.2 |
|
Geographic location |
|
|
|
|
|
|
|
|
|
Tokyo |
450 |
26.9 |
449 |
26.8 |
450 |
26.9 |
449 |
26.8 |
|
Kanagawa |
269 |
16.1 |
272 |
16.2 |
272 |
16.2 |
275 |
16.4 |
|
Osaka |
266 |
15.9 |
267 |
15.9 |
263 |
15.7 |
266 |
15.9 |
|
Saitama |
209 |
12.5 |
209 |
12.5 |
211 |
12.6 |
211 |
12.6 |
|
Chiba |
178 |
10.6 |
178 |
10.6 |
178 |
10.6 |
178 |
10.6 |
|
Hyogo |
153 |
9.1 |
149 |
8.9 |
149 |
8.9 |
147 |
8.8 |
|
Kyoto |
70 |
4.2 |
71 |
4.2 |
71 |
4.2 |
70 |
4.2 |
|
Nara |
40 |
2.4 |
42 |
2.5 |
42 |
2.5 |
41 |
2.4 |
|
Wakayama |
23 |
1.4 |
23 |
1.4 |
23 |
1.4 |
23 |
1.4 |
|
Shiga |
16 |
1.0 |
14 |
0.8 |
14 |
0.8 |
14 |
0.8 |
|
Marriage status |
|
|
|
|
|
|
|
|
|
Married |
914 |
54.6 |
919 |
54.9 |
921 |
55.0 |
926 |
55.3 |
|
Not married |
760 |
45.4 |
755 |
45.1 |
753 |
45.0 |
748 |
44.7 |
|
Employment status |
|
|
|
|
|
|
|
|
|
Employed/students |
1,544 |
92.2 |
1,539 |
91.9 |
1,542 |
92.1 |
1,536 |
91.8 |
|
Unemployed |
130 |
7.8 |
135 |
8.1 |
132 |
7.9 |
138 |
8.2 |
|
Personal income |
|
|
|
|
|
|
|
|
|
No income |
142 |
8.5 |
148 |
8.8 |
140 |
8.4 |
140 |
8.4 |
|
< JPY1,200,000 |
418 |
25.0 |
408 |
24.4 |
411 |
24.6 |
407 |
24.3 |
|
JPY1,200,000– JPY2,400,000 |
163 |
9.7 |
174 |
10.4 |
166 |
9.9 |
169 |
10.1 |
|
JPY2,400,000-JPY3,600,000 |
217 |
13.0 |
201 |
12.0 |
211 |
12.6 |
196 |
11.7 |
|
JPY3,600,000-JPY4,800,000 |
186 |
11.1 |
191 |
11.4 |
185 |
11.1 |
186 |
11.1 |
|
JPY4,800,000- JPY6,000,000 |
175 |
10.5 |
178 |
10.6 |
172 |
10.3 |
173 |
10.3 |
|
JPY6,000,000-JPY7,200,000 |
105 |
6.3 |
101 |
6.0 |
114 |
6.8 |
107 |
6.4 |
|
JPY7,200,000-JPY8,400,000 |
82 |
4.9 |
80 |
4.8 |
84 |
5.0 |
91 |
5.4 |
|
JPY8,400,000-JPY12,000,000 |
107 |
6.4 |
114 |
6.8 |
111 |
6.6 |
110 |
6.6 |
|
JPY12,000,000< |
38 |
2.3 |
42 |
2.5 |
37 |
2.2 |
46 |
2.7 |
|
Not response |
41 |
2.4 |
37 |
2.2 |
43 |
2.6 |
49 |
2.9 |
|
Note. Age, geographic location, marital status, and employment status are based on data from 2021. |
||||||||
X and LINE Use
The online survey included two original items designed to assess the amount of time respondents spend on X (formerly Twitter) and LINE per day. Responses were measured using an eight-point Likert scale, where 1 = 0 hours, 2 = 0–0.5 hours, 3 = 0.5–1 hour, 4 = 1–1.5 hours, 5 = 1.5–2 hours, 6 = 2–3 hours, 7 = 3–4 hours, and 8 = over 4 hours.
Data Analysis
Preliminary analysis involved computing descriptive statistics for X and LINE use, online relationship, and life satisfaction across each year from 2021 to 2024. Additionally, Pearson's correlation coefficients were calculated to examine the cross-sectional and longitudinal relationships between X and LINE use, online relationship, and life satisfaction over the four-year period (2021–2024), providing an initial snapshot of these relationships without controlling for other variables. Univariate growth models with intercept (2021 baseline) and slope (growth trajectory between 2021 and 2024) were calculated for X and LINE use, online relationship, life satisfaction and a range of control variables, including geographic location (Kanto or Kinki region), marital status (married or not married), employment status (employed/student or unemployed), and income status.
The primary analysis employed a parallel process latent growth curve modeling (LGCM; Duncan et al., 1998) to investigate the relationships between the intercepts (2021 baseline) and slopes (growth trajectories from 2021 to 2024) of X and LINE use, online relationship, and life satisfaction. Parallel process LGCM, a structural equation modeling technique, was selected for its ability to estimate growth trajectories of multiple variables simultaneously, providing a comprehensive view of their co-development over time (Cheong et al., 2003). It enables the examination of whether initial levels or rates of change in one construct predict those in another, capturing dynamic, time-dependent associations. Compared to separate univariate models, it accounts for measurement errors and inter-variable dependencies, resulting in more precise estimates. Unlike autoregressive cross-lagged models, which assess directional effects at discrete time points, parallel process LGCM captures intraindividual change and synchronized development, offering deeper insight into longitudinal processes (Tu et al., 2023).
The slopes for X and LINE use, quality of online relationship, and life satisfaction were modeled to capture linear growth trajectories from 2021 to 2024, with time point weights assigned as follows: T1 (2021) = 0, T2 (2022) = 1, T3 (2023) = 2, T4 (2024) = 3. Figure 1 illustrates the tested model. In the model, X and LINE use intercepts and slopes loaded onto online relationship and life satisfaction intercepts and slopes. Additionally, online relationship intercepts and slopes loaded onto life satisfaction intercepts and slopes. This design enabled examination of direct relationships between X and LINE use, online relationship, and life satisfaction, as well as mediational analysis of the indirect relationship between two types of SMU and life satisfactsion via online relationship. These indirect pathways were tested by constructing variables representing the mediational effects and evaluating their statistical significance using Mplus Version 8.11 (Muthén & Muthén, 1998).
The analysis included control variables to enhance the accuracy of assessing both the cross-sectional and longitudinal relationships between X and LINE use, quality of online relationship, and life satisfaction. The intercepts (2021 baseline) for gender was included as control variables, as it remained constant between 2021 and 2024. Similarly, the intercept (2021 baseline) for age was treated as a control variable, since changes in age between 2021 and 2024 were consistent across all participants, and the model failed to converge when the slope of age was entered. The intercepts (2021 baseline) and slopes (growth trajectories from 2021 to 2024) for marital status, geographical location, employment status, and personal income were also included as control variables.
To evaluate model fit, this study calculated and reported multiple indices, including the Satorra-Bentler scaled statistic (S–B χ2), comparative fit index (CFI), Tucker-Lewis index (TLI), root mean square error of approximation (RMSEA), and standardized root mean square residual (SRMR). Although a non-significant S–B χ2 (p < .05) suggests reasonable fit, this test is sensitive to sample size and not considered a reliable indicator (Alavi et al., 2020). Following established practices (MacCallum et al., 1996), CFI, TLI, RMSEA, and SRMR served as primary fit indices. Reasonable model fit was indicated by CFI and TLI values ≥ .90, RMSEA values < .06, and SRMR values < .08. All analyses were performed using SPSS 30 (IBM Corp, 2021) and Mplus Version 8.11 (Muthén & Muthén, 1998).
Figure 1. Tested Model.
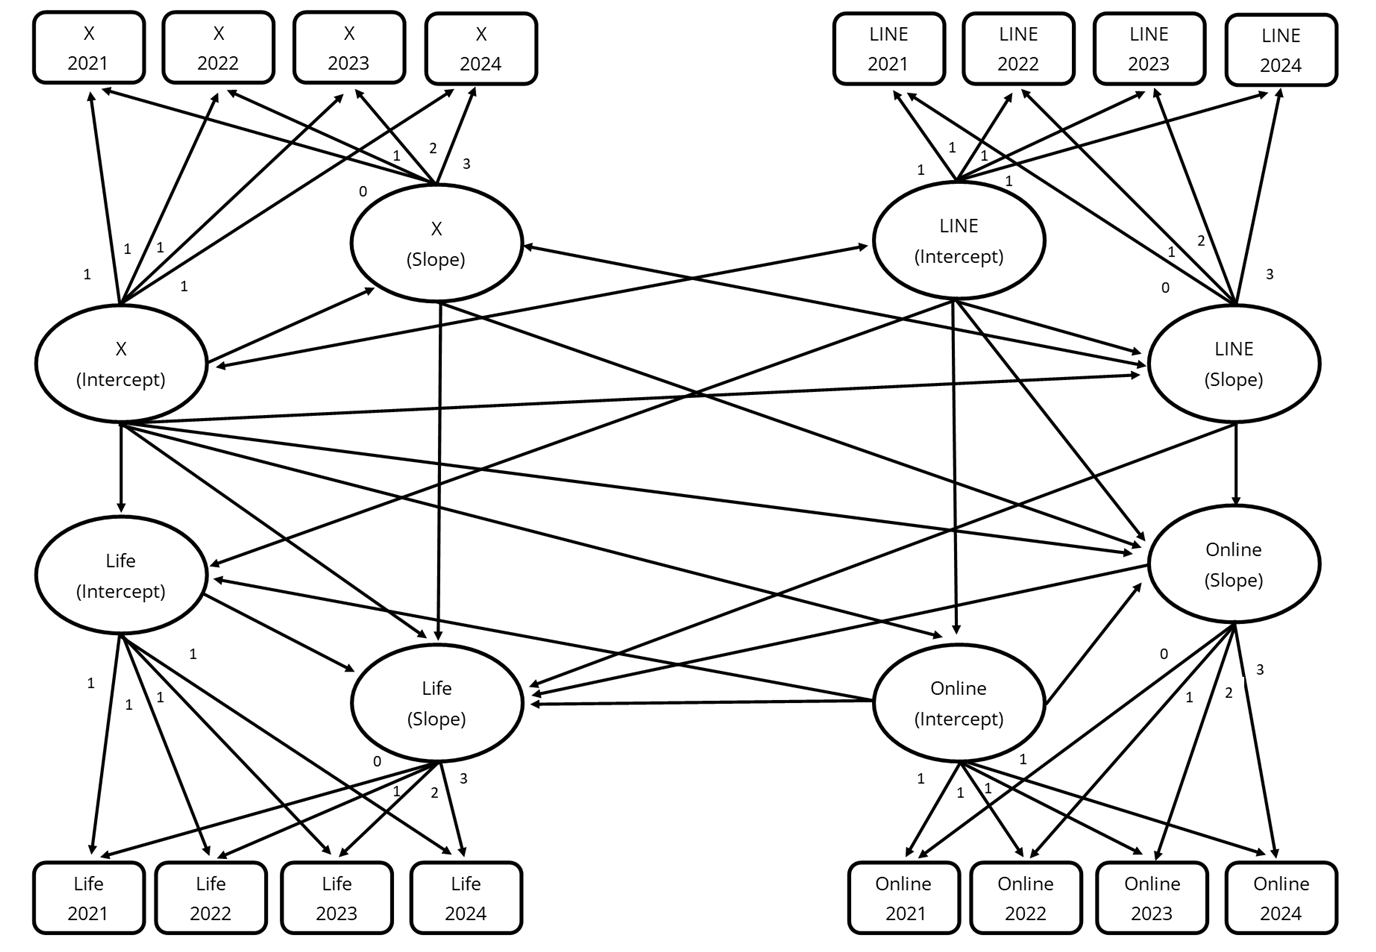
Note. Life = Life satisfaction. Online = Online relationship.
Results
Preliminary Analyses
Table 2 presents the descriptive statistics for the study variables. The study achieved a 100% response rate (n = 1,674) between 2021 and 2024, with no missing data, as respondents were required to complete all survey items. The first author conducted data screening, visually inspecting the data for errors. No data corruption was identified, and thus, no cleaning or correction was necessary. The measures demonstrated good internal reliability, with Cronbach's alpha values ranging from α = .92 to .93. Except for X, LINE, and employment status, the distribution of the study variables showed acceptable skewness (−1.12 to 1.01) and kurtosis (−1.29 to 0.47) values, ranging between −2 and +2, indicating minimal skewness and excess kurtosis (Hair et al., 2022). X, LINE, and employment status exhibited non-normal distributions. The non-normality of X and LINE use is attributable to the high proportion of participants (approximately 80–90% between 2021 and 2024) reporting daily use of these platforms for 30 minutes or less. Similarly, employment status was skewed, with approximately 92% of participants identified as either employed or students, and only a small proportion reporting unemployment. Although these distributions deviate from normality, they reflect typical patterns of social media use and employment within the sample. However, the limited response variability—particularly for X and LINE use—necessitates cautious interpretation of their associations with online relationships, life satisfaction, and the broader implications of these findings.
Table 3 presents the Pearson correlations among the study variables. Notably, LINE use between 2021 and 2024 showed significant positive correlations with both the quality of online relationships and life satisfaction during the same period. In contrast, X use was significantly positively correlated with the quality of online relationships but showed no significant association with life satisfaction between 2021 and 2024.
Table 4 also presents the results of univariate growth models. Key findings indicate a significant decline in the quality of online relationships from 2021 to 2024 (β = −0.07, p < .001), while life satisfaction remained stable over the same period (β = 0.01, p = .417). A significant increase was observed in X use (β = 0.04, p < .001) and LINE use (β = 0.10, p = .010). Significant intercept and slope variances for all study variables suggest substantial individual differences in baseline levels (2021) and in growth trajectories between 2021 and 2024.
Table 2. Descriptive Results for Study Variables.
|
Variables |
Year |
M |
SD |
Range |
Skewness |
Kurtosis |
α |
|
Life satisfaction |
2024 |
13.57 |
4.70 |
5–25 |
−0.19 |
−0.50 |
.93 |
|
|
2023 |
13.71 |
4.54 |
5–25 |
−0.21 |
−0.41 |
.92 |
|
|
2022 |
13.77 |
4.71 |
5–25 |
−0.17 |
−0.52 |
.92 |
|
|
2021 |
13.61 |
4.60 |
5–25 |
−0.23 |
−0.49 |
.92 |
|
Online relationship |
2024 |
2.31 |
1.53 |
1–6 |
0.52 |
−1.34 |
|
|
|
2023 |
2.44 |
1.53 |
1–6 |
0.38 |
−1.39 |
|
|
|
2022 |
2.54 |
1.53 |
1–6 |
0.23 |
−1.49 |
|
|
|
2021 |
2.50 |
1.52 |
1–6 |
0.25 |
−1.52 |
|
|
X |
2024 |
1.71 |
1.12 |
1–8 |
2.48 |
7.62 |
|
|
|
2023 |
1.64 |
1.06 |
1–8 |
2.74 |
9.97 |
|
|
|
2022 |
1.61 |
1.01 |
1–8 |
2.64 |
9.44 |
|
|
|
2021 |
1.58 |
0.99 |
1–8 |
2.69 |
9.77 |
|
|
LINE |
2024 |
1.88 |
0.83 |
1–8 |
2.40 |
11.06 |
|
|
|
2023 |
1.85 |
0.84 |
1–8 |
2.66 |
14.15 |
|
|
|
2022 |
1.88 |
0.86 |
1–8 |
2.26 |
10.19 |
|
|
|
2021 |
1.84 |
0.89 |
1–8 |
2.27 |
9.51 |
|
|
Age |
2024 |
48.6 |
9.62 |
21–64 |
−0.41 |
−0.53 |
|
|
|
2023 |
47.6 |
9.62 |
20–63 |
−0.41 |
−0.53 |
|
|
|
2022 |
46.6 |
9.62 |
19–62 |
−0.41 |
−0.53 |
|
|
|
2021 |
45.6 |
9.64 |
18–61 |
−0.41 |
−0.54 |
|
|
Gender (female) |
2021–2024 |
1.47 |
0.50 |
1–2 |
0.12 |
0.06 |
|
|
Geographical location (Kanto) |
2024 |
0.66 |
0.47 |
0–1 |
−0.70 |
−1.96 |
|
|
|
2023 |
0.66 |
0.47 |
0–1 |
−0.70 |
−1.51 |
|
|
|
2022 |
0.66 |
0.47 |
0–1 |
−0.69 |
−1.52 |
|
|
|
2021 |
0.66 |
0.47 |
0–1 |
−0.68 |
−1.53 |
|
|
Marital status |
2024 |
1.55 |
0.50 |
1–2 |
−0.21 |
−1.96 |
|
|
|
2023 |
1.55 |
0.50 |
1–2 |
−0.20 |
−1.96 |
|
|
|
2022 |
1.55 |
0.50 |
1–2 |
−0.20 |
−1.96 |
|
|
|
2021 |
1.55 |
0.50 |
1–2 |
−0.19 |
−1.97 |
|
|
Employment status |
2024 |
0.92 |
0.28 |
0–1 |
−3.04 |
7.25 |
|
|
|
2023 |
0.92 |
0.27 |
0–1 |
−3.13 |
7.79 |
|
|
|
2022 |
0.92 |
0.27 |
0–1 |
−3.08 |
7.51 |
|
|
|
2021 |
0.92 |
0.27 |
0–1 |
−3.16 |
7.99 |
|
|
Personal income |
2024 |
3.39 |
2.54 |
0–9 |
0.53 |
−0.81 |
|
|
|
2023 |
3.35 |
2.50 |
0–9 |
0.54 |
−0.78 |
|
|
|
2022 |
3.34 |
2.52 |
0–9 |
0.56 |
−0.75 |
|
|
|
2021 |
3.32 |
2.49 |
0–9 |
0.56 |
−0.73 |
|
The LGCM demonstrated acceptable fit; χ2 (346) = 1227.71, p < .001, CFI = .98, TLI = .98, RMSEA = .04, SRMR = .02; see Figure 1. Given the sensitivity of the χ2 likelihood ratio test to sample size, fit indices CFI, TLI, RMSEA, and SRMR served as primary indicators of model fit. The obtained values (CFI and TLI ≥ .900, RMSEA < .08, and SRMR < .08) suggested good model fit (MacCallum et al., 1996). The relationships between the control variables (gender and age) and the study variables (media use, cosmopolitanism, and life satisfaction) are presented in Appendix.
Table 3. Correlations Between X and LINE Use, Online Relationship, Life Satisfaction and Control Variables.

Note. *p < .05. ** p < .01. LS21 = Life satisfaction 2021. LS22 = Life satisfaction 2022. LS23 = Life satisfaction 2023. LS24 = Life satisfaction 2024.
OR21 = Online relationship 2021. OR22 = Online relationship 2022. OR23 = Online relationship 2023. OR24 = Online relationship 2024. X21 = X 2021.
X22 = X 2022. X23 = X 2023. X24 = X 2024. LI21 = LINE 2021. LI22 = LINE 2022. LI23 = LINE 2023. LI24 = LINE 2024. AG19 = Age 2019. AG21 = Age 2021. AG22 = Age 2022. AG23 = Age 2023. AG24 = Age 2024. GE = Gender. LO21 = Location 2021. LO22 = Location 2022. LO23 = Location 2023.
LO24 = Location 2024. MA21 = Marriage status 2021. MA22 = Marriage status 2022. MA23 = Marriage status 2023. MA24 = Marriage status 2024.
EM21 = Employment status 2021. EM22 = Employment status 2022. EM23 = Employment status 2023. EM24 = Employment status 2024. IN21 = Income 2021. IN22 = Income 2022. IN23 = Income 2023. IN24 = Income 2024.
Direct Relationship of X and LINE Use With Life Satisfaction
Table 6 and Figure 1 present the relationships between media use, quality of online relationships, and life satisfaction, after controlling for gender and age. In addressing Research Question 1 (What are the direct cross-sectional relationships of X and LINE use with life satisfaction?), the intercept for X showed a negative relationship with the intercept of life satisfaction (β = −0.09, p = .001), while the intercept for LINE showed a positive relationship with the intercept of life satisfaction (β = 0.08, p = .001). These findings suggest that individuals with more extensive use of X tend to report lower life satisfaction, whereas individuals with longer use of LINE tend to report higher life satisfaction.
Table 4. Overall Model Fit, Growth Trajectory (Slope) and Intercept for Univariate Growth Models.
|
|
|
|
|
|
Overall Model Fit |
||||
|
Variable |
Intercept p |
Slope p |
Intercept Variance p |
Slope Variance p |
χ2(df) p |
CFI |
TLI |
RMSEA |
SRMR |
|
Life satisfaction |
13.70 < .001 |
−.02 .417 |
17.23 < .001 |
.25 < .001 |
54.99 (5) < .001 |
.991 |
.989 |
.08 |
.05 |
|
Online relationship |
2.55 < .001 |
−.07 < .001 |
1.30 < .001 |
.04 .001 |
16.56 (5) .005 |
.996 |
.995 |
.04 |
.01 |
|
X |
1.57 < .001 |
.04 < .001 |
0.77 < .001 |
.04 < .001 |
6.74 (5) .241 |
1.000 |
.999 |
.01 |
.01 |
|
LINE |
1.85 < .001 |
.10 < .001 |
0.52 .241 |
.01 .001 |
18.59 (5) .002 |
.995 |
.994 |
.04 |
.03 |
|
Marital status |
3.30 < .001 |
.05 .104 |
1.55 < .001 |
.00 < .001 |
91.26 (5) < .001 |
.994 |
.993 |
.10 |
.01 |
|
Location (Kanto) |
1.40 < .001 |
.05 .031 |
0.22 < .001 |
.00 < .001 |
214.99 (5) < .001 |
.991 |
.990 |
.02 |
.00 |
|
Employment status |
3.60 < .001 |
−.04 .344 |
0.07 < .001 |
.00 < .001 |
14.47 (5) .013 |
.999 |
.999 |
.03 |
.03 |
|
Personal income |
1.35 < .001 |
.15 < .001 |
5.99 < .001 |
.05 < .001 |
7.58 (5) .181 |
1.000 |
1.000 |
.02 |
.01 |
In addressing Research Question 2 (What are the direct longitudinal relationships of X and LINE use with life satisfaction?), the slope for X showed no significant relationship with the slope of life satisfaction (β = 0.06, p = .351), indicating that changes in X use between 2021 and 2024 had no effect on changes in life satisfaction over the same period. However, the intercept for X was negatively related to the slope of life satisfaction (β = −0.14, p = .011), suggesting that individuals who used X more extensively in 2021 experienced a decline in life satisfaction between 2021 and 2024. In contrast, neither the slope nor the intercept for LINE showed any significant relationship with the slope of life satisfaction (β = −0.04, p = .381; β = −0.02, p = .473), indicating that neither the amount of LINE use in 2021 nor changes in LINE use had any impact on changes in life satisfaction between 2021 and 2024.
Table 5. Relationships of X and LINE Use With Online Relationship and Life Satisfaction.
|
|
β |
SE |
p |
95% CIP |
||||
|
Life satisfaction |
Intercept |
← |
Online relationship |
Intercept |
0.33 |
0.03 |
< .001 |
[0.27, 0.39] |
|
Life satisfaction |
Intercept |
← |
X |
Intercept |
−0.17 |
0.03 |
< .001 |
[−0.24, −0.11] |
|
Life satisfaction |
Intercept |
← |
LINE |
Intercept |
0.15 |
0.03 |
< .001 |
[0.09, 0.21] |
|
Life satisfaction |
Slope |
← |
Life satisfaction |
Intercept |
−0.13 |
0.07 |
.025 |
[−0.26, 0.00] |
|
Life satisfaction |
Slope |
← |
Online relationship |
Intercept |
−0.07 |
0.08 |
.185 |
[−0.22, 0.08] |
|
Life satisfaction |
Slope |
← |
X |
Intercept |
−0.16 |
0.07 |
.011 |
[−0.30, −0.02] |
|
Life satisfaction |
Slope |
← |
LINE |
Intercept |
−0.02 |
0.08 |
.473 |
[−0.18, 0.15] |
|
Life satisfaction |
Slope |
← |
Online relationship |
Slope |
0.24 |
0.12 |
.021 |
[0.01, 0.48] |
|
Life satisfaction |
Slope |
← |
X |
Slope |
−0.06 |
0.15 |
.351 |
[−0.35, 0.24] |
|
Life satisfaction |
Slope |
← |
LINE |
Slope |
−0.04 |
0.13 |
.381 |
[−0.29, 0.21] |
|
Online relationship |
Intercept |
← |
X |
Intercept |
0.29 |
0.03 |
< .001 |
[0.23, 0.36] |
|
Online relationship |
Intercept |
← |
LINE |
Intercept |
0.20 |
0.03 |
< .001 |
[0.13, 0.27] |
|
Online relationship |
Slope |
← |
Online relationship |
Intercept |
−0.18 |
0.09 |
.020 |
[−0.35, −0.01] |
|
Online relationship |
Slope |
← |
X |
Intercept |
0.12 |
0.07 |
.051 |
[−0.02, 0.26] |
|
Online relationship |
Slope |
← |
LINE |
Intercept |
0.04 |
0.09 |
.304 |
[−0.12, 0.21] |
|
Online relationship |
Slope |
← |
X |
Slope |
0.38 |
0.17 |
.013 |
[0.05, 0.70] |
|
Online relationship |
Slope |
← |
LINE |
Slope |
−0.13 |
0.15 |
.190 |
[−0.43, 0.16] |
|
X |
Slope |
← |
X |
Intercept |
−0.16 |
0.05 |
.001 |
[−0.27, −0.06] |
|
X |
Slope |
← |
LINE |
Intercept |
−0.14 |
0.05 |
.003 |
[−0.24, −0.04] |
|
LINE |
Slope |
← |
X |
Intercept |
−0.47 |
0.13 |
< .001 |
[−0.72, −0.22] |
|
LINE |
Slope |
← |
LINE |
Intercept |
−0.27 |
0.07 |
< .001 |
[−0.43, −0.11] |
|
X |
Slope |
↔ |
LINE |
Slope |
1.63 |
0.41 |
< .001 |
[0.83, 2.44] |
|
X |
Intercept |
↔ |
LINE |
Intercept |
0.40 |
0.03 |
< .001 |
[0.34, 0.45] |
Indirect relationship of X and LINE use with life satisfaction mediated by online relationship
Table 6 presents the indirect relationship between X and LINE use and life satisfaction, mediated by the quality of online relationships. In addressing Research Question 3 (What are the indirect cross-sectional relationships of X and LINE use with life satisfaction mediated by the quality of online relationships?), the intercept for X showed a positive relationship with the intercept of life satisfaction, mediated by the intercept of online relationships (β = 0.10, p < .001). This result, which contrasts with the direct relationship, suggests that individuals with longer use of X had higher life satisfaction, mediated by better online relationships in 2021. Similarly, the intercept for LINE also showed a positive relationship with the intercept of life satisfaction, mediated by the intercept of online relationships (β = 0.07, p < .001). This finding aligns with the direct relationship, indicating that individuals with longer use of LINE had higher life satisfaction, mediated by better online relationships in 2021.
In addressing Research Question 4 (What are the indirect longitudinal relationships of X and LINE use with life satisfaction mediated by the quality of online relationships?), the slope for X showed a trend toward a significant positive indirect relationship with the slope of life satisfaction, mediated by the slope of online relationships (β = 0.09, p = .071). This suggests that individuals who experienced an increase in X use also showed growth in life satisfaction, mediated by improvements in online relationships between 2021 and 2024. In contrast, the slope for LINE showed no significant indirect relationship with the slope of life satisfaction, mediated by the slope of online relationships (β = −0.03, p = .203), indicating that changes in LINE use did not predict changes in life satisfaction through changes in the quality of online relationships.
Table 6. Indirect Relationships of X and LINE Use With Life Satisfaction via Online Relationship.
|
|
β |
SE |
p |
95% CI |
|||||||
|
Life satisfaction |
Intercept |
← |
Online relationship |
Intercept |
← |
X |
Intercept |
0.10 |
0.02 |
< .001 |
[0.07, 0.25] |
|
Life satisfaction |
Intercept |
← |
Online relationship |
Intercept |
← |
LINE |
Intercept |
0.07 |
0.01 |
< .001 |
[0.04, 0.10] |
|
Life satisfaction |
Slope |
← |
Online relationship |
Intercept |
← |
X |
Intercept |
−0.02 |
0.02 |
.182 |
[−0.06, 0.02] |
|
Life satisfaction |
Slope |
← |
Online relationship |
Intercept |
← |
LINE |
Intercept |
−0.01 |
0.01 |
.184 |
[−0.04, 0.01] |
|
Life satisfaction |
Slope |
← |
Online relationship |
Slope |
← |
X |
Intercept |
0.03 |
0.02 |
.099 |
[−0.02, 0.07] |
|
Life satisfaction |
Slope |
← |
Online relationship |
Slope |
← |
LINE |
Intercept |
0.01 |
0.02 |
.307 |
[−0.03, 0.05] |
|
Life satisfaction |
Slope |
← |
Online relationship |
Slope |
← |
X |
Slope |
0.09 |
0.06 |
.071 |
[−0.03, 0.21] |
|
Life satisfaction |
Slope |
← |
Online relationship |
Slope |
← |
LINE |
Slope |
−0.03 |
0.04 |
.203 |
[−0.10, 0.04] |
Discussion
Addressing Research Questions 1 and 2, this study offers novel insights into the cross-sectional and longitudinal relationships between different types of social media use—specifically X (formerly Twitter) and LINE—and life satisfaction in a non-Western context. In terms of direct associations with life satisfaction, X and LINE demonstrated opposing patterns: X use was negatively associated with life satisfaction both cross-sectionally and longitudinally, whereas LINE use showed a positive cross-sectional association but no significant longitudinal relationship. In response to Research Questions 3 and 4, the study further contributes to understanding the similarities and differences in how X and LINE use relate to life satisfaction, as mediated by the quality of online relationships. Cross-sectionally, both platforms showed positive indirect associations with life satisfaction via improvements in online relationship quality. However, longitudinal findings revealed a divergence: while there was a trend suggesting that increased X use may be linked to greater life satisfaction through enhanced online relationships, this indirect pathway was not statistically significant, and no comparable longitudinal mediation was found for LINE use.
Direct Relationships of X and LINE Use With Life Satisfaction
The findings generally align with a prior cross-sectional study conducted by Sakurai et al. (2021) with Japanese adults that found that frequent X use is related to negative well-being while frequent LINE use is related to positive well-being as well as studies in Western context that also demonstrated that X use is related to negative well-being (Delle et al., 2023; Jaidka, 2022). The differing direct relationships of X and LINE with life satisfaction can be partially explained by the distinct nature of these platforms.
X is an open-network social media platform that has been identified as highly addictive, contributing to sedentary lifestyles, interfering with daily tasks, and disrupting essential life activities, thereby diminishing overall quality of life (Glowacki et al., 2021; Kross et al., 2021). Moreover, users of X often engage with the platform passively, frequently encountering self-relevant content that promotes social comparison and highlights success stories—both of which can negatively affect self-esteem and overall well-being (Sajuria et al., 2014). In contrast, LINE, similar to Snapchat, is a closed-network social media platform where users typically engage in active, reciprocal interactions, which are more likely to foster positive experiences (Verduyn et al., 2022). While people can also become addicted to LINE and cause interference in daily tasks (Tateno et al., 2019), the focus on intimate connections and the promotion of strong, online and offline supportive networks may counterbalance the negative effects commonly associated with social media use, potentially explaining the positive direct relationship between LINE use and life satisfaction.
Indirect Relationships of X and LINE Use With Life Satisfaction Mediated by the Quality of Online Relationship
The indirect positive cross-sectional relationship between LINE use and life satisfaction—mediated by the quality of online relationships—is not surprising, as it aligns with previous research highlighting the role of closed-network social media platforms in effectively promoting bonding social capital. These platforms facilitate interactions within smaller, close-knit groups of family, friends, and acquaintances, fostering deeper, more intimate relationships and enhancing overall relationship quality, which contributes to well-being (Choi, 2024; Valkenburg & Peter, 2009). In contrast, the similar indirect positive cross-sectional relationship observed between X use and life satisfaction is unexpected. As an open-network platform, X is designed to facilitate connections with a broad and diverse range of individuals, often based on shared interests. This typically results in expansive social networks characterized by bridging social capital—marked by more superficial connections—which generally offer limited enhancement to relationship quality compared to the stronger, supportive connections associated with bonding social capital (Sajuria et al., 2014).
The findings suggest a potential discrepancy between the direct and indirect cross-sectional relationships of X use with life satisfaction, with the indirect pathway mediated by the quality of online relationships. While X use may be negatively associated with life satisfaction at a direct level—potentially due to factors such as exposure to negative news, social comparison, or online hostility (Lup et al., 2015)—it may simultaneously contribute to improved well-being through enhanced online relationship quality, thereby partially buffering its negative impact. This may be because X often serves as a platform for promoting interest-based networking, allowing users to connect with diverse communities and engage in meaningful discourse beyond their immediate social circles (Bruns & Highfield, 2015).
Such interactions can promote cognitive stimulation, emotional validation, and perceived belonging, all of which are positively linked to psychological well-being (Haslam et al., 2009; Ryan & Deci, 2001). Moreover, social media-facilitated bridging social capital—commonly associated with open-network platforms like X—can provide users with informational and emotional resources that improve their perceived social support (Phua et al., 2017). These improvements in online relationship quality may, in turn, enhance life satisfaction, helping to mitigate the adverse effects typically associated with X use, such as information overload, echo chambers, or exposure to distressing content (Kross et al., 2021).
As the longitudinal findings reflect only a trend rather than statistically significant effects, they should be interpreted with caution. Nonetheless, the results also indicate a potential divergence in the indirect longitudinal relationships of X and LINE use with life satisfaction. Specifically, X use appears to be more closely associated with longitudinal improvements in the quality of online relationships, which may, in turn, have a stronger relationship with life satisfaction than LINE use. This is also an unexpected finding, as previous studies have indicated that LINE is more strongly associated with improvements in bonding social capital compared to X (Simons et al., 2022). The present study's findings may seem surprising, as one might expect the opposite outcome. However, they can be understood when considering the different purposes and uses of X and LINE. X is primarily used to build online relationships rather than off-line relationships while it can contribute more to the development of bridging social capital rather than bonding social capital. In contrast, LINE is more focused on enhancing offline relationships with family, friends, and close-knit communities, fostering bonding social capital rather than online relationships (Sakurai et al., 2021).
Furthermore, previous research has demonstrated that social media use within a wider social network is more strongly linked to positive well-being than use within a narrower network (Grieve et al., 2013; Lin et al., 2022). Therefore, the broader, more diverse network fostered by extended use of X may contribute to stronger, more fulfilling online relationships compared to the more limited network formed through LINE. X’s ability to create a large online social network provides more opportunities for relationship-building that can enhance life satisfaction. In contrast, LINE’s focus on fostering intimate, offline connections may not yield the same widespread, long-term impact on well-being. However, these potential explanations warrant further investigation. Future studies should explore how X and LINE use contribute to the enhancement of online and offline bridging and bonding social capital and how these dynamics influence individuals' well-being, as this study did not specifically address these aspects.
Implications of the Findings
The findings underscore the importance of recognizing the growing diversification of social media platforms and their distinct relationships with well-being—a consideration highly relevant to researchers, practitioners, and the broader public in both Western and non-Western contexts. Unlike open-network platforms such as X, closed-network platforms like LINE—where users typically engage in active, reciprocal interactions—are more likely to foster meaningful connections and contribute positively to users’ well-being. Furthermore, the conflicting direct and indirect associations between X use and well-being observed in this study highlight the complex and multifaceted effects that a single platform can have. While X use may have a direct negative impact on well-being due to addictive usage patterns and exposure to self-relevant content that encourages social comparison, it may also indirectly support well-being by enhancing the quality of online relationships through broader, interest-based engagement.
To promote both individual and societal well-being, public education and digital literacy initiatives should raise awareness of the risks associated with excessive or passive engagement on open-network platforms like X. Simultaneously, these initiatives should recognize and harness the potential benefits of such platforms when used intentionally—for example, as tools to cultivate high-quality online relationships. Maximizing these benefits while mitigating associated risks may require targeted strategies that encourage active, meaningful engagement and discourage compulsive use and uncritical exposure to content that may trigger self-comparison and reduce self-esteem.
Future research should move beyond generalized assessments of social media use and adopt more nuanced, platform-specific approaches. In particular, further investigation is needed into how other major open-network platforms (e.g., Instagram, LinkedIn, Facebook, and YouTube) and closed-network platforms (e.g., WhatsApp and Snapchat) relate to users’ well-being—both directly and indirectly through mediating factors such as the quality of online relationships. Such inquiry will be essential for developing evidence-based, context-sensitive strategies that promote healthy, meaningful, and sustainable engagement with social media.
Limitations
This analysis exclusively utilised online survey data from panels provided by a market research company. Of the 4,963 participants who responded to the initial survey in April 2021, only 1,674 (33.7%) continued their participation in the annual April surveys through 2024, with 66.3% discontinuing their participation. The participants were exclusively Japanese adults, who exhibit distinct social media usage patterns compared to adults in Western contexts, such as prioritizing anonymity and preferring visual and group-oriented content (Hsieh et al., 2025; Kitamura, 2023). Furthermore, the length of engagement with X and LINE was based on self-reported data, which may be less accurate than objectively measured data. As a result, the findings may not be directly generalisable to the broader Japanese population or to non-Japanese populations. Additionally, the present study did not examine potential moderators of the relationships between X and LINE use and life satisfaction (e.g., motivation for use, passive vs. active social media use, and personality traits). Including such moderators in future analyses could provide a more comprehensive understanding of how social media use influences life satisfaction.
In addition, the quality of online relationships was assessed using a single item based on each participant's subjective judgment. As a result, the measure may have had limited reliability. A more robust approach would have involved multiple items, such as separately evaluating the quality of bridging and bonding social capital derived from online interactions. This would have allowed for a more nuanced understanding of the relationship between different types of social media use and life satisfaction. However, the open-access archival dataset used in this study included only a single-item measure of online relationship quality
Conclusions
This study contributes to the growing body of literature on social media and well-being by providing novel insights into how distinct platforms are associated with life satisfaction in a non-Western context. The findings demonstrate that LINE—a closed-network platform that fosters bonding social capital—is consistently associated with higher life satisfaction, both directly and indirectly through the quality of online relationships. In contrast, X exhibits a more complex pattern: while it is directly associated with lower life satisfaction, this negative effect may be partially offset by an indirect positive pathway mediated by online relationship quality. These results underscore the importance of distinguishing between platform types when evaluating the psychological impacts of social media use and highlight the need to account for the nuanced and multifaceted ways in which different platforms influence well-being.
More broadly, the study underscores the importance of moving beyond one-size-fits-all narratives in public discourse and mental health practice. As social media platforms continue to diversify in both function and design, platform-specific factors—such as user intent, interaction dynamics, and content curation mechanisms—become increasingly relevant. Public education and digital well-being initiatives must reflect these nuances. In particular, strategies aimed at mitigating the harms of open-network platforms like X should focus on reducing compulsive use and limiting uncritical exposure to self-relevant content that may trigger social comparison and undermine self-esteem. At the same time, these initiatives should seek to maximize the benefits of such platforms by encouraging active, meaningful engagement that enhances the quality of online relationships. Importantly, public messaging would need to avoid conflating the effects of open-network platforms with those of closed-network platforms like LINE, which may offer unique psychosocial benefits through more intimate and supportive interactions.
As social media technologies continue to evolve—particularly through AI-driven personalization and algorithmically mediated engagement—future research must keep pace by investigating how these innovations shape user behavior, social connection, and long-term mental health outcomes. Doing so will be essential for informing adaptive, evidence-based policies and interventions in an increasingly digitized and platform-mediated world.
Conflict of Interest
The author has no conflicts of interest to declare.
Use of AI Services
During the preparation of this work the author used ChatGPT in order to improve the readability and language of the manuscript. After using this tool, the author reviewed and edited the content as needed and takes full responsibility for the content of the article.
Acknowledgement
The author gratefully acknowledges the support of the Yoshida Hideo Memorial Foundation (https://www.yhmf.jp/en/) for providing research data that facilitated the advancement of communication and media studies. This research received no specific grant from any funding agency in the public, commercial, or not-for-profit sectors.
Appendix
Table A1. Relationships of Control Variables with X and LINE use, Online Relationship, and Life Satisfaction.
|
|
Gender (female) Intercept |
Age Intercept |
||||||
|
|
β |
SE |
p |
95% CI |
β |
SE |
p |
95% CI |
|
Life satisfaction Intercept |
0.21 |
0.06 |
< .001 |
[.09, .33] |
−0.01 |
0.00 |
< .001 |
[−0.02, −0.00] |
|
Life satisfaction Slope |
−0.20 |
0.14 |
.072 |
[−.47, .08] |
−0.01 |
0.01 |
.175 |
[−0.02, 0.01] |
|
Online relationship Intercept |
−0.21 |
0.07 |
< .001 |
[−.35, −.07] |
−0.00 |
0.00 |
.258 |
[−0.01, 0.00] |
|
Online relationship Slope |
−0.02 |
0.14 |
.465 |
[−.30, .25] |
0.00 |
0.01 |
.488 |
[−0.01, 0.01] |
|
X Intercept |
0.00 |
0.07 |
.497 |
[−.13, .13] |
−0.03 |
0.00 |
< .001 |
[−0.03, −0.02] |
|
X Slope |
0.14 |
0.09 |
.063 |
[−.04, .32] |
−0.01 |
0.00 |
.035 |
[−0.02, 0.00] |
|
LINE Intercept |
0.29 |
0.07 |
< .001 |
[.16, .42] |
−0.03 |
0.00 |
< .001 |
[−0.03, −0.02] |
|
LINE Slope |
0.04 |
0.15 |
.072 |
[−.26, .34] |
0.00 |
0.01 |
.170 |
[−0.01, 0.02] |
|
|
Marital status Intercept |
Geographical location (Kanto) Intercept |
||||||
|
|
β |
SE |
p |
95% CI |
β |
SE |
p |
95% CI |
|
Life satisfaction Intercept |
0.31 |
0.03 |
< .001 |
[0.21, 0.34] |
−0.01 |
0.03 |
.243 |
[−0.51, 0.34] |
|
Life satisfaction Slope |
0.01 |
0.07 |
.452 |
[−0.05, 0.26] |
0.01 |
0.07 |
.175 |
[−0.09, 0.12] |
|
Online relationship Intercept |
0.03 |
0.03 |
.178 |
[−0.03, 0.09] |
0.05 |
0.03 |
.045 |
[−0.01, 0.10] |
|
Online relationship Slope |
−0.02 |
0.06 |
.408 |
[−0.14, 0.11] |
0.00 |
0.06 |
.469 |
[−0.11, 0.11] |
|
X Intercept |
−0.11 |
0.03 |
< .001 |
[−0.22, −0.07] |
0.03 |
0.03 |
.145 |
[−0.02, 0.08] |
|
X Slope |
−0.06 |
0.04 |
.088 |
[−0.14, 0.03] |
−0.06 |
0.04 |
.060 |
[−0.13, 0.02] |
|
LINE Intercept |
0.09 |
0.03 |
.001 |
[0.03, 0.15] |
−0.00 |
0.03 |
.438 |
[−0.06, 0.05] |
|
LINE Slope |
−0.05 |
0.07 |
.143 |
[−0.19, 0.09] |
0.01 |
0.05 |
.249 |
[−0.05, 0.14] |
|
|
Employment status Intercept |
Personal income intercept |
||||||
|
|
β |
SE |
p |
95% CI |
β |
SE |
p |
95% CI |
|
Life satisfaction Intercept |
0.02 |
0.03 |
.255 |
[−0.03, 0.12] |
0.11 |
0.03 |
< .001 |
[0.07, 0.23] |
|
Life satisfaction Slope |
0.00 |
0.06 |
.473 |
[−0.23, 0.08] |
−0.01 |
0.07 |
.470 |
[−0.13, 0.22] |
|
Online relationship Intercept |
0.10 |
0.03 |
.001 |
[0.04, 0.17] |
0.10 |
0.04 |
.005 |
[0.07, 0.24] |
|
Online relationship Slope |
0.02 |
0.06 |
.370 |
[−0.11, 0.15] |
0.17 |
0.07 |
.011 |
[0.02, 0.31] |
|
X Intercept |
0.01 |
0.03 |
.383 |
[−0.05, 0.07] |
−0.03 |
0.03 |
.186 |
[−0.10, 0.04] |
|
X Slope |
0.02 |
0.04 |
.345 |
[−0.07, 0.10] |
0.03 |
0.05 |
.266 |
[−0.07, 0.13] |
|
LINE Intercept |
0.14 |
0.03 |
< .001 |
[0.08, 0.20] |
0.07 |
0.04 |
.017 |
[0.01, 0.15] |
|
LINE Slope |
−0.02 |
0.07 |
.223 |
[−0.16, 0.12] |
−0.01 |
0.08 |
.229 |
[−0.17, 0.15] |
|
|
Marital status Slope |
Geographical location (Kanto) Slope |
||||||
|
|
β |
SE |
p |
95% CI |
β |
SE |
p |
95% CI |
|
Life satisfaction Slope |
0.20 |
0.07 |
.001 |
[0.07, 0.33] |
0.05 |
0.05 |
.175 |
[−0.05, 0.14] |
|
Online relationship Slope |
0.06 |
0.06 |
.159 |
[−0.14, 0.11] |
−0.07 |
0.05 |
.083 |
[−0.16, 0.03] |
|
X Slope |
−0.04 |
0.04 |
.179 |
[−0.13, 0.05] |
−0.03 |
0.03 |
.182 |
[−0.10, 0.04] |
|
LINE Slope |
0.07 |
0.07 |
.142 |
[−0.06, 0.21] |
0.01 |
0.05 |
.426 |
[−0.09, 0.11] |
|
|
Employment status Slope |
Personal income Slope |
||||||
|
|
β |
SE |
p |
95% CI |
β |
SE |
p |
95% CI |
|
Life satisfaction Slope |
0.25 |
0.11 |
.009 |
[0.05, 0.46] |
−0.08 |
0.09 |
.197 |
[−0.26, 0.10] |
|
Online relationship Slope |
−0.03 |
0.10 |
.401 |
[−0.11, 0.15] |
−0.00 |
0.09 |
.476 |
[−0.18, 0.17] |
|
X Slope |
−0.15 |
0.07 |
.021 |
[−0.28, −0.01] |
0.06 |
0.06 |
.188 |
[−0.07, 0.18] |
|
LINE Slope |
−0.08 |
0.11 |
.223 |
[−0.16, 0.12] |
0.10 |
0.10 |
.164 |
[−0.06, 0.21] |

This work is licensed under a Creative Commons Attribution-ShareAlike 4.0 International License.
Copyright © 2025 Yu Takizawa