
The longitudinal comorbidity of specific problematic internet use and psychological distress: A cross-lagged panel network analysis
Vol.19,No.5(2025)
Wenting Xu
 Zeyang Yang
Zhihao Yan
Mark Griffiths
Zeyang Yang
Zhihao Yan
Mark Griffiths
Studies have used network analysis to show the progression of problematic internet use (PIU). The present study examined the longitudinal comorbidity network models of specific types of PIU and psychological distress over time. A total of 685 undergraduate students (mean age = 19.12 years) completed three waves of surveys assessing two specific types of PIU (problematic social media use [PSMU] and problematic online video watching [POVW]) and psychological distress (depression, anxiety, and stress). Results showed that the ‘down-heartedness’ symptom of depression and the ‘agitation’ symptom of stress were consistently the most central symptoms in the PIU-psychological distress comorbidity network. ‘Mood modification’ and ‘conflict/functional impairment’ related to social media were the bridging symptoms that connected the other symptoms in the first two waves of studies. The ‘no initiative’ symptom of depression became the key bridging symptom in the third wave. Similarly, cross-lagged panel network analysis showed that PSMU symptoms (e.g., ‘conflict/functional impairment’) were the most influential and susceptible symptoms in earlier waves, while depression symptoms became key predictors of other symptoms over time in the comorbidity network. The findings provide new perspectives and means for the diagnosis and treatment of PIU and associated mental health illnesses.
problematic internet use; problematic social media use; problematic online video watching; psychological distress; longitudinal comorbidity; cross-lagged panel network analysis
Wenting Xu
Department of Psychology, School of Education, Soochow University, Suzhou
Wenting Xu is a PhD student in the Faculty of Social Sciences at the University of Macau. He was previously an undergraduate student in the Department of Psychology, School of Education at Soochow University. His research interests focus on problematic and addictive use of social media, the internet, and smartphones, particularly in employing quantitative methods to explore the relationships among different types of addiction and the pathways through which various psychological and behavioural factors interact.
Zeyang Yang
Department of Psychology, School of Education, Soochow University, Suzhou
Dr. Zeyang Yang is an Associate Professor in the Department of Psychology, School of Education at Soochow University. His research interests include cyberpsychology, behavioural addictions, and digital health.
Zhihao Yan
School of Educational Science, Anhui Normal University, Wuhu
Zhihao Yan is a PhD student in the School of Educational Science at Anhui Normal University. His research interests focus on problematic and addictive use of social media, online videos, and smartphones.
Yuanli Liu
Department of Psychology, School of Education, Soochow University, Suzhou
Yuanli Liu is a master's student in the Department of Psychology, School of Education at Soochow University. Her research interests include behavioural addictions and cyberchondria.
Mark Griffiths
International Gaming Research Unit, Psychology Department, Nottingham Trent University, Nottingham
Dr. Mark Griffiths is a Chartered Psychologist and Distinguished Emeritus Professor of Behavioural Addiction at the Nottingham Trent University, and Director of the International Gaming Research Unit. He is internationally known for his work into gambling and gaming addictions. He has won 27 national and/or international prizes for his research and has published over 1,650 refereed research papers, seven books, over 200 book chapters, and over 1,500 other articles.
Aalbers, G., McNally, R. J., Heeren, A., de Wit, S., & Fried, E. I. (2019). Social media and depression symptoms: A network perspective. Journal of Experimental Psychology General, 148(8), 1454–1462. https://doi.org/10.1037/xge0000528
American Psychiatric Association. (2022). Diagnostic and statistical manual of mental disorders: DSM-5-TR (5th ed., Text Revision). American Psychiatric Association Publishing. https://doi.org/10.1176/appi.books.9780890425787
Andreassen, C. S., Billieux, J., Griffiths, M. D., Kuss, D. J., Demetrovics, Z., Mazzoni, E., & Pallesen, S. (2016). The relationship between addictive use of social media and video games and symptoms of psychiatric disorders: A large-scale cross-sectional study. Psychology of Addictive Behaviors, 30(2), 252–262. https://doi.org/10.1037/adb0000160
Baggio, S., Starcevic, V., Billieux, J., King, D. L., Gainsbury, S. M., Eslick, G. D., & Berle, D. (2022). Testing the spectrum hypothesis of problematic online behaviors: A network analysis approach. Addictive Behaviors, 135, Article 107451. https://doi.org/10.1016/j.addbeh.2022.107451
Bai, W., Cai, H., Wu, S., Zhang, L., Feng, K.-X., Li, Y.-C., Liu, H.-Z., Du, X., Zeng, Z.-T., Lu, C.-M., Mi, W.-F., Zhang, L., Ding, Y.-H., Yang, J.-J., Jackson, T., Cheung, T., An, F.-R., & Xiang, Y.-T. (2022). Internet addiction and its association with quality of life in patients with major depressive disorder: A network perspective. Translational Psychiatry, 12(1), Article 138. https://doi.org/10.1038/s41398-022-01893-2
Balakrishnan, J., & Griffiths, M. D. (2017). Social media addiction: What is the role of content in YouTube? Journal of Behavioral Addictions, 6(3), 364–377. https://doi.org/10.1556/2006.6.2017.058
Belvederi Murri, M., Amore, M., Respino, M., & Alexopoulos, G. S. (2020). The symptom network structure of depressive symptoms in late-life: Results from a European population study. Molecular Psychiatry, 25(7), 1447–1456. https://doi.org/10.1038/s41380-018-0232-0
Billieux, J., King, D. L., Higuchi, S., Achab, S., Bowden-Jones, H., Hao, W., Long, J., Lee, H. K., Potenza, M. N., Saunders, J. B., & Poznyak, V. (2017). Functional impairment matters in the screening and diagnosis of gaming disorder. Journal of Behavioral Addiction, 6(3), 285–289. https://doi.org/10.1556/2006.6.2017.036
Billieux, J., Maurage, P., Lopez-Fernandez, O., Kuss, D. J., & Griffiths, M. D. (2015). Can disordered mobile phone use be considered a behavioral addiction? An update on current evidence and a comprehensive model for future research. Current Addiction Reports, 2(2), 156–162. https://doi.org/10.1007/s40429-015-0054-y
Bottaro, R., Griffiths, M. D., & Faraci, P. (2025). Meta-analysis of reliability and validity of the Bergen Social Media Addiction Scale (BSMAS). International Journal of Mental Health and Addiction. Advance online publication. https://doi.org/10.1007/s11469-025-01461-x
Brand, M., Laier, C., & Young, K. S. (2014). Internet addiction: Coping styles, expectancies, and treatment implications. Frontiers in Psychology, 5, Article 1256. https://doi.org/10.3389/fpsyg.2014.01256
Brand, M., Wegmann, E., Stark, R., Müller, A., Wölfling, K., Robbins, T. W., & Potenza, M. N. (2019). The Interaction of person-affect-cognition-execution (I-PACE) model for addictive behaviors: Update, generalization to addictive behaviors beyond internet-use disorders, and specification of the process character of addictive behaviors. Neuroscience & Biobehavioral Reviews, 104, 1–10. https://doi.org/10.1016/j.neubiorev.2019.06.032
Brand, M., Young, K. S., Laier, C., Wölfling, K., & Potenza, M. N. (2016). Integrating psychological and neurobiological considerations regarding the development and maintenance of specific Internet-use disorders: An interaction of person-affect-cognition-execution (I-PACE) model. Neuroscience & Biobehavioral Reviews, 71, 252–266. http://dx.doi.org/10.1016/j.neubiorev.2016.08.033
Brown, T. A., Chorpita, B. F., Korotitsch, W., & Barlow, D. H. (1997). Psychometric properties of the Depression Anxiety Stress Scales (DASS) in clinical samples. Behaviour Research and Therapy, 35(1), 79–89. https://doi.org/10.1016/S0005-7967(96)00068-X
Cai, H., Xi, H. T., An, F., Wang, Z., Han, L., Liu, S., Zhu, Q., Bai, W., Zhao, Y. J., Chen, L., Ge, Z. M., Ji, M., Zhang, H., Yang, B. X., Chen, P., Cheung, T., Jackson, T., Tang, Y. L., & Xiang, Y. T. (2021). The association between internet addiction and anxiety in nursing students: A network analysis. Frontiers in Psychiatry, 12, Article 723355. https://doi.org/10.3389/fpsyt.2021.723355
Cervigón-Carrasco, V., Schulze-Steinen, L., Ballester-Arnal, R., Billieux, J., Gil-Juliá, B., Giménez-Garcia, C., & Castro-Calvo, J. (2023). Attentional inhibitory control interference related to videogames, pornography, and TV series exposure: An experimental study in three independent samples. Computers in Human Behavior, 143, Article 107683. https://doi.org/10.1016/j.chb.2023.107683
Chen, I.-H., Ahorsu, D. K., Pakpour, A. H., Griffiths, M. D., Lin, C. Y., & Chen, C. Y. (2020). Psychometric properties of three simplified Chinese online-related addictive behavior instruments among mainland Chinese primary school students. Frontiers in Psychiatry, 11, Article 875. https://doi.org/10.3389/fpsyt.2020.00875
Chen, I.-H., Chen, C.-Y., Pakpour, A. H., Griffiths, M. D., Lin, C.-Y., Li, X.-D., & Tsang, H. W. H. (2021). Problematic internet-related behaviors mediate the associations between levels of internet engagement and distress among schoolchildren during COVID-19 lockdown: A longitudinal structural equation modeling study. Journal of Behavioral Addictions, 10(1), 135–148. https://doi.org/10.1556/2006.2021.00006
Chen, S., & Zhu, S. (2023). Unravelling the intricacies between gaming motivations and internet gaming disorder symptoms in adolescents: A network analysis of 2-year healthy and deteriorating transition profiles. Child and Adolescent Psychiatry and Mental Health, 17(1), Article 122. https://doi.org/10.1186/s13034-023-00671-2
Chen, Y., Gao, Q., & Rau, P.-L. P. (2017). Watching a movie alone yet together: Understanding reasons for watching Danmaku videos. International Journal of Human–Computer Interaction, 33(9), 731–743. https://doi.org/10.1080/10447318.2017.1282187
China Internet Network Information Center. (2025, January 17). 第55次《中国互联网络发展状况统计报告. [The 55th Statistical Report on Internet Development in China]. https://www.cnnic.net.cn/n4/2025/0117/c88-11229.html
Davis, R. A. (2001). A cognitive-behavioral model of pathological internet use. Computers in Human Behavior, 17(2), 187–195. https://doi.org/10.1016/S0747-5632(00)00041-8
Epskamp, S. (2020). Psychometric network models from time-series and panel data. Psychometrika, 85(1), 206–231. https://doi.org/10.1007/s11336-020-09697-3
Epskamp, S., Borsboom, D., & Fried, E. I. (2018). Estimating psychological networks and their accuracy: A tutorial paper. Behavior Research Methods, 50(1), 195–212. https://doi.org/10.3758/s13428-017-0862-1
Epskamp, S., Cramer, A. O., Waldorp, L. J., Schmittmann, V. D., & Borsboom, D. (2012). Qgraph: Network visualizations of relationships in psychometric data. Journal of Statistical Software, 48(4), 1–18. https://doi.org/10.18637/jss.v048.i04
Epskamp, S., Kruis, J., & Marsman, M. (2017). Estimating psychopathological networks: Be careful what you wish for. PLoS ONE, 12(6), Article e0179891. https://doi.org/10.1371/journal.pone.0179891
Flayelle, M., Brevers, D., King, D. L., Maurage, P., Perales, J. C., & Billieux, J. (2023). A taxonomy of technology design features that promote potentially addictive online behaviours. Nature Reviews Psychology, 2(3), 136–150. https://doi.org/10.1038/s44159-023-00153-4
Forbes, M. K., Wright, A. G. C., Markon, K. E., & Krueger, R. F. (2017). Evidence that psychopathology symptom networks have limited replicability. Journal of Abnormal Psychology, 126(7), 969–988. https://doi.org/10.1037/abn0000276
Friedman, J., Hastie, T., & Tibshirani, R. (2010). Regularization paths for generalized linear models via coordinate descent. Journal of Statistical Software, 33(1), 1–22. https://doi.org/10.18637/jss.v033.i01
Funkhouser, C. J., Chacko, A. A., Correa, K. A., Kaiser, A. J. E., & Shankman, S. A. (2021). Unique longitudinal relationships between symptoms of psychopathology in youth: A cross-lagged panel network analysis in the ABCD study. Journal of Child Psychology and Psychiatry, 62(2), 184–194. https://doi.org/10.1111/jcpp.13256
Gong, X., Xie, X., Xu, R., & Luo, Y. (2010). 抑郁-焦虑-压力量表简体中文版(DASS-21)在中国大学生中的测试报告[Psychometric properties of the Chinese version of DASS-21 in Chinese college students]. Chinese Journal of Clinical Psychology, 18(4), 443–446.
Griffiths, M. D. (1996). Internet “addiction”: An issue for clinical psychology? Clinical Psychology Forum, 97, 32–36. https://doi.org/10.53841/bpscpf.1996.1.97.32
Griffiths, M. (2005). A ‘components’ model of addiction within a biopsychosocial framework. Journal of Substance Use, 10(4), 191–197. https://doi.org/10.1080/14659890500114359
Guo, Z., Liang, S., Ren, L., Yang, T., Qiu, R., He, Y., & Zhu, X. (2022). Applying network analysis to understand the relationships between impulsivity and social media addiction and between impulsivity and problematic smartphone use. Frontiers in Psychiatry, 13, Article 993328. https://doi.org/10.3389/fpsyt.2022.993328
Hirota, T., McElroy, E., & So, R. (2021). Network analysis of internet addiction symptoms among a clinical sample of Japanese adolescents with autism spectrum disorder. Journal of Autism and Developmental Disorders, 51(8), 2764–2772. https://doi.org/10.1007/s10803-020-04714-x
Horváth, Z., Paksi, B., Fernández-Aranda, F., Jiménez-Murcia, S., & Demetrovics, Z. (2023). The predictive role of tolerance and health problems in problem gambling: A cross-sectional and cross-lagged network analyses. Journal of Gambling Studies, 39(4), 1781–1798. https://doi.org/10.1007/s10899-023-10191-5
Hussain, Z., Wegmann, E., Yang, H., & Montag, C. (2020). Social networks use disorder and associations with depression and anxiety symptoms: A systematic review of recent research in China. Frontiers in Psychology, 11, Article 211. https://doi.org/10.3389/fpsyg.2020.00211
Isvoranu, A.-M., Epskamp, S., Waldorp, L. J., & Borsboom, D. (2022). Network psychometrics with R: A guide for behavioral and social scientists (1st ed.). Routledge. https://doi.org/10.4324/9781003111238
Jia, J., Tong, W., Wang, X., & Fang, X. (2024). The comorbidity mechanism of problematic internet use and depression among Chinese college students: A cross-lagged panel network analysis. Addictive Behaviors, 156, Article 108057. https://doi.org/10.1016/j.addbeh.2024.108057
Jones, P. (2025). Networktools: Tools for identifying important nodes in networks (R package version 1.6.0). https://CRAN.R-project.org/package=networktools
Kircaburun, K., Yurdagül, C., Kuss, D., Emirtekin, E., & Griffiths, M. D. (2021). Problematic mukbang watching and its relationship to disordered eating and internet addiction: A pilot study among emerging adult mukbang watchers. International Journal of Mental Health and Addiction, 19(6), 2160–2169. https://doi.org/10.1007/s11469-020-00309-w
Kuss, D. J., & Griffiths, M. D. (2017). Social networking sites and addiction: Ten lessons learned. International Journal of Environmental Research and Public Health, 14(3), Article 311. https://doi.org/10.3390/ijerph14030311
Kuss, D. J., & Lopez-Fernandez, O. (2016). Internet addiction and problematic internet use: A systematic review of clinical research. World Journal of Psychiatry, 6(1), 143–176. https://doi.org/10.5498/wjp.v6.i1.143
Lee, J., Lee, E.-H., & Moon, S. H. (2019). Systematic review of the measurement properties of the Depression Anxiety Stress Scales–21 by applying updated COSMIN methodology. Quality of Life Research, 28(9), 2325–2339. https://doi.org/10.1007/s11136-019-02177-x
Li, J.-B., Mo, P. K., Lau, J. T., Su, X.-F., Zhang, X., Wu, A. M., Mai, J.-C., & Chen, Y.-X. (2018). Online social networking addiction and depression: The results from a large-scale prospective cohort study in Chinese adolescents. Journal of Behavioral Addictions, 7(3), 686–696. https://doi.org/10.1556/2006.7.2018.69
Li, L., Niu, Z., Griffiths, M. D., Wang, W., Chang, C., & Mei, S. (2021). A network perspective on the relationship between gaming disorder, depression, alexithymia, boredom, and loneliness among a sample of Chinese university students. Technology in Society, 67, Article 101740. https://doi.org/10.1016/j.techsoc.2021.101740
Li, Y., Mu, W., Xie, X., & Kwok, S. Y. C. L. (2023). Network analysis of internet gaming disorder, problematic social media use, problematic smartphone use, psychological distress, and meaning in life among adolescents. Digital Health, 9, 1–12. https://doi.org/10.1177/20552076231158036
Liu, T., & Potenza, M. N. (2007). Problematic internet use: Clinical implications. CNS Spectrums, 12(6), 453–466. https://doi.org/10.1017/S1092852900015339
Lopes, L. S., Valentini, J. P., Monteiro, T. H., Costacurta, M. C. D. F., Soares, L. O. N., Telfar-Barnard, L., & Nunes, P. V. (2022). Problematic social media use and its relationship with depression or anxiety: A systematic review. Cyberpsychology, Behavior, and Social Networking, 25(11), 691–702. https://doi.org/10.1089/cyber.2021.0300
Lovibond, P. F., & Lovibond, S. H. (1995). The structure of negative emotional states: Comparison of the Depression Anxiety Stress Scales (DASS) with the Beck Depression and Anxiety Inventories. Behaviour Research and Therapy, 33(3), 335–343. https://doi.org/10.1016/0005-7967(94)00075-U
Lu, J., Zhang, Q., Zhong, N., Chen, J., Zhai, Y., Guo, L., Lu, C., Chen, T., Jiang, Z., & Zheng, H. (2022). Addiction symptom network of young internet users: Network analysis. Journal of Medical Internet Research, 24(11), Article e38984. https://doi.org/10.2196/38984
Marttila, E., Koivula, A., & Räsänen, P. (2021). Does excessive social media use decrease subjective well-being? A longitudinal analysis of the relationship between problematic use, loneliness and life satisfaction. Telematics and Informatics, 59, Article 101556. https://doi.org/10.1016/j.tele.2020.101556
Ni, X., Yan, H., Chen, S., & Liu, Z. (2009). Factors influencing internet addiction in a sample of freshmen university students in China. CyberPsychology & Behavior, 12(3), 327–330. https://doi.org/10.1089/cpb.2008.0321
Ostovar, S., Allahyar, N., Aminpoor, H., Moafian, F., Nor, M. B. M., & Griffiths, M. D. (2016). Internet addiction and its psychosocial risks (depression, anxiety, stress and loneliness) among Iranian adolescents and young adults: A structural equation model in a cross-sectional study. International Journal of Mental Health and Addiction, 14(3), 257–267. https://doi.org/10.1007/s11469-015-9628-0
Peng, P., & Liao, Y. (2023). Six addiction components of problematic social media use in relation to depression, anxiety, and stress symptoms: A latent profile analysis and network analysis. BMC Psychiatry, 23, Article 321. https://doi.org/10.1186/s12888-023-04837-2
Qu, D., Liu, B., Jia, L., Zhang, X., Chen, D., Zhang, Q., Feng, Y., & Chen, R. (2024). The longitudinal relationships between short video addiction and depressive symptoms: A cross-lagged panel network analysis. Computers in Human Behavior, 152, Article 108059. https://doi.org/10.1016/j.chb.2023.108059
Radloff, L. S. (1977). The CES-D Scale: A self-report depression scale for research in the general population. Applied Psychological Measurement, 1(3), 385–401. https://doi.org/10.1177/014662167700100306
Robinaugh, D. J., Hoekstra, R. H. A., Toner, E. R., & Borsboom, D. (2020). The network approach to psychopathology: A review of the literature 2008–2018 and an agenda for future research. Psychological Medicine, 50(3), 353–366. https://doi.org/10.1017/S0033291719003404
Sánchez-Fernández, M., Bordá-Más, M., Rivera, F., & Griffiths, M. D. (2024). Problematic online behaviours among university students and associations with psychological distress symptoms and emotional role limitations: A network analysis approach. International Journal of Mental Health and Addiction. Advance online publication. https://doi.org/10.1007/s11469-024-01296-y
Shan, X., Ou, Y., Ding, Y., Yan, H., Chen, J., Zhao, J., & Guo, W. (2021). Associations between internet addiction and gender, anxiety, coping styles and acceptance in university freshmen in South China. Frontiers in Psychiatry, 12, Article 558080. https://doi.org/10.3389/fpsyt.2021.558080
Shapira, N. A., Goldsmith, T. D., Keck, P. E. Jr., Khosla, U. M., & McElroy, S. L. (2000). Psychiatric features of individuals with problematic internet use. Journal of Affective Disorders, 57(1–3), 267–272. https://doi.org/10.1016/S0165-0327(99)00107-X
Sonuga-Barke, E. J. S., Stoilova, M., Kostyrka-Allchorne, K., Bourgaize, J., Murray, A., Tan, M. P. J., Hollis, C., Townsend, E., & Livingstone, S. (2024). Pathways between digital activity and depressed mood in adolescence: Outlining a developmental model integrating risk, reactivity, resilience and reciprocity. Current Opinion in Behavioral Sciences, 58, Article 101411. https://doi.org/10.1016/j.cobeha.2024.101411
Starcevic, V., & Aboujaoude, E. (2017). Internet addiction: Reappraisal of an increasingly inadequate concept. CNS Spectrums, 22(1), 7–13. https://doi.org/10.1017/S1092852915000863
Teng, Z., Pontes, H. M., Nie, Q., Griffiths, M. D., & Guo, C. (2021). Depression and anxiety symptoms associated with internet gaming disorder before and during the COVID-19 pandemic: A longitudinal study. Journal of Behavioral Addictions, 10(1), 169–180. https://doi.org/10.1556/2006.2021.00016
Tian, M., Xing, Q., Wang, X., Yuan, X., Cheng, X., Ming, Y., Yin, K., Li, Z., & Wang, P. (2024). Prediction of junior high school students’ problematic internet use: The comparison of neural network models and linear mixed models in longitudinal study. Psychology Research and Behavior Management, 17, 1191–1203. https://doi.org/10.2147/PRBM.S450083
Tullett-Prado, D., Doley, J. R., Zarate, D., Gomez, R., & Stavropoulos, V. (2023). Conceptualising social media addiction: A longitudinal network analysis of social media addiction symptoms and their relationships with psychological distress in a community sample of adults. BMC Psychiatry, 23(1), Article 509. https://doi.org/10.1186/s12888-023-04985-5
Twigg, L., Duncan, C., & Weich, S. (2020). Is social media use associated with children's well-being? Results from the UK household longitudinal study. Journal of Adolescence, 80(1), 73–83. https://doi.org/10.1016/j.adolescence.2020.02.002
Van den Bergh, N., Marchetti, I., & Koster, E. H. W. (2021). Bridges over troubled waters: Map the interplay between anxiety, depression and stress through network analysis of the DASS-21. Cognitive Therapy and Research, 45(1), 46–60. https://doi.org/10.1007/s10608-020-10153-w
Wang, Z., Yang, H., & Elhai, J. D. (2022). Are there gender differences in comorbidity symptoms networks of problematic social media use, anxiety and depression symptoms? Evidence from network analysis. Personality and Individual Differences, 195, Article 111705. https://doi.org/10.1016/j.paid.2022.111705
Wickham, H., Averick, M., Bryan, J., Chang, W., McGowan, L., François, R., Grolemund, G., Hayes, A., Henry, L., Hester, J., Kuhn, M., Pedersen, T., Miller, E., Bache, S., Müller, K., Ooms, J., Robinson, D., Seidel, D., Spinu, V., . . . Yutani, H. (2019). Welcome to the tidyverse. The Journal of Open Source Software, 4(43), Article 1686. https://doi.org/10.21105/joss.01686
World Health Organization (2019). ICD-11 for mortality and morbidity statistics. World Health Organization. https://icd.who.int/browse11/
Wysocki, A. C., & Rhemtulla, M. (2021). On penalty parameter selection for estimating network models. Multivariate Behavioral Research, 56(2), 288–302. https://doi.org/10.1080/00273171.2019.1672516
Yan, Z., Yang, Z., & Griffiths, M. D. (2023). ‘Danmu’ preference, problematic online video watching, loneliness and personality: An eye-tracking study and survey study. BMC Psychiatry, 23, Article 523. https://doi.org/10.1186/s12888-023-05018-x
Yang, Z., Asbury, K., & Griffiths, M. D. (2019). Do Chinese and British university students use smartphones differently? A cross-cultural mixed methods study. International Journal of Mental Health and Addiction,17(3), 644–657. https:/doi.org/10.1007/s11469-018-0024-4
Yang, Y., Zhang, D.-Y., Li, Y.-L., Zhang, M., Wang, P.-H., Liu, X.-H., Ge, L.-N., Lin, W.-X., Xu, Y., Zhang, Y.-L., Li, F.-J., Xu, X.-J., Wu, H.-H., Cheung, T., Ng, C. H., Bo, H.-X., & Xiang, Y.-T. (2022). Prevalence, correlates, and network analysis of Internet addiction symptoms among Chinese pregnant and postpartum women. Journal of Affective Disorders, 298(Part A), 126–133. https://doi.org/10.1016/j.jad.2021.10.092
Yang, Y., Zhang, E. L., Liu, Y., Ge, X., Su, Z., Cheung, T., Ng, C. H., Xiang, M., & Xiang, Y.-T. (2023). Network analysis of suicidality and internet addiction symptoms among Chinese primary and secondary school students. Journal of Affective Disorders, 339, 145–152. https://doi.org/10.1016/j.jad.2023.07.030
Young, K. S. (1998). Internet addiction: The emergence of a new clinical disorder. Cyberpsychology & Behavior, 1(3), 237–244. https://doi.org/10.1089/cpb.1998.1.237
Yu, Y., Zhang, L., Su, X., Zhang, X., & Deng, X. (2025). Association between internet addiction and insomnia among college freshmen: The chain mediation effect of emotion regulation and anxiety and the moderating role of gender. BMC Psychiatry, 25(1), Article 326. https://doi.org/10.1186/s12888-025-06778-4
Zanon, C., Brenner, R. E., Baptista, M. N., Vogel, D. L., Rubin, M., Al-Darmaki, F. R., Gonçalves, M., Heath, P. J., Liao, H.-Y., Mackenzie, C. S., Topkaya, N., Wade, N. G., & Zlati, A. (2020). Examining the dimensionality, reliability, and invariance of the Depression, Anxiety, and Stress Scale–21 (DASS-21) across eight countries. Assessment, 28(6), 1531–1544. https://doi.org/10.1177/1073191119887449
Zhang, M., & Bian, Y. (2021). An analysis of the brain structures underlying the link between pathological internet use and anxiety. Addictive Behaviors, 112, Article 106632. https://doi.org/10.1016/j.addbeh.2020.106632
Zhao, Y., Qu, D., Chen, S., & Chi, X. (2023). Network analysis of internet addiction and depression among Chinese college students during the COVID-19 pandemic: A longitudinal study. Computers in Human Behavior, 138, Article 107424. https://doi.org/10.1016/j.chb.2022.107424
Zhou, M., Zhu, W., Sun, X., & Huang, L. (2022). Internet addiction and child physical and mental health: Evidence from panel dataset in China. Journal of Affective Disorders, 309, 52–62. https://doi.org/10.1016/j.jad.2022.04.115
Zhou, W., Yan, Z., Yang, Z., & Hussain, Z. (2023). Problematic social media use and mental health risks among first-year Chinese undergraduates: A three-wave longitudinal study. Frontiers in Psychiatry, 14, Article 1237924. https://doi.org/10.3389/fpsyt.2023.1237924
Zigmond, A. S., & Snaith, R. P. (1983). The hospital anxiety and depression scale. Acta Psychiatrica Scandinavica, 67(6), 361–370. https://doi.org/10.1111/j.1600-0447.1983.tb09716.x
Authors’ Contribution
Wenting Xu: conceptualization, data curation, formal analysis, investigation, methodology, software, visualization, writing—original draft, writing—review & editing. Zeyang Yang: conceptualization, data curation, formal analysis, funding acquisition, methodology, project administration, resources, supervision, validation, writing—original draft, writing—review & editing. Zhihao Yan: conceptualization, data curation, formal analysis, investigation, writing—original draft, writing—review & editing. Yuanli Liu: writing—original draft, writing—review & editing. Mark D. Griffiths: writing—original draft, writing—review & editing.
Editorial Record
First submission received:
January 1, 2025
Revision received:
April 28, 2025
Accepted for publication:
September 1, 2025
Editor in charge:
Maèva Flayelle
Introduction
The internet has become an integral part of people’s lives, and studies have investigated the negative effects of excessive, problematic, or addictive internet use since the mid-1990s (Griffiths, 1996; Young, 1998). Problematic internet use (PIU), sometimes used interchangeably with terms such as ‘internet addiction’ (IA), has been widely used as an umbrella concept to describe different types of uncontrolled internet use that results in psychological dependence, addictive symptoms, and significant functional impairments (Baggio et al., 2022; Liu & Potenza, 2007; Shapira et al., 2000). The association between PIU and psychological distress has been explored and confirmed in many studies (e.g., Hussain et al., 2020; Lopes et al., 2022; Marttila et al., 2021; Ostovar et al., 2016; Teng et al., 2021; Twigg et al., 2020; W. Zhou et al., 2023). Identifying the specific central symptoms in the association between PIU and psychological distress is important for the development of possible interventions (Bai et al., 2022; Zhao et al., 2023).
Recent studies have used network analysis to investigate the comorbidity networks of PIU and psychological distress, as well as the dynamic characteristics of connections between associated variables or symptoms (Cai et al., 2021; Jia et al., 2024; Qu et al., 2024; Wang et al., 2022; Zhao et al., 2023). However, network analysis studies have mainly examined generalized PIU using cross-sectional designs. Longitudinal network analysis focusing the development of the relationship between specific types of PIU and psychological distress are scarce. Different types of specific PIU might involve distinct behavioral patterns and psychological mechanisms (Baggio et al., 2022; Starcevic & Aboujaoude, 2017). For example, individuals may exhibit greater difficulties with attentional inhibitory control when bingewatching TV series and online pornography compared to playing videogames (Cervigón-Carrasco et al., 2023). Because cross-sectional studies are limited in capturing the temporal dynamics and reciprocal relationships between specific PIU and psychological distress symptoms, longitudinal network analysis is optimal for identifying central symptoms that may perpetuate maladaptive cycles and inform targeted intervention efforts. Therefore, it is necessary to explore the connections between specific PIU and psychological distress symptoms over time using a longitudinal network analysis approach.
Problematic Internet Use and Psychological Distress
Studies have often conceptualized uncontrolled internet use that leads to negative consequences as an addiction (Brand et al., 2014, 2019; Griffiths, 2005; Young, 1998; Zhao et al., 2023). It has been posited that addictive internet use, similar to other behavioral addictions (e.g., gambling addiction, gaming addiction, exercise addiction, work addiction, smartphone addiction, etc.), comprise six components: salience, mood modification, tolerance, withdrawal, conflict and relapse (Griffiths, 2005). However, IA or PIU was not included in the fifth edition (text revision) of the Diagnostic and Statistical Manual of Mental Disorders (DSM-5 TR; American Psychiatric Association, 2022) or the 11th revision of the International Classification of Diseases ICD-11 (World Health Organization, 2019). The only two behavioral addictions that are included in the DSM-5 and ICD-11 are gambling disorder and (internet) gaming disorder.
It is also necessary to avoid overpathologizing passionate entertainment behaviors as addiction (Billieux et al., 2015). Therefore, several studies have used the term ‘problematic internet use’ rather than ‘internet addiction’ to describe excessive online behaviors that negatively affect daily life but do not reach the severity of addiction (I.-H. Chen et al., 2021; Kuss & Lopez-Fernandez, 2016). The present study uses the term ‘PIU’ which is defined as excessive internet use that leads to functional impairment (Billieux et al., 2017).
Various theories have indicated the association between PIU and psychological distress (Brand et al., 2019; Davis, 2001; Sonuga-Barke et al., 2024). The cognitive-behavioral model of pathological internet use (Davis, 2001) suggests that mental health issues such as depression can predict pathological internet use. The Interaction of Person-Affect-Cognition-Execution (I-PACE) model for addictive behaviors posits that the development of addictive behaviors is a dynamic process with distinct early and late mechanisms, including cue reactivity and decision-making initially, and habitual actions and automated responses later. Addictive behaviors are the consequence of the interaction between personal characteristics (e.g., psychopathology variables) and responses to cues or triggers. Specific addictive behaviors may play a role in the stabilization and intensification of predisposing variables (Brand et al., 2019). Similarly, a recent theoretical framework (‘reciprocal pathways between digital activity and depressed mood’) proposes that there are reciprocal pathways between digital activities and depression. Engaging in risky online behaviors can potentially lead to depressive moods by consistently triggering negative emotions and thoughts, such as anger and self-criticism. (Sonuga-Barke et al., 2024). Empirical evidence has shown that poor mental health conditions can predict higher PIU (e.g., Tian et al., 2024; Zhang & Bian, 2021), and PIU may in turn lead to greater psychological distress (e.g., M. Zhou et al., 2022).
Starcevic and Aboujaoude (2017) argue that it is important to focus on specific activities rather than the general concept of IA. Since Davis (2001) emphasized the importance of differentiating between generalized and specific pathological internet use, an increasing number of studies have confirmed the associations between specific forms of PIU, such as problematic social media use (PSMU) and problematic online video watching (POVW), and psychological distress. (e.g., anxiety, depression, stress; Hussain et al., 2020; Kircaburun et al., 2021; Lopes et al., 2022; Ostovar et al., 2016; Yan et al., 2023). Longitudinal studies also demonstrated the bi-directional link between specific types of PIU (e.g., PSMU) and psychological distress and poor well-being (I.-H. Chen et al., 2021; J.-B. Li et al., 2018; Marttila et al., 2021; Teng et al., 2021; Twigg et al., 2020; W. Zhou et al., 2023). Based on the aforementioned definition of PIU, PSMU and POVW can be defined as the specific activities of using social media and watching online videos that lead to functional impairment and other negative consequences in individuals’ daily lives including the compromising of interpersonal relationships, education and/or occupation (Billieux et al., 2017; Brand et al., 2019).
Overall, the positive association between specific PIU and psychological distress has been confirmed by both theoretical models and robust empirical studies. However, most studies have analyzed the relationship between the total scores on scales assessing PIU and psychological distress and have paid limited attention to the specific symptoms or measurement items of PIU or psychological distress. Further exploration of the link between PIU and psychological distress from a symptom-focused perspective is necessary. For instance, it remains unknown how features of addictive behaviors (e.g., withdrawal and tolerance, initially proposed in the components model of addiction) are connected with symptoms of anxiety, depression, or stress. It is therefore imperative to investigate the influence of these components on the relationship between specific PIU manifestations and mental health. Understanding which symptoms are central in the relationship between PIU and psychological distress is also essential for the implementation of potential interventions.
Network Analysis Studies of Problematic Internet Use
In recent years, the emerging approach of network analysis has been increasingly employed by scholars to examine the intricate structure of PIU and its complex interplay with psychological variables (Y. Yang et al., 2022, 2023; Zhao et al., 2023; see Table 1). Through the construction of network models, researchers can pinpoint the central symptoms of PIU in longitudinal studies (Belvederi et al., 2020; Epskamp et al., 2017; Qu et al., 2024). A central symptom is defined as a node exhibiting either the highest number of strong connections to other nodes in the network, or the highest centrality indices (e.g., strength, betweenness, or closeness centrality) within the network analysis framework (Epskamp et al., 2018).
In a network analysis study of PIU, Bai et al. (2022) identified ‘preoccupation with the internet’ and ‘impaired functioning’ as the central symptoms of PIU among patients with major depressive disorder. Cai et al. (2021) reported that factors such as ‘academic decline due to internet use’, ‘depressed/moody/nervous only while being offline’, and ‘others complain about your time spent online’ were the central symptoms in the PIU-anxiety network. However, this study focused solely on anxiety as a mental health issue, while other variables such as depression and stress were not included in the comparison. In addition, a study of PIU among adolescents with autism spectrum disorders identified ‘defensive and secretive behaviors’ and ‘concealment of internet use’ as the central symptoms of PIU (Hirota et al., 2021). Among 2,845 non-clinical adolescents and young adults, ‘fear about boredom if offline’ and ‘uncontrollable use’ were highlighted as key factors triggering and exacerbating other symptoms of PIU, while ‘affected study and work’ were the outcome symptoms (Lu et al., 2022).
Network analysis has emerged as a valuable analytical method in research examining specific forms of PIU. For instance, some studies have found that PSMU may be associated with specific depressive symptoms, with central symptoms such as ‘fatigue,’ ‘loneliness,’ and ‘lack of enthusiasm’ being reported (Aalbers et al., 2019; Wang et al., 2022). Wang et al. (2022) found that ‘lack of enthusiasm’, as a symptom of depression, was the most central symptom in the comorbidity network of PSMU, anxiety, and depression. ‘Conflict/functional impairment’ in PSMU had the highest betweenness value. This indicates the higher significance of depression symptoms compared to anxiety symptoms within the PSMU-anxiety-depression network. Betweenness centrality is a metric that quantifies a node's ‘bridging role’ in a network, reflecting how frequently the node lies on the shortest paths between other node pairs. Another cross-sectional network analysis study conducted among a large sample in China found that conflict and mood modification were the key bridging nodes in the network connecting PSMU with mental health risk symptoms (Peng & Liao, 2023). A different network analysis indicated that problematic online behaviors manifest as distinct entities or communities rather than in a single category of internet or smartphone addiction, which again emphasizes the need to focus on specific forms of PIU (Baggio et al., 2022).
Table 1. Summary of Previous Network Analysis Studies Examining PIU and Psychological Distress.
|
Study |
Variables |
Central nodes |
Network analysis approach |
|
Bai et al. (2022) |
IA; quality of life |
Preoccupation with the internet; Job performance or productivity suffer because of the internet; Neglect chores to spend more time online |
Cross-sectional |
|
Cai et al. (2021) |
IA; anxiety |
Academic decline due to internet use; Depressed/moody/nervous only while being off-line; School grades suffer due to internet use; Others complain about your time spent online |
Cross-sectional |
|
S. Chen & Zhu, (2023) |
IGD; gaming motivations |
Sense of victory; Enjoy being in the gaming world; Sense of achievement |
Longitudinal |
|
Hirota et al. (2021) |
IA |
Academic efficiency declines due to internet use; Life boring and empty without the internet; Anticipation for future online activities; Prefer the excitement online to the time with others |
Cross-sectional |
|
Jia et al. (2024) |
PIU; depression |
Interpersonal and physical problems; Tolerance symptoms; Loss of energy; Withdrawal symptoms; ‘Time management problems |
Longitudinal |
|
L. Li et al. (2021) |
Gaming disorder; depression; alexithymia; boredom; loneliness |
Loneliness; Boredom |
Cross-sectional |
|
Y. Li et al. (2023) |
IGD; PSU; PSMU; depression; anxiety; stress; meaning in life |
Withdrawal; Mood modification; Tolerance |
Cross-sectional |
|
Lu et al. (2022) |
IA |
School work suffers; Job performance suffers; Fear about boredom if offline; Fail to stop being on the web; Fantasize about being on the web; Defensive or secretive about being on the web; Hidden web time |
Cross-sectional |
|
Marttila et al. (2021) |
PSMU; loneliness; life satisfaction |
PSMU; Loneliness; Life satisfaction |
Cross-sectional; Longitudinal |
|
Peng & Liao (2023) |
PSMU; depression; anxiety; stress |
Conflict; Mood modification |
Cross-sectional |
|
Qu et al. (2024) |
Short video addiction; depression |
Tolerance; Anhedonia; Conflict; Sad mood; Salience; Sleep |
Longitudinal |
|
Sánchez-Fernández et al. (2024) |
generalized PIU; PSMU; problematic online gaming; Depression, Anxiety, and Stress; emotional role |
Coping or mood modification; Withdrawal; Preoccupation; Relapse; Continuation despite problems; Depression; Anxiety; Stress |
Cross-sectional |
|
Tullett-Prado et al. (2023) |
social media addiction; depression; anxiety; stress |
Tolerance; Mood modification |
Longitudinal |
|
Wang et al. (2022) |
PSMU; anxiety; depression |
Salience; Conflict; Enthusiasm |
Cross-sectional |
|
Y. Yang et al. (2022) |
IA; quality of life |
Request an extension for longer time spent online; Preoccupation with the internet; Failure to cut down the time spent online |
Cross-sectional |
|
Y. Yang et al. (2023) |
IA; suicidality |
Request an extension for longer time spent online; Depressed/moody/nervous only while being offline; Sleep loss due to late night logins |
Cross-sectional |
|
Zhao et al. (2023) |
IA; depression |
Escape; Irritable; Energy; Guilty |
Longitudinal |
|
Note. IA: internet addiction; IGD: internet gaming disorder; PIU: problematic internet use; PSU: problematic smartphone use; PSMU: problematic social media use. |
|||
Guo et al. (2022) reported that the PSMU symptoms ‘mood modification’ and ‘relapse’ were closely connected with ‘motor impulsivity’ in the network community of impulsivity symptoms. Network analysis studies have shown that among adolescent and college student populations, problematic online behaviors (e.g., online gaming disorder and PSMU) were associated with psychological distress variables or symptoms such as loneliness, depression, alexithymia, and stress (L. Li et al., 2021; Y. Li et al., 2023; Sánchez-Fernández et al., 2024).
Longitudinal Network Analysis Studies
Longitudinal network analysis provides a nuanced perspective over general network analysis by capturing the evolution of network dynamics, thereby enhancing the precision of predictions about future state and behaviors within the network (S. Chen & Zhu, 2023; Tullett-Prado et al., 2023). Recognizing the development of symptomatic networks, longitudinal analysis becomes indispensable (Forbes et al., 2017; Funkhouser et al., 2020; Horváth et al., 2023; Robinaugh et al., 2020). Several studies have found a dynamically evolving association between symptoms accompanying problematic online short video watching, PIU, and depression (Jia et al., 2024; Qu et al., 2024; Zhao et al., 2023). In a two-wave study of PIU and depression, Zhao et al. (2023) reported that the PIU symptoms ‘escape’ and ‘irritability’ and the depression symptoms ‘lack of energy’ and ‘guilty’ (Feeling bad about yourself, or that you are a failure or have let yourself or your family down) were the most central over time. ‘Guilty’ in depression and ‘escape’ in PIU were the bridge symptoms, playing an important role in the cycle between PIU and depression.
In a four-wave longitudinal network analysis, Jia et al. (2024) reported that the PIU symptom ‘time management’ was the most influential node that predicted the depression symptoms over the first two study waves, while the PIU symptom ‘tolerance’ was the most influential in the later wave. In a two-wave network analysis of short video addiction and depression, the addiction symptom ‘tolerance’ and the depressive symptom ‘anhedonia’ were the most influential ones that predicted the subsequent depression symptoms over time. The addiction symptom ‘conflict’ and the depressive symptom ‘sad mood’ were the bridging symptoms (Qu et al., 2024).
For PSMU, a longitudinal network analysis study found that ‘tolerance’ and ‘mood modification’ were the most central symptoms in the network. Depression was less connected with PSMU than anxiety and stress (Tullett-Prado et al., 2023). Overall, using longitudinal network analysis, studies have identified the central, bridging, and influential symptoms (with high predictive power regarding subsequent symptoms) in the network of PIU and psychological distress over time. However, the observed inconsistency across studies, combined with the predominant focus on depression in the literature, warrants further investigation.
Overall, longitudinal network analysis studies on problematic internet use (PIU) and psychological distress have focused on three key aspects: (i) central and bridging nodes (or symptoms) between the two network communities over time, (ii) symptoms that predict subsequent symptoms across time points, and (iii) symptoms predicted by earlier manifestations. Consequently, the present study investigated the temporal dynamics of most central and bridging symptoms within the network, while specifically identifying influential (predictive) symptoms and susceptible (predicted) symptoms over time.
The Present Study
The relationship between PIU and psychological distress has been identified in theoretical models and empirical studies (e.g., Brand et al., 2019; Hussain et al., 2020; Lopes et al., 2022; Ostovar et al., 2016; Sonuga-Barke et al., 2024). Using network analysis, studies have detected the most central and influential symptoms or variables in the comorbidity network of PIU and psychological distress (e.g., L. Li et al., 2021; Qu et al., 2024; Wang et al., 2022). However, many network analysis studies have used the total scores of either PIU or psychological distress scales in their networks (e.g., Y. Li et al., 2023; Tullett-Prado et al., 2023) and did not focus on the specific symptoms or items. Longitudinal network analysis studies focusing on specific types of PIU and psychological distress are still needed to understand how particular problematic online activities, such as PSMU or POVW, are linked to psychological distress over time. Therefore, the present study selected two specific online activities (i.e., PSMU and POVW) as specific PIUs to examine.
PSMU and POVW were selected as specific types of PIU for several reasons. First, the inclusion of PSMU and POVW is grounded in their distinct behavioral mechanisms. PSMU is driven by social interaction and reassurance needs (e.g., fear of missing out and social comparison), whereby users engage in social communication (e.g., commenting, sharing) to fulfill belongingness and self-presentation needs (Billieux et al., 2015; Kuss & Griffiths, 2017). In contrast, POVW is characterized by relatively passive consumption (e.g., binge-watching YouTube videos or mukbang videos), which prioritizes escapism and mood regulation through unidirectional content consumption (Balakrishnan & Griffiths, 2017; Kircaburun et al., 2021). This dichotomy reflects the theoretical distinction between ‘social media’ (focused on networked interactions) and ‘online video platforms’ (focused on content dissemination). Because it is time-consuming to include all types of specific PIU in a three-wave longitudinal study, these two activities were chosen as being representative of specific online activities. Second, these two types of online applications were selected for their prevalence among Chinese internet users. According to the 55th Statistical Report on China’s Internet Development, online social communication and online video consumption have been the two most frequently used types of applications in China (China Internet Network Information Center, 2025). The present study therefore focused on social media use and online video use as the most representative online activities for the Chinese population. Third, some online activities such as online gambling and online pornography websites are illegal or inaccessible in mainland China’s internet context. Consequently, investigating such activities would be unsuitable because many Chinese participants likely lack access to or have little engagement in these behaviors.
Because the design features of social media and online video platforms differ (Flayelle et al., 2023), it is necessary to compare whether they are linked to psychological distress variables/symptoms in distinct ways. Moreover, users often engage in both activities simultaneously (e.g., scrolling social media while watching videos; Y. Chen et al., 2017), making it challenging to isolate their effects in natural settings. Examining them simultaneously provides a more ecologically valid understanding of how PIU manifests in daily life.
The anxiety, stress, and depression subscales of the DASS were used to assess psychological distress according to the tripartite model of mental health (Brown et al., 1997). The DASS operationalizes the tripartite model by assessing three core dimensions: the depression subscale (DASS-D) captures diminished positive affectivity, the anxiety subscale (DASS-A) reflects physiological hyperarousal, and the stress subscale (DASS-S) quantifies persistent negative emotional states (Brown et al., 1997).
It is also meaningful to use cross-lagged panel network (CLPN) analysis to detect symptoms that could predict others and have been predicted over time within the comorbidity mechanism of specific PIU and psychological distress. Therefore, the present study investigated the connections between the symptoms of two specific types of PIU (i.e., PSMU and POVW) and psychological distress over time using longitudinal network analysis. The node centrality and bridge centrality indices in the networks were estimated over time. The cross-lagged paths in the directed CLPN models were estimated to detect the symptoms with the highest influence (with high out-expected influence [out-EI] values) and susceptivity (with high in-expected influence [in-EI] values).
Moreover, previous studies have found that Chinese university students, especially first-year undergraduates, experience greater difficulties adapting to university life These students also tend to exhibit more problematic smartphone use compared with Western students (Z. Yang et al., 2019). The association between mental health risks and IA among Chinese freshmen has been widely examined in the extant literature (e.g., Ni et al., 2009; Shan et al., 2021; Yu et al., 2025). However, longitudinal symptom-focused network analyses targeting this population remain scarce. Therefore, the present study focused specifically on first-year undergraduates.
There were four research questions: (i) What are the most central symptoms in the comorbidity network of specific PIU (PSMU and POVW) and psychological distress over time? (ii) What are the bridging symptoms in the comorbidity network over time? (iii) What are the most influential symptoms that predict the other symptoms over time in the CLPN model? (iv) What are the most susceptible symptoms that other symptoms predict over time in the CLPN model? Given the exploratory nature of the study, there were no specific hypotheses.
Methods
Participants and Procedure
Participants were first-year undergraduates recruited as part of a large project of specific PIU and psychological distress during 2021 and 2022. A total of 685 participants (mean age = 19.12 years, SD = 0.92), comprising 221 males and 464 females, completed three waves of surveys (T1: Time 1; T2: Time 2; and T3: Time 3).
Participants were recruited through convenience sampling. The survey link was distributed using the online survey platform www.wjx.cn where surveys could not be submitted unless all the questions had been answered. The three waves of surveys were conducted from October 2021 to May 2022, with each wave spaced four months apart. Participants were asked to provide the last six digits of their phone number for data matching. The six digits were solely used for data matching and were not included in data analysis. It was not possible to trace individual identities using these digits. The inclusion criteria were being a first-year undergraduate student and voluntarily enrolling in the study and providing consent to do so.
A total of 834 surveys were initially completed. However, 12 were excluded from analysis due to invalid data, specifically uniform answering patterns (e.g., systematically selecting the same answer option across all survey items). Therefore, a total of 822 participants remained at the first time point (T1). Of these, 699 completed the second survey at T2, and 685 completed surveys at all three waves. At the start of each survey, all participants were provided with consent forms, from which informed consent was obtained, and participation in the study was voluntary. All responses were anonymous.
A four-month interval was determined for three key reasons. First, because the target participants were first-year undergraduate students, the surveys needed to be distributed between their formal enrollment (October) and summer vacation (June). Second, conducting three survey waves with two intervals provides methodological advantages over two waves with one interval because it allows for a better examination of temporal changes in specific PIU and psychological distress. Finally, comparing relationship dynamics across two distinct intervals offers richer insights into developmental trajectories than single-interval analyses, enhancing the analytical depth of longitudinal observations.
Measures
Bergen Social Media Addiction Scale (BSMAS)
PSMU was assessed using the six-item BSMAS (Andreassen et al., 2016; Chinese version: I.-H. Chen et al. (2020). The BSMAS items (e.g., …used social media so much that it has had a negative impact on your job/studies) – based on the components model of addiction (Griffiths, 2005) – are rated using a five-point Likert scale from 1 (very rarely) to 5 (very often). Each item in the BSMAS assesses a specific component in Griffiths’ (2005) model. Scores range from 6 to 30 with higher scores indicating greater PSMU. The BSMAS has been proved to be reliable and valid in previous studies (e.g., I.-H. Chen et al., 2020; Y. Li et al., 2023; Peng & Liao, 2023). A recent meta-analysis evaluated the psychometric properties of the BSMAS, finding it to be a reliable and valid tool for assessing social media addiction across diverse populations. The evidence supports its unidimensionality, internal consistency, and associations with related constructs such as anxiety and depression (Bottaro et al., 2025). The Cronbach’s alpha values for the three waves were .85 (T1), .85 (T2), and .86 (T3).
Problematic Online Video Watching Scale (POVWS)
POVW was assessed using the six-item POVWS adapted from the BSMAS (Andreassen et al., 2016; Chinese version: Yan et al., 2023). The POVWS items (e.g., …tried to cut down on watching online videos without success) are rated using a five-point Likert scale from 1 (very rarely) to 5 (very often). Each item in the POVWS assesses a specific component in Griffiths’ (2005) model. Scores range from 6 to 30 with higher scores indicating greater POVW. The POVWS has been shown to be reliable and valid in previous studies (e.g., Yan et al., 2023). The Cronbach’s alpha values for the three waves were .77 (T1), .82 (T2), and .82 (T3).
Depression Anxiety Stress Scale-21 (DASS-21)
Psychological distress was assessed using the 21-item DASS-21 (Lovibond & Lovibond, 1995; Chinese version: Gong et al., 2010). The scale comprises three subscales (depression, anxiety and stress) each consisting of seven items. The items (see Table 2) are rated from 0 (did not apply to me at all) to 3 (applied to me very much, or most of the time). Scores range from 0 to 21 on each subscale with higher scores indicating greater psychological distress. The DASS-21 has been proved to be reliable and valid in previous studies (e.g., Y. Li et al., 2023; Peng & Liao, 2023; Zanon et al., 2020). A systematic review by Lee et al. (2019) found that the DASS-21 demonstrates strong reliability and validity. The Cronbach's alpha values for the three waves were: depression (T1: .84, T2: .85, T3: .86), anxiety (T1: .79, T2: .82, T3: .82), and stress (T1: .78, T2: .82, T3: .82).
Table 2. Descriptive Statistics and Abbreviations for the Items.
|
Component |
Label |
Items |
Mean |
SD |
|
Depression, Anxiety and Stress Scale-21 |
||||
|
T1A1: Time 1 Anxiety 1 |
|
0.82 |
0.78 |
|
|
Dry mouth |
T2A1: Time 2 Anxiety 1 |
I was aware of dryness of my mouth |
0.74 |
0.76 |
|
T3A1: Time 3 Anxiety 1 |
|
0.73 |
0.78 |
|
|
T1A2: Time 1 Anxiety 2 |
|
0.41 |
0.65 |
|
|
Breathing difficulty |
T2A2: Time 2 Anxiety 2 |
I experienced breathing difficulty (e.g., excessively rapid breathing, breathlessness in the absence of physical exertion) |
0.39 |
0.64 |
|
T3A2: Time 3 Anxiety 2 |
|
0.40 |
0.64 |
|
|
T1A3: Time 1 Anxiety 3 |
|
0.44 |
0.67 |
|
|
Trembling |
T2A3: Time 2 Anxiety 3 |
I experienced trembling (e.g., in the hands) |
0.44 |
0.68 |
|
T3A3: Time 3 Anxiety 3 |
|
0.40 |
0.64 |
|
|
T1A4: Time 1 Anxiety 4 |
|
1.72 |
0.93 |
|
|
Worried |
T2A4: Time 2 Anxiety 4 |
I was worried about situations in which I might panic and make a fool of myself |
1.58 |
0.95 |
|
T3A4: Time 3 Anxiety 4 |
|
1.54 |
0.94 |
|
|
T1A5: Time 1 Anxiety 5 |
|
0.46 |
0.66 |
|
|
Panic |
T2A5: Time 2 Anxiety 5 |
I felt I was close to panic |
0.48 |
0.70 |
|
T3A5: Time 3 Anxiety 5 |
|
0.51 |
0.71 |
|
|
T1A6: Time 1 Anxiety 6 |
|
0.46 |
0.74 |
|
|
Heart aware |
T2A6: Time 2 Anxiety 6 |
I was aware of the action of my heart in the absence of physical exertion (e.g., sense of heart rate increase, heart missing a beat) |
0.49 |
0.73 |
|
T3A6: Time 3 Anxiety 6 |
|
0.53 |
0.74 |
|
|
T1A7: Time 1 Anxiety 7 |
|
0.54 |
0.72 |
|
|
Scared |
T2A7: Time 2 Anxiety 7 |
I felt scared without any good reason |
0.48 |
0.69 |
|
T3A7: Time 3 Anxiety 7 |
|
0.53 |
0.72 |
|
|
T1D1: Time 1 Depression 1 |
|
0.60 |
0.73 |
|
|
No positive |
T2D1: Time 2 Depression 1 |
I couldn’t seem to experience any positive feeling at all |
0.67 |
0.79 |
|
T3D1: Time 3 Depression 1 |
|
0.65 |
0.75 |
|
|
T1D2: Time 1 Depression 2 |
|
0.89 |
0.80 |
|
|
No initiative |
T2D2: Time 2 Depression 2 |
I found it difficult to work up the initiative to do things |
1.04 |
0.85 |
|
T3D2: Time 3 Depression 2 |
|
1.15 |
0.88 |
|
|
T1D3: Time 1 Depression 3 |
|
0.67 |
0.83 |
|
|
Not looking forward |
T2D3: Time 2 Depression 3 |
I felt that I had nothing to look forward to |
0.78 |
0.85 |
|
T3D3: Time 3 Depression 3 |
|
0.82 |
0.85 |
|
|
T1D4: Time 1 Depression 4 |
|
0.81 |
0.81 |
|
|
Down-hearted |
T2D4: Time 2 Depression 4 |
I felt down-hearted and blue |
0.82 |
0.76 |
|
T3D4: Time 3 Depression 4 |
|
0.84 |
0.78 |
|
|
T1D5: Time 1 Depression 5 |
|
0.50 |
0.74 |
|
|
Not enthusiastic |
T2D5: Time 2 Depression 5 |
I was unable to become enthusiastic about anything |
0.59 |
0.76 |
|
|
T3D5: Time 3 Depression 5 |
|
0.56 |
0.77 |
|
|
T1D6: Time 1 Depression 6 |
|
0.27 |
0.59 |
|
Worthless person |
T2D6: Time 2 Depression 6 |
I felt I wasn’t worth much as a person |
0.32 |
0.64 |
|
T3D6: Time 3 Depression 6 |
|
0.32 |
0.65 |
|
|
T1D7: Time 1 Depression 7 |
|
0.34 |
0.67 |
|
|
Meaningless of life |
T2D7: Time 2 Depression 7 |
I felt that life was meaningless |
0.38 |
0.70 |
|
T3D7: Time 3 Depression 7 |
|
0.39 |
0.70 |
|
|
T1S1: Time 1 Stress 1 |
|
0.92 |
0.74 |
|
|
No wind down |
T2S1: Time 2 Stress 1 |
I found it hard to wind down |
0.88 |
0.74 |
|
T3S1: Time 3 Stress 1 |
|
0.89 |
0.74 |
|
|
|
T1S2: Time 1 Stress 2 |
|
0.67 |
0.76 |
|
Overreactive |
T2S2: Time 2 Stress 2 |
I tended to over-react to situations |
0.65 |
0.76 |
|
|
T3S2: Time 3 Stress 2 |
|
0.68 |
0.74 |
|
|
T1S3: Time 1 Stress 3 |
|
1.08 |
0.84 |
|
Nervous energy |
T2S3: Time 2 Stress 3 |
I felt that I was using a lot of nervous energy |
1.00 |
0.82 |
|
|
T3S3: Time 3 Stress 3 |
|
1.15 |
0.85 |
|
|
T1S4: Time 1 Stress 4 |
|
0.87 |
0.79 |
|
Agitated |
T2S4: Time 2 Stress 4 |
I found myself getting agitated |
0.83 |
0.81 |
|
|
T3S4: Time 3 Stress 4 |
|
0.87 |
0.78 |
|
|
T1S5: Time 1 Stress 5 |
|
0.84 |
0.84 |
|
No relaxing |
T2S5: Time 2 Stress 5 |
I found it difficult to relax |
0.80 |
0.83 |
|
|
T3S5: Time 3 Stress 5 |
|
0.86 |
0.83 |
|
|
T1S6: Time 1 Stress 6 |
|
1.04 |
0.86 |
|
Intolerant |
T2S6: Time 2 Stress 6 |
I was intolerant of anything that kept me from getting on with what I was doing |
0.97 |
0.86 |
|
|
T3S6: Time 3 Stress 6 |
|
0.98 |
0.86 |
|
|
T1S7: Time 1 Stress 7 |
|
0.76 |
0.80 |
|
Touchy |
T2S7: Time 2 Stress 7 |
I felt that I was rather touchy |
0.75 |
0.81 |
|
|
T3S7: Time 3 Stress 7 |
|
0.75 |
0.81 |
|
|
|
Bergen Social Media Addiction Scale |
|
|
|
|
T1PSMU1: Time 1 Problematic Social Media Use 1 |
|
3.14 |
1.10 |
|
Salience |
T2PSMU1: Time 2 Problematic Social Media Use 1 |
. . . spent a lot of time thinking about social media or planned use of social media? |
3.13 |
1.06 |
|
|
T3PSMU1: Time 3 Problematic Social Media Use 1 |
|
3.18 |
1.01 |
|
|
T1PSMU2: Time 1 Problematic Social Media Use 2 |
|
3.13 |
1.13 |
|
Craving/tolerance |
T2PSMU2: Time 2 Problematic Social Media Use 2 |
. . . felt an urge to use social media more and more? |
3.12 |
1.06 |
|
|
T3PSMU2: Time 3 Problematic Social Media Use 2 |
|
3.11 |
1.05 |
|
|
T1PSMU3: Time 1 Problematic Social Media Use 3 |
|
2.33 |
1.04 |
|
Mood modification |
T2PSMU3: Time 2 Problematic Social Media Use 3 |
. . . used social media to forget about personal problems? |
2.46 |
0.99 |
|
|
T3PSMU3: Time 3 Problematic Social Media Use 3 |
|
2.58 |
1.02 |
|
|
T1PSMU4: Time 1 Problematic Social Media Use 4 |
|
2.55 |
1.13 |
|
Relapse/loss of control |
T2PSMU4: Time 2 Problematic Social Media Use 4 |
. . . tried to cut down on the use of social media without success? |
2.65 |
1.05 |
|
|
T3PSMU4: Time 3 Problematic Social Media Use 4 |
|
2.70 |
1.05 |
|
|
T1PSMU5: Time 1 Problematic Social Media Use 5 |
|
2.48 |
1.11 |
|
Withdrawal |
T2PSMU5: Time 2 Problematic Social Media Use 5 |
. . . become restless or troubled if you have been prohibited from using social media? |
2.51 |
1.09 |
|
|
T3PSMU5: Time 3 Problematic Social Media Use 5 |
|
2.54 |
1.06 |
|
|
T1PSMU6: Time 1 Problematic Social Media Use 6 |
|
2.31 |
0.99 |
|
Conflict/functional impairment |
T2PSMU6: Time 2 Problematic Social Media Use 6 |
. . . used social media so much that it has had a negative impact on your job/studies? |
2.47 |
1.00 |
|
|
T3PSMU6: Time 3 Problematic Social Media Use 6 |
|
2.57 |
1.03 |
|
|
|
Problematic Online Video Watching Scale |
|
|
|
|
T1POVW1: Time 1 Problematic Online Video Use 1 |
|
3.24 |
0.93 |
|
Salience |
T2POVW1: Time 2 Problematic Online Video Use 1 |
. . . spent a lot of time thinking about online videos or planned watching of online videos? |
3.41 |
0.93 |
|
|
T3POVW1: Time 3 Problematic Online Video Use 1 |
|
3.50 |
0.89 |
|
|
T1POVW2: Time 1 Problematic Online Video Use 2 |
|
2.98 |
0.96 |
|
Craving/tolerance |
T2POVW2: Time 2 Problematic Online Video Use 2 |
. . . felt an urge to watch online videos more and more? |
3.16 |
0.94 |
|
|
T3POVW2: Time 3 Problematic Online Video Use 2 |
|
3.27 |
0.92 |
|
|
T1POVW3: Time 1 Problematic Online Video Use 3 |
|
2.48 |
1.01 |
|
Mood modification |
T2POVW3: Time 2 Problematic Online Video Use 3 |
. . . watched online videos to forget about personal problems? |
2.70 |
0.97 |
|
|
T3POVW3: Time 3 Problematic Online Video Use 3 |
|
2.89 |
0.97 |
|
|
T1POVW4: Time 1 Problematic Online Video Use 4 |
|
2.58 |
1.08 |
|
Relapse/loss of control |
T2POVW4: Time 2 Problematic Online Video Use 4 |
. . . tried to cut down on watching online videos without success? |
2.76 |
0.98 |
|
|
T3POVW4: Time 3 Problematic Online Video Use 4 |
|
2.85 |
0.98 |
|
|
T1POVW5: Time 1 Problematic Online Video Use 5 |
|
2.08 |
1.03 |
|
Withdrawal |
T2POVW5: Time 2 Problematic Online Video Use 5 |
. . . become restless or troubled if you have been prohibited from watching online videos? |
2.29 |
1.03 |
|
|
T3POVW5: Time 3 Problematic Online Video Use 5 |
|
2.37 |
1.01 |
|
|
T1POVW6: Time 1 Problematic Online Video Use 6 |
|
2.34 |
0.98 |
|
Conflict/functional impairment |
T2POVW6: Time 2 Problematic Online Video Use 6 |
. . . watched online videos so much that it has had a negative impact on your job/studies? |
2.61 |
1.02 |
|
|
T3POVW6: Time 3 Problematic Online Video Use 6 |
|
2.78 |
1.03 |
|
Note. N = 685 for each time point. The components of the PSMU and POVW items were obtained from Andreassen et al. (2016); the components of the DASS-21 items were obtained from Van den Bergh et al. (2021). |
||||
Data analysis
The present study conducted all analyses, including cross-lagged network analysis, using R v4.2.2. The R packages: bootnet v1.6 (Epskamp et al., 2018), networktools v1.6.0 (Jones, 2025), and glmnet v4.1.8 (Friedman et al., 2010) were used for estimating network models, while qgraph v1.9.8 (Epskamp et al., 2012) was used for visualizing these models. The tidyverse v2.0.0 (Wickham et al., 2019) was also used for data analysis.
Cross-Sectional Data Network Modelling
To begin with, and because all variables were considered continuous, the network model was constructed using the undirected Gaussian Graphical Model (GGM) within pairwise Markov random fields (PMRFs). To ensure the model remained both parsimonious and sparse, the least absolute shrinkage and selection operator (LASSO) regularization and extended Bayesian information criterion (EBIC) were utilized for model selection (hyper tuning parameter = 0.5). Each of the three models comprised the same 33 nodes but included 229,211, and 228 edges, respectively. The centrality indices of strength, closeness, and betweenness were calculated to assess the influence of individual nodes within the network.
Centrality indices help determine the position and role of nodes within the network. Strength refers to the number of direct connections a node has, with a higher standardized strength value indicating more direct links to other nodes. Closeness measures the inverse of the total shortest distance from one node to all others, where a higher standardized closeness value indicates that the node can reach all other nodes more swiftly. Betweenness reflects how often a node lies on the shortest path between any two other nodes, with a higher standardized betweenness value indicating greater activity or influence between other nodes. Bridge strength and bridge expectedInfluence indicate the number and strength of a node’s connections to nodes in other clusters, bridge closeness indicates how easily a node can reach all nodes in other clusters, and bridge betweenness indicates how often a node appears on the shortest paths between different clusters (Isvoranu et al., 2022).
Cross-Lagged Panel Networks Models
When constructing cross-lagged panel network (CLPN) models, model building was separately conducted for T1→T2 and T2→T3. This approach controlled for the autoregressive effect of each node while accounting for associations both within and across time points. It estimates the influence of a single node at one time point on all other nodes at the subsequent time point, allowing for the exploration of symptom prediction pathways within the comorbidity networks of specific PIU and psychological distress, T1, T2, and T3. To identify the best model, a simulation study compared the performance of regularization parameter selection in the network model, finding that cross-validation displayed high sensitivity and low specificity across various conditions (Wysocki & Rhemtulla, 2021). Consequently, LASSO with 10-fold cross-validation tuning parameter selection was used to regularize the regression coefficients.
The CLPN model was used for the following reasons: (i) symptom-level focus: longitudinal associations between specific PIU and psychological distress were analyzed at the individual symptom level. Unlike traditional latent variable-based structural equation models (e.g., panel-LVGVAR), CLPN avoids assuming unobserved constructs, enabling granular tracking of symptom dynamics (Epskamp, 2020); (ii) symptom-level measurement: The tools used assessed symptoms through continuous single-item scores, aligning with CLPN’s framework. Each item represents an elemental node in a dynamic network, consistent with the network analysis perspective of focusing on symptom interactions; (iii) non-stationary data compatibility: CLPN accommodates temporal heterogeneity. The present study’s data show shifting dynamics. More specifically, PIU symptoms dominate early (T1 to T2), while emotional distress drives later changes (T2 to T3), mirroring the I-PACE model’s progression. Panel-LVGVAR requires stationarity and measurement invariance, which the evolving data in the present study violate; (iv) network centrality insights: CLPN quantifies in- and out-expected influence, pinpointing intervention targets. Panel-LVGVAR focuses on latent constructs, lacking this symptom-level precision; and (v) validation in similar contexts: CLPN has proven effective in modeling symptom-level pathways and comorbidity evolution (e.g., Funkhouser et al., 2020; Jia et al., 2024), directly addressing the present study’s research aims. In summary, CLPN’s symptom-level granularity, flexibility for non-stationary data, and alignment with the present study’s design and theory make it the optimal choice.
Centrality Estimation
Because cross-lagged networks are directed, unlike the undirected models used in cross-sectional data network modelling, expected influence (EI) is employed to estimate centrality in the network. In directed networks, EI is categorized into out-expected influence (out-EI) and in-expected influence (in-EI), indicating a node's ability to predict other nodes and its capacity to be predicted by other nodes within the network.
Stability Estimation
The stability and accuracy of edge estimates in the network model were evaluated using a bootstrapping method. First, non-parametric bootstrapped confidence intervals (CIs) were calculated for edge weights to assess their accuracy. Then, case-dropping subset bootstrapping was conducted to evaluate the stability of centrality indices, resulting in correlation stability (CS) coefficients. These coefficients indicate the degree to which a large proportion (ideally at least 50%) of cases (for 95%) can be removed while maintaining a correlation of at least 0.70 between centrality measures in the full sample and the case-dropping subsets (Isvoranu et al., 2022, p.139).
Ethics
The present study was approved by the Ethics Committee of the first author’s university. All procedures adhered to the ethical standards outlined in the Declaration of Helsinki. Written informed consent was obtained from each individual before their participation commenced. The study was not pre-registered and the data are available from the corresponding author upon reasonable request.
Results
Cross-Sectional Data Network Model
Descriptive Statistics
Table 2 provides the descriptive statistics and abbreviations for each node, while Figure 1 illustrates the comorbidity network model across the three time points. Each node in the network represents items from various scales. The weights matrix is provided in Supplementary Material S1. Symptoms/items related to POVW, PSMU, stress, anxiety, and depression were organized into distinct clusters within the network plot. All variables in the three waves were normally distributed (see the descriptive statistics in S2).
Figure 1. Cross-Sectional Data Network Models at Three Time Point.
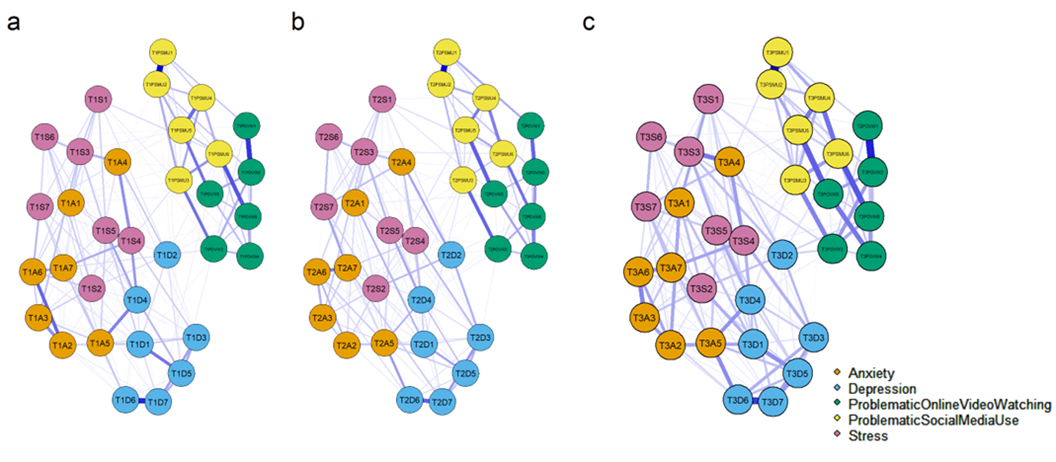
Note. a, T1 time point; b, T2 time point; c, T3 time point. Blue lines represent positive connections, and red lines represent negative connections.
Potential item overlap between PSMU and POVW was evaluated using the ‘goldbricker’ function in R package networktools (threshold = 0.75 as default). For the three waves of data, the analysis did not detect suggested reductions between PSMU and POVW items. Only items within PSMU or POVW were shown in the ‘goldbricker’ results of ‘suggested reductions’ (see S3). Item correlations were also calculated as shown in S4. Most of the correlation coefficients between PSMU and POVW items were low (<0.50).
Attrition analyses did not show any significant differences between participants who dropped out (16.7%) and those who took part in all three surveys when considering all the variables: PSMU: t(820) = −0.25, p = .801; POVW: t(820) = −1.60, p = .110; psychological distress: total score: t(820) = 1.21, p = .226; stress: t(820) = 1.00, p = .319; depression: t(820) = 1.24, p = .214; and anxiety: t(820) = 1.05, p = .295.
Centrality Estimation
The centrality estimation for the cross-sectional data network model includes ‘strength’, ‘closeness’, and ‘betweenness’, as displayed in Figure 2. At T1, the three symptoms with the highest strength values were ‘down-hearted’ from depression (D4, standardized coefficient [SC] = 1.91), ‘agitated’ from stress (S4, SC = 1.64), and ‘heart aware’ from anxiety (A6, SC = 1.35). Additionally, problematic internet use symptoms ‘craving/tolerance’ (PSMU2, SC = 0.88) and ‘conflict/functional impairment’ from PSMU (PSMU6, SC = 0.87), along with ‘craving/tolerance’ from POVW (POVW2, SC = 0.88), were among the top ten ranked symptoms.
Figure 2. Standardized Centrality Indices for the Cross-Sectional
Data Network Model Across Three Time Point.
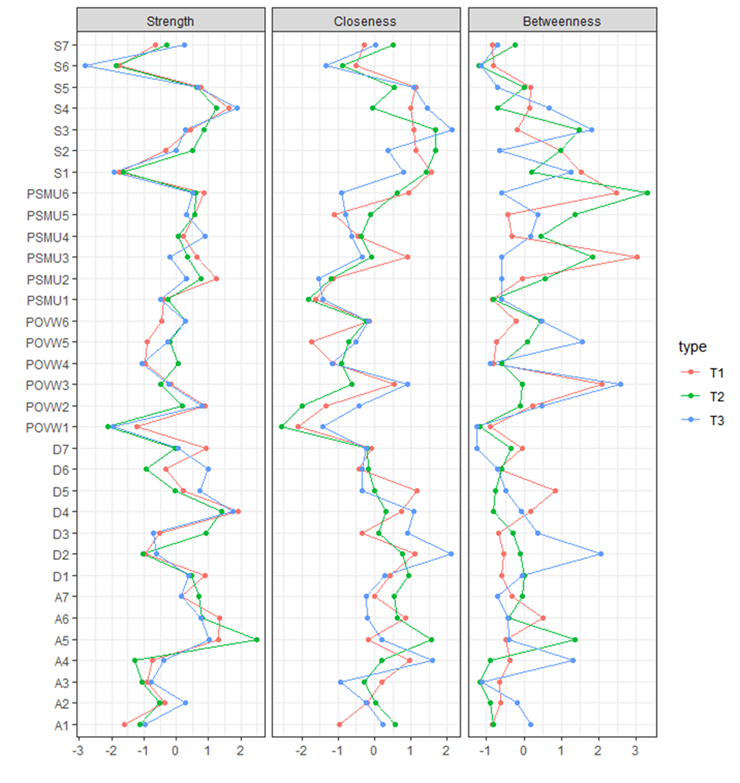
At T2, the symptoms with the highest strength were ‘panic’ from anxiety (A5, SC = 2.48), ‘down-hearted’ from depression (D2, SC = 1.41), and ‘agitated’ from stress (S4, SC = 1.25). The symptoms PSMU2 (SC = 0.78) and PSMU6 (SC = 0.60), which appeared in the top ten at T1, were also present at T2. At T3, the top three symptoms in terms of strength were the ‘agitated’ from Stress (S4, SC = 1.88), ‘down-hearted’ from depression (D4, SC = 1.75), and ‘panic’ from ‘anxiety’ (A5, SC = 1.01). Among the top ten PIU symptoms at T3, some were the same as at T1: PSMU4 (SC = 0.89), POVW2 (SC = 0.80), and PSMU6 (SC = 0.50).
The strength results indicate that in the network models at all three time points, the symptoms most central, or most interconnected with other symptoms, were those associated with depression, anxiety, and stress. The ‘down-hearted’ symptom from depression and the ‘agitated’ symptom from stress consistently ranked among the top three at all three time points, suggesting that these two symptoms may be consistently central within the comorbidity network of PSMU, POVW, and psychological distress, meaning they are the most connected to other symptoms.
In the results of closeness, the PSMU6 symptom ‘conflict/functional impairment’ appeared among the top ten in the network model at T1 (SC = 0.95) and T2 (SC = 0.64). Additionally, the ‘no wind down’ symptom (S1) and ‘overreactive’ symptom (S2) in stress were among the top five in closeness at T1 (SC = 1.58 and 1.13) and T2 (SC = 1.42 and 1.70). The ‘nervous energy’ symptom (S3) in stress appeared in the top five at T2 (SC = 1.67) and T3 (SC = 2.14). The ‘no initiative’ symptom (D2) in depression appeared in the top five at T1 (SC = 1.12) and T3 (SC = 2.12). This indicates that these symptoms of stress and depression connect more quickly to other symptoms, suggesting that they may play a significant role in connecting and influencing other symptoms within the network model.
With regards to betweenness, the ‘mood modification’ symptom (PSMU3) and ‘conflict/functional impairment’ symptom (PSMU6) in PSMU had a significant impact at T1 (SC = 3.00 and 2.47) and T2 (SC = 1.83 and 3.30). At T3, the most impactful symptoms were the ‘mood modification’ symptom (POVW3) in POVW and the ‘no initiative’ symptom (D2) in depression. This suggests that these symptoms, especially ‘mood modification’, frequently appear on the pathways linking other symptoms, indicating that this symptom is a key factor in the pathways connecting other symptoms.
Bridge Centrality Estimation
To identify bridge symptoms within the comorbidity network, all items were divided into two clusters: ‘problematic internet use’ (including PSMU and POVW) and ‘psychological distress’ (anxiety, depression, and stress; Figures 3,4 and 5). The results suggested that the ‘conflict/functional impairment’ (PSMU6) and ‘mood modification’ (PSMU3) symptoms in PSMU may play a crucial role in connecting the comorbidity network to the specific PIU cluster. Similar results were found for these symptoms in POVW (with high bridge strength and bridge betweenness values at T1 and T2, see Supplementary material). Additionally, the ‘no wind down’ (S1) and ‘overreactive’ (S2) symptoms in stress played a significant role in linking the specific PIU cluster (with higher bridge closeness values across all three time points), indicating that these nodes facilitate easier access to all symptom nodes in the specific PIU cluster.
Figure 3. Standardized Centrality Indices for the Cross-Sectional Data Network Model of Time 1.
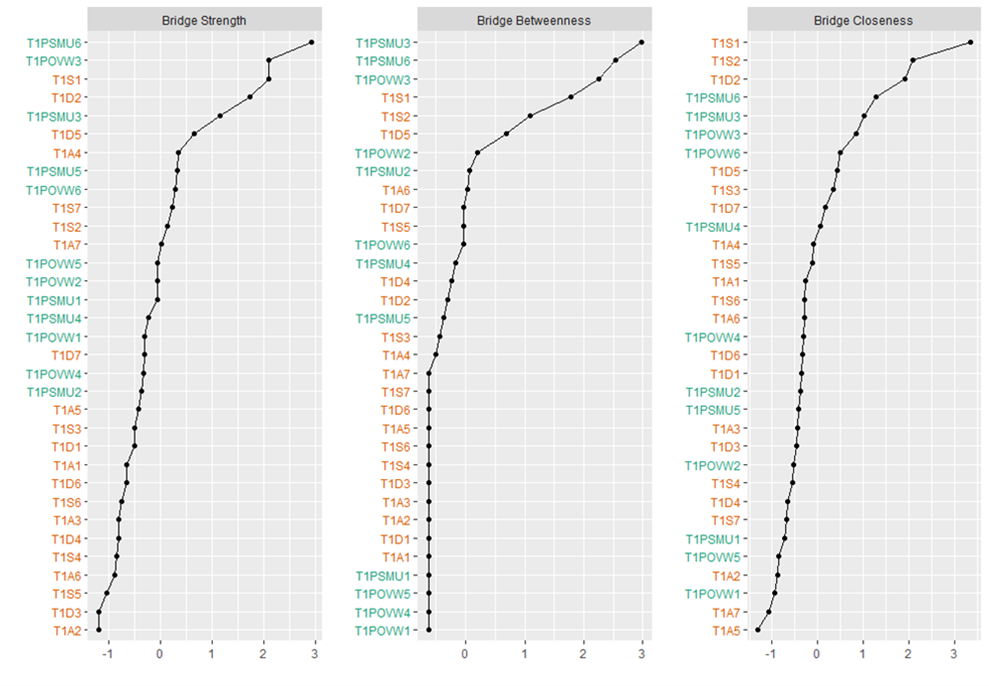
Figure 4. Standardized Centrality Indices for the Cross-Sectional Data Network Model of Time 2.
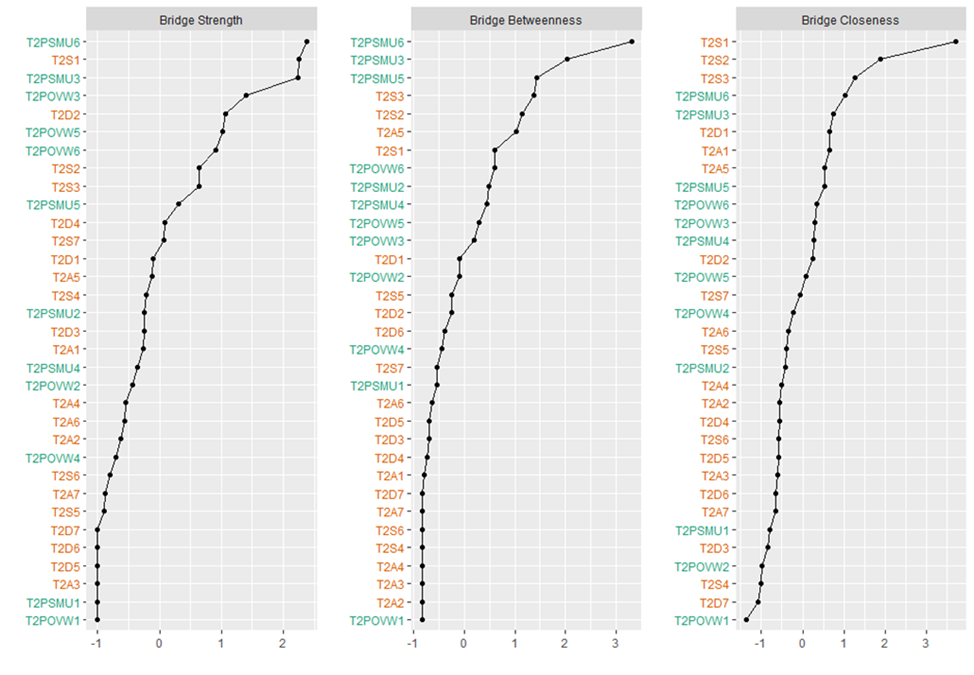
Figure 5. Standardized Centrality Indices for the Cross-Sectional Data Network Model of Time 3.
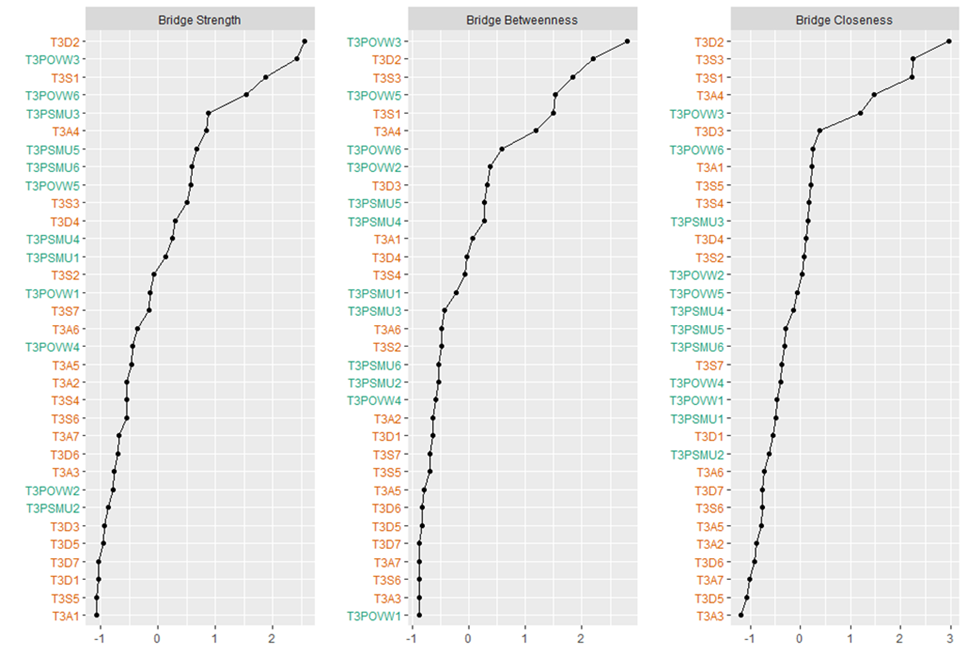
Accuracy and Stability Estimations
Supplementary Material S5 show the bootstrapped confidence intervals (CIs) for edge weights at T1, T2, and T3, with red indicating edge weight values and grey representing 95% CIs. The stability results for the three time points were as follows: T1 betweenness CS (cor = 0.7; a correlation of at least 0.7 between the original and bootstrapped samples) = 0.05, closeness CS (cor = 0.7) = 0.128, strength CS (cor = 0.7) = 0.594; T2 betweenness CS (cor = 0.7) = 0, closeness CS (cor = 0.7) = 0.128, strength CS (cor = 0.7) = 0.672; T3 betweenness CS (cor = 0.7) = 0.128, closeness CS (cor = 0.7) = 0.206, strength CS (cor = 0.7) = 0.672 (Supplementary material S6). Apart from the poor stability of betweenness, the network's strength demonstrated acceptable stability. Bootstrapped difference tests (α = .05) between node strength are shown in S7.
Network Comparison Tests Between Genders
NCTs were conducted between females and males at the three time points. Network invariance tests show that there was no significant difference in network structure between genders at T1 (test statistic M = 0.18, p = .800), T2 (test statistic M = 0.20, p = .485), and T3 (test statistic M = 0.18, p = .766). Moreover, global strength invariance tests showed that there was no significant difference in node strength between genders at T1 (test statistic S = 0.51, p = .373), T2 (test statistic S = 0.10, p = .766), and T3 (test statistic S = 0.12, p = .754)
Cross-Lagged Panel Network Model
Network Structure Estimation
The symptom networks from T1→T2 and T2→T3 were estimated using cross-lagged network models (see Figure 6). Blue arrows in the figure indicate positive predictions, while red arrows indicate negative predictions, with autoregressive effects removed. The T1→T2 cross-lagged network contained 33 nodes and 133 non-zero edges, with a mean weight of 0.005. Similarly, the T2→T3 network also contained 33 nodes, but with 152 non-zero edges and the same mean weight of 0.005.
Figure 6. Cross-Lagged Network Models.
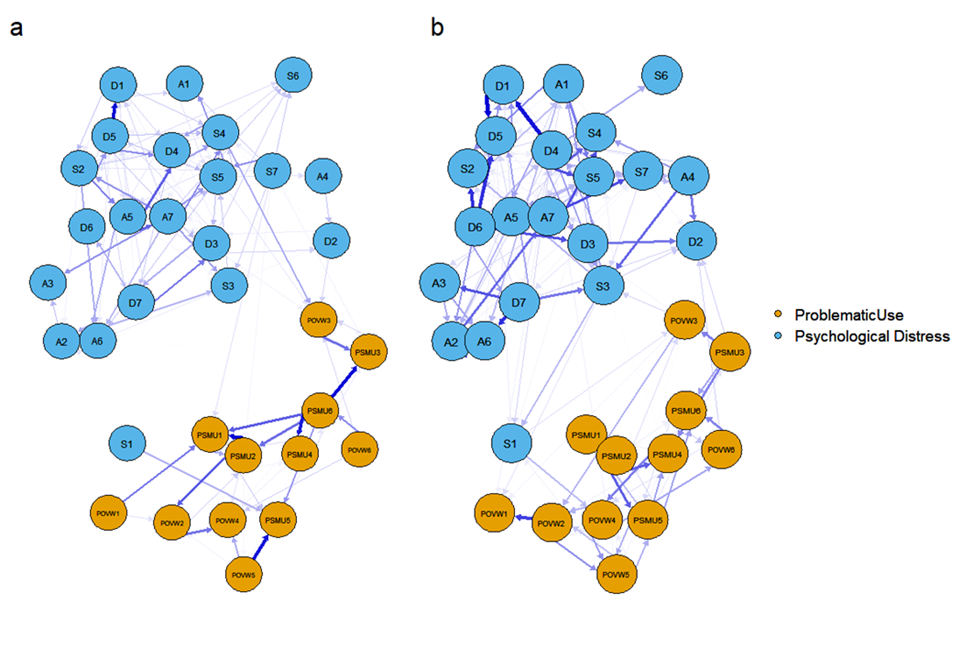 Note. a) symptom networks from T1→T2; b) symptom networks from T2→T3.
Centrality Estimation
Centrality estimates for the cross-lagged networks are shown in Figure 7 and Table 3. During the T1→T2 period, the top three symptoms for in-expected influence (in-EI) were ‘salience’ (PSMU1, SC = 2.12) and ‘withdrawal’ (PSMU5, SC = 1.49) symptoms from PSMU, and the ‘down-hearted’ symptom (D4) from depression. For out-expected influence (out-EI), the top three symptoms were ‘conflict/functional impairment’ symptom (PSMU6, SC = 2.80) from PSMU, the ‘scared’ symptom (A7, SC = 2.34) from anxiety, and the ‘not enthusiastic’ symptom (D5, SC = 1.93) from depression. During the T2→T3 period, the top three symptoms for in-EI were the ‘not enthusiastic’ symptom (D5, SC = 2.04) from depression, the ‘agitated’ symptom (S4, SC = 1.67) from stress, and the ‘heart aware’ symptom (A6, SC = 1.45) from anxiety. For out-EI, the top three symptoms were the ‘down-hearted’ (D4, SC = 3.39), ‘worthless person’ (D6, SC = 2.58), and ‘meaningless of life’ (D7, SC = 1.52) symptoms from depression. The high out-EI and in-EI suggest that these symptoms are central in predicting other symptoms at the next time point and are also key in being predicted by other symptoms.
Figure 7. Standardized Centrality Indices for the Cross-Lagged Network Models.
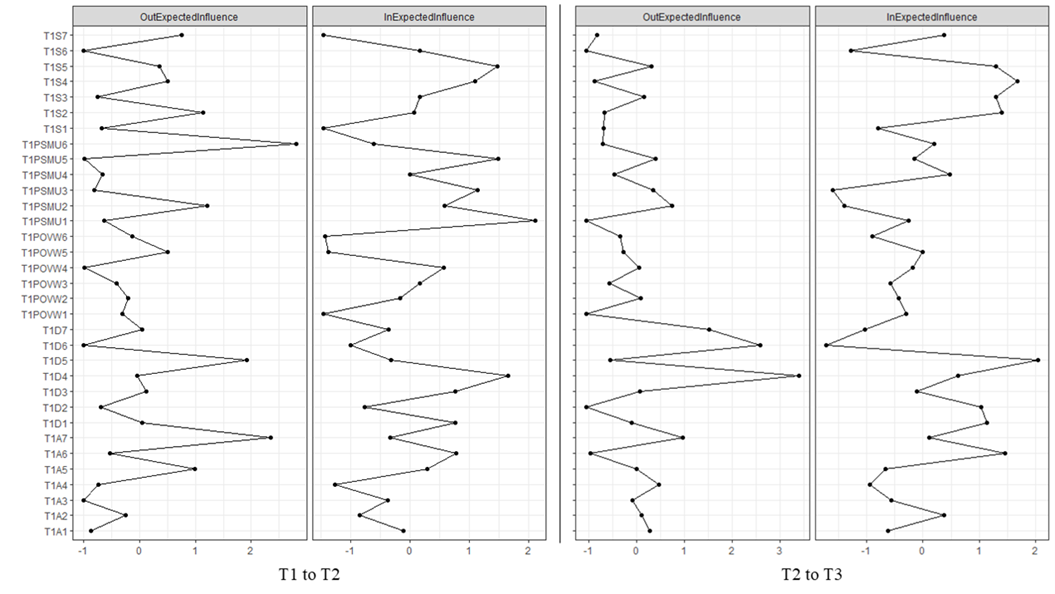
Table 3. Standardized Centrality Indices for the Cross-Lagged Network Model.
|
Node |
T1→T2 |
T2→T3 |
||
|
|
Standardized in-EI |
Standardized out-EI |
Standardized out-EI |
Standardized in-EI |
|
A1 |
−0.12 |
−0.87 |
0.27 |
−0.62 |
|
A2 |
−0.85 |
−0.25 |
0.10 |
0.38 |
|
A3 |
−0.37 |
−1.00 |
−0.09 |
−0.56 |
|
A4 |
−1.26 |
−0.74 |
0.47 |
−0.93 |
|
A5 |
0.29 |
0.98 |
0.00 |
−0.67 |
|
A6 |
0.78 |
−0.53 |
−0.96 |
1.45 |
|
A7 |
−0.33 |
2.34 |
0.97 |
0.11 |
|
D1 |
0.77 |
0.05 |
−0.11 |
1.13 |
|
D2 |
−0.77 |
−0.70 |
−1.06 |
1.03 |
|
D3 |
0.77 |
0.12 |
0.06 |
−0.11 |
|
D4 |
1.66 |
−0.05 |
3.39 |
0.62 |
|
D5 |
−0.31 |
1.93 |
−0.56 |
2.04 |
|
D6 |
−1.00 |
−1.00 |
2.58 |
−1.72 |
|
D7 |
−0.36 |
0.05 |
1.52 |
−1.03 |
|
PSMU1 |
2.12 |
−0.64 |
−1.06 |
−0.25 |
|
PSMU2 |
0.59 |
1.21 |
0.74 |
−1.39 |
|
PSMU3 |
1.14 |
−0.81 |
0.34 |
−1.60 |
|
PSMU4 |
0.01 |
−0.66 |
−0.47 |
0.47 |
|
PSMU5 |
1.49 |
−1.00 |
0.39 |
−0.14 |
|
PSMU6 |
−0.62 |
2.80 |
−0.71 |
0.20 |
|
POVW1 |
−1.46 |
−0.31 |
−1.06 |
−0.29 |
|
POVW2 |
−0.16 |
−0.20 |
0.07 |
−0.43 |
|
POVW3 |
0.17 |
−0.41 |
−0.57 |
−0.57 |
|
POVW4 |
0.57 |
−0.99 |
0.04 |
−0.18 |
|
POVW5 |
−1.38 |
0.51 |
−0.28 |
0.00 |
|
POVW6 |
−1.44 |
−0.13 |
−0.35 |
−0.90 |
|
S1 |
−1.46 |
−0.67 |
−0.70 |
−0.80 |
|
S2 |
0.07 |
1.13 |
−0.67 |
1.40 |
|
S3 |
0.17 |
−0.76 |
0.16 |
1.30 |
|
S4 |
1.10 |
0.51 |
−0.88 |
1.67 |
|
S5 |
1.48 |
0.35 |
0.30 |
1.30 |
|
S6 |
0.17 |
−1.00 |
−1.06 |
−1.28 |
|
S7 |
−1.46 |
0.76 |
−0.82 |
0.37 |
Stability Analysis
The bootstrapping results for the edges in the T1→T2 and T2→T3 periods (bootstrapped samples = 1,500) are shown in Supplementary material S8, indicating that some edges may have lower accuracy. The results from case-dropping subset bootstrapping (bootstrapped samples = 1,000) for centrality stability show that in the T1→T2 network model, both in-EI and out-EI had CS (cor = 0.7) = 0.128. In the T2→T3 period, the CS (cor = 0.7) for in-EI and out-EI were 0 and 0.439, respectively.
Discussion
Summary of the Results
The present study investigated how specific types of PIU and psychological distress interact over time through longitudinal comorbidity network models. The depression and stress symptoms, ‘down-hearted’ (D4) and ‘agitated’ (S4), were consistently the most central symptoms from T1 to T3. PSMU symptoms ‘mood modification’ and ‘conflict/functional impairment’ were the key bridging symptoms in the network in T1 and T2, while the depression symptom ‘no initiative’ (D2) became the key bridging symptom in T3. In the CLPN models, the specific PIU symptoms were the most influential and susceptible nodes from T1 to T2, while the psychological distress symptoms became the major issues from T2 to T3.
Relationship With Previous Findings and Implications
The findings indicate the important role of depression (e.g., D4) and stress (e.g., S4) issues in the comorbidity network of specific types of PIU and psychological distress symptoms. The symptom 'down-heartedness' was assessed using the item I felt down-hearted and blue from the DASS-21. Although not explicitly labeled in the DSM-5, this symptom is included as a diagnostic criterion for depression in many widely used clinical screening tools, such as the Center for Epidemiologic Studies Depression Scale (CES-D; Radloff, 1977) and the Hospital Anxiety and Depression Scale (HADS; Zigmond & Snaith, 1983). The clinical significance of this symptom suggests that mental health professionals should pay attention to individuals' down-hearted feelings or expressions associated with their specific PIU. Theories and empirical studies have identified the relationship between PIU and poor mental health (Brand et al., 2019; Hussain et al., 2020; Lopes et al., 2022). The present study deepens the understanding of such relationship at symptom level, which might be helpful for potential preventions to target more specific symptoms.
Wang et al. (2022) found that the depression symptom of ‘lack of enthusiasm’ was the central symptom in the comorbidity network of PSMU, anxiety, and depression. They asserted that depression plays an important role in influencing an individual’s PSMU. Similarly, the present study also identified that depression (down-hearted) and stress (‘agitated’) symptoms are the central symptoms over time. This again suggests that psychological distress symptoms are the core problems in the comorbidity mechanism of specific types of PIU and poor mental health.
However, different from the present study, a cross-sectional study by Cai et al. (2021) reported that the most central symptoms in the PIU-anxiety network were the PIU symptoms such as ‘affected academic performance’, ‘social conflict’, and ‘mood modification’. Tullett-Prado et al. (2023) also found that the PSMU symptoms ‘tolerance’ and ‘mood-modification’ were the most central symptoms in the PSMU- psychological distress network models over time. Such different results might be attributed to variations in node representations (e.g., specific symptoms versus total scores) or differences in the social-demographic backgrounds of the samples. Future studies could explore the specific PIU-psychological distress network across different age groups or cultural contexts, analyzing both symptom-level and total score-level interactions.
Another longitudinal network analysis study indicated that both PIU symptoms (‘escape’ and ‘irritability’) and depression symptoms (‘low energy’ and ‘guilt’) were the most central or most connected symptoms within the PIU-depression comorbidity network over time (Zhao et al., 2023). However, it should be noted that these studies examined different types of PIU, such as generalized PIU (Cai et al., 2021; Zhao et al., 2023) and PSMU (Tullett-Prado et al., 2023; Wang et al., 2022), which could lead to different results. Additionally, some did not focus on specific symptoms of anxiety or depression but used the total scores (e.g., DASS-21; Tullett-Prado et al., 2023), which might not allow for the detection of potential central symptoms in the psychological distress variables. Therefore, the central symptoms in the PIU-psychological distress comorbidity network could be different depending on the research focus and data analysis approaches.
In terms of bridging symptoms, the present study found that the PSMU symptoms of ‘mood modification’ and ‘conflict/functional impairment’ were key bridging nodes that connect specific PIU and psychological distress symptoms, especially in T1 and T2. Similarly, Wang et al. (2022) also found that the symptom ‘conflict/functional impairment’ in PSMU was the key linking node with highest betweenness in the network of PSMU, anxiety, and depression. Based on these findings, it appears that ‘conflict/functional impairment’ is the key symptom that played an important role linking or mediating the symptoms between the two communities of specific PIU and psychological distress. This indicates that many symptoms between specific PIU and psychological distress may be connected through ‘conflict/functional impairment’ in PSMU. Such findings support the inclusion of the term ‘functional impairment’ within the concepts of PSMU and PIU (Billieux et al., 2017). On the other hand, the present study found that bridging symptoms might change over time, and that the depression symptom ‘no initiative’ (D2) became the key bridging symptom in T3. Zhao et al. (2023) reported that the key bridging symptoms in the PIU-depression network were ‘guilty’ (Feeling bad about yourself, or that you are a failure or have let yourself or your family down) in depression and ‘escape’ in PIU over time. Therefore, either the specific PIU or psychological distress symptoms could be the key connecting node in different stages of the development of the comorbidity. Consequently, it is important to further explore the change of bridging symptoms over time with longitudinal designs.
The CLPN analysis in the present study showed that PIU symptoms were the most influential and susceptible symptoms from T1 to T2, while psychological symptoms become the dominant symptoms from T2 to T3. In the interval between T1 and T2, the PSMU symptom ‘conflict/functional impairment’ had the highest Out-EI, making it the most influential symptom that predicted the other symptoms subsequently. ‘Salience’ and ‘withdrawal’ in PSMU had the highest In-EI values, making them the most susceptible symptoms predicted by the other symptoms in earlier waves. This shows that PIU symptoms, especially those related to PSMU, were the key drivers that contribute to the development of the comorbidity network of PIU and psychological distress symptoms.
Such findings are similar to previous longitudinal studies using the CLPN approach, which identified that the PIU symptoms ‘time management’ and ‘tolerance’ were the most influential in the comorbidity network over time (Jia et al., 2024; Qu et al., 2024). Therefore, antecedent PIU symptoms might serve as the initial starting point in the comorbidity mechanism, which contributes to subsequent mental health risks. Moreover, the present study’s findings indicated that PSMU symptoms were the most susceptible symptoms from T1 to T2. This finding suggests a potential bidirectional relationship between PIU and psychological distress, as supported by earlier longitudinal studies (e.g., Marttila et al., 2021; Teng et al., 2021; W. Zhou et al., 2023). It is therefore important to focus on the problems associated with PIU, particularly the symptoms of ‘conflict/functional impairment’ and ‘tolerance’, when implementing prevention measures for psychological distress related to internet use. Moreover, the present study’s findings also indicated that PSMU symptoms (more than POVW symptoms) appear to play more important roles in the comorbidity.
Interestingly, the present study’s three waves of surveys identified that the influential and susceptible symptoms can change over time. Unlike the first interval (from T1 to T2), psychological distress symptoms (especially depression symptoms) were the most influential and susceptible from T2 to T3. In four waves of studies conducted from 2011 and 2012, Jia et al. (2024) reported that PIU symptoms were consistently the most influential ones in the network, and depression symptoms were consistently the most susceptible ones over time. The different results might be due to the length of intervals, the year of data collection and/or measurement instrument used to assess PIU. Nevertheless, the present study observed a shift in key influential and susceptible symptoms (from PIU to psychological distress), indicating that the comorbidity network can change over time. This suggests that mental health problems might become the primary drivers of PIU symptoms and outcomes of PIU in later stages of the comorbidity’s development.
Moreover, the impact of the COVID-19 pandemic should be considered when comparing the present study with Jia et al. (2024)’s study, which used data from over 10 years ago. The present study collected data during the COVID-19 pandemic, a period when participants’ psychological distress may have been influenced by pandemic-related stressors. The pandemic likely accelerated the adoption of digital technologies for essential activities, such as online learning. This shift may have contributed to increased screen time and reliance on the internet, potentially exacerbating specific PIU behaviors. However, Jia et al. (2024) collected data from 2011 to 2014, a timeframe that predates the pandemic. It is also unclear how environmental factors influenced their results during those four years.
From the perspectives of specific symptoms and longitudinal development, the present study contributes to the understanding of the bidirectional relationship between PIU and psychological distress, as proposed in some theoretical frameworks (e.g., Brand et al., 2019; Sonuga-Barke et al., 2024). Specific symptoms of PSMU, particularly ‘conflict/functional impairment’, play a significant role in the comorbidity of PIU and psychological distress. Furthermore, the key predictors and outcomes in this comorbidity mechanism might change over time because psychological distress could become the dominant variable in later stages. Such findings might further support the I-PACE theory, which proposed that compensation may become stronger over gratification in the later stages of the development of addictive behaviors (Brand et al., 2016, 2019). In later stages of comorbidity, the compensatory effect may become stronger due to psychological distress, which could contribute to the cycle of PIU and further distress.
The findings suggest several intervention and prevention strategies for addressing specific PIU and psychological distress. Given that ‘down-heartedness’ (a depressive symptom) and ‘agitation’ (an anxiety symptom) emerged as central nodes in the comorbidity network, interventions such as cognitive-behavioral therapy (CBT) should prioritize mitigating these symptoms to disrupt the broader interplay between distress and PIU. Additionally, the bridging role of the PSMU symptoms ‘mood modification’ and ‘conflict/functional impairment’ indicates the need to first address functional impairment associated with social media use (e.g., implementing time-management tools for social media engagement). Moreover, stage-specific approaches could enhance intervention efficacy. In early stages (where PSMU symptoms drive comorbidity), screening for symptoms such as ‘mood modification’ during the first term of being undergraduate students may help identify at-risk individuals. In later stages (where depressive symptoms dominate), interventions should prioritize treating depressive symptoms to disrupt the self-reinforcing cycle within the comorbidity.
Limitations and Future Directions
There are a number of limitations in the present study. The self-reported scores for specific PIU and psychological distress variables may be biased due to social desirability and memory recall. The present study did not include attention-check questions in the survey, which may be a limitation. The predictive relationships identified in the present study may not illustrate cognitive neural mechanisms underlying specific PIU and psychological distress. Future studies could employ experimental designs (e.g., event-related potential studies) to explore this further. Moreover, the cross-lagged methods might not establish causation, even though the findings suggest bidirectional temporal links between specific types of PIU and psychological distress. Future studies need to focus on the confounders not examined in the present study (e.g., personality traits, life stressors) that may contribute to the observed associations.
Moreover, the present study’s recruitment of university students may limit the generalizability of the results. Further studies could recruit more diverse samples with varying demographic characteristics, such as different ages or cultural backgrounds. The sample exhibited a gender imbalance, with females comprising 67.7% of all participants. This imbalance may limit the generalizability of the findings. Future studies should conduct studies with more balanced gender samples and explore gender-moderation effects. Moreover, the present study did not assess participants’ experience with or frequency of social media use and online video consumption. The assumption that all participants engaged in these activities is a potential limitation.
Another limitation might be the impact of the COVID-19 pandemic. Data collection occurred between 2021 and 2022, coinciding with pandemic-related public health measures including lockdowns, social distancing, and remote learning/work arrangements. While these contextual factors may have moderated relationships between specific PIU and mental health, it should be noted that the three survey waves neither captured the pandemic's initial phase nor its resolution period.
Only two specific PIU types were included in the present study. Therefore, future studies test additional PIU subtypes and mental health outcomes using longitudinal network analysis. Finally, the present study only included depression, anxiety, and stress as the psychological distress variables, which might ignore the other potential mental health risks. Future studies could include additional types of psychological factors or disorders such as low self-esteem, obsessive-compulsive disorder, and bipolar disorder.
Conclusion
The present study found that the psychological distress symptoms (’down-heartedness’ and ‘agitation’) were consistently the most central symptoms in the PIU-psychological distress comorbidity network. The PSMU symptoms of ‘mood modification’ and ‘conflict/functional impairment’ were consistently the key bridging symptoms between the other symptoms. The CLPN analysis showed that the comorbidity mechanism of specific PIU and psychological distress can change over time. In earlier stages, PSMU symptoms may be the main predictors and outcomes in this seemingly bidirectional relationship. In later stages, psychological distress symptoms, especially depressive symptoms, become the most influential and susceptible symptoms. The present study explored the comorbidity of specific PIU and psychological distress, identifying the dynamic development of this bidirectional relationship over time at the symptom level. Preventions could target central psychological distress symptoms and bridging PSMU symptoms through stage-specific approaches.
Conflict of Interest
The authors have no conflicts of interest to declare.
Use Of AI Services
The authors declare they have not used any AI services to generate or edit any part of the manuscript or data.
Acknowledgement
Funding Sources
The present study was funded by the National Social Science Fund of China under grant number 22CSH077; Social Science Youth Foundation of Jiangsu Province under grant number 21XWC005.
Ethics
This study has been approved by the Ethics Committee of the School of Education at Soochow University.

This work is licensed under a Creative Commons Attribution-ShareAlike 4.0 International License.
Copyright © 2025 Wenting Xu, Zeyang Yang, Zhihao Yan, Yuanli Liu, Mark Griffiths