
Bridging the digital divide: How smartphones are associated with physical, psychological, and social well-being in marginalized groups
Vol.20,No.4(2026)
Ilenia Gasparini
 Marco Marinucci
Luca Pancani
Paolo Riva
Marco Marinucci
Luca Pancani
Paolo Riva
This paper examines the digital divide by investigating how smartphone use and digital exclusion are associated with the physical, psychological, and social well-being of marginalized populations—including migrants, people experiencing homelessness, and prisoners—across five correlational studies (total N = 817). The findings reveal both benefits (e.g., fostering integration and connection) and drawbacks (e.g., exacerbating psychological challenges) of smartphone use. Study 1 explored smartphone usage among migrants (N = 278), showing that information-seeking apps (e.g., location services) were positively associated with psychological need satisfaction, physical health, and adaptation, whereas communication apps were not significantly associated with any of the outcome variables. Studies 2a (N = 75) and 2b (N = 174) focused on migrants during their migration journeys. In Study 2a, smartphone use for communication was positively associated with adaptation. In contrast, using smartphones for emotional regulation was linked to poorer psychological well-being in both studies. Study 3 investigated smartphone use among people experiencing homelessness (N = 71), revealing that communication was positively associated with psychological health, whereas use for emotional regulation was tied to lower psychological well-being. Finally, Study 4 examined prisoners (N = 219), linking limited technological skills to poorer physical and psychological well-being, while lack of access alone was not significantly associated with these outcomes. Overall, the results point to meaningful links between smartphone use and experiences of integration and connection among marginalized groups, as well as to poorer psychological well-being associated with using smartphones for emotion regulation and to the adverse effects of digital exclusion.
smartphones; digital exclusion; social exclusion; well-being; marginalized groups
Ilenia Gasparini
University of Milano-Bicocca, Milan
Ilenia Gasparini is a research assistant and a member of the Social Connections & Technology Lab (ConnectLAB). Her research focuses on the social and psychological implications of digital technologies (e.g., smartphones, AI-based tools), with a particular interest in digital exclusion and marginalized groups.
Marco Marinucci
University of Milano-Bicocca, Milan
Marco Marinucci is a postdoctoral fellow in social psychology. His research focuses on the social exclusion of disadvantaged groups, including migrants, incarcerated individuals, and people experiencing homelessness. He examines how new technologies can be used both as research tools and as means to foster social inclusion and promote harmonious intergroup relations. His work explores the individual, social, and situational factors that influence the impact of persistent exclusion on marginalized minorities, as well as the conditions that reduce exclusionary behaviors and attitudes within advantaged majority groups.
Luca Pancani
University of Milano-Bicocca, Milan
Luca Pancani is Associate Professor of Social Psychology at the University of Milano-Bicocca. His primary research interest lies in understanding how digital technology influences interpersonal relationships, both by enabling social connection and contributing to experiences of social exclusion. In addition to this line of research, he is also interested in broader issues related to social exclusion and psychological well-being. Across these areas, Luca applies solid methodological expertise to both research design and data analysis.
Paolo Riva
University of Milano-Bicocca, Milan
Paolo Riva is an Associate Professor of Social Psychology at the University of Milano-Bicocca. His research examines the psychological and social consequences of exclusion, rejection, and isolation, as well as the impact of digital technologies on social relationships and well-being. He combines experimental, longitudinal, and field methods to investigate how people connect - or disconnect - in contemporary society.
Adkins, E. C., Zalta, A. K., Boley, R. A., Glover, A., Karnik, N. S., & Schueller, S. M. (2017). Exploring the potential of technology-based mental health services for homeless youth: A qualitative study. Psychological Services, 14(2), 238–245. https://doi.org/10.1037/ser0000120
Alencar, A. (2018). Refugee integration and social media: A local and experiential perspective. Information, Communication & Society, 21(11), 1588–1603. https://doi.org/10.1080/1369118x.2017.1340500
Aureli, N., Marinucci, M., & Riva, P. (2020). Can the chronic exclusion‐resignation link be broken? An analysis of support groups within prisons. Journal of Applied Social Psychology, 50(11), 638–650. https://doi.org/10.1111/jasp.12701
Bales, W. D., & Mears, D. P. (2008). Inmate social ties and the transition to society. Journal of Research in Crime and Delinquency, 45(3), 287–321. https://doi.org/10.1177/0022427808317574
Bastick, Z., & Mallet-Garcia, M. (2022). Double lockdown: The effects of digital exclusion on undocumented immigrants during the COVID-19 pandemic. New Media & Society, 24(2), 365–383. https://doi.org/10.1177/14614448211063185
Baum, F., Newman, L., & Biedrzycki, K. (2012). Vicious cycles: Digital technologies and determinants of health in Australia. Health Promotion International, 29(2), 349–360. https://doi.org/10.1093/heapro/das062
Baumeister, R. F., & Leary, M. R. (1995). The need to belong: Desire for interpersonal attachments as a fundamental human motivation. Psychological Bulletin, 117(3), 497–529. https://doi.org/10.1037/0033-2909.117.3.497
Beck, A. T., Weissman, A., Lester, D., & Trexler, L. (1974). The measurement of pessimism: The Hopelessness Scale. Journal of Consulting and Clinical Psychology, 42(6), 861–865. https://doi.org/10.1037/h0037562
Beck, A. T., Steer, R. A., & Brown, G. (1996). Beck depression inventory–II [Dataset]. PsycTESTS Dataset. https://doi.org/10.1037/t00742-000
Bennett, N. M. (2020). Essays on migration and immigration policy (Publication No. 27998975) [Doctoral dissertation, University of California]. Irvine ProQuest Dissertations & Theses. https://www.proquest.com/dissertations-theses/essays-on-migration-immigration-policy/docview/2430109866/se-2
Blomberg, M., Altschwager, D., Seo, H., Booton, E., & Nwachukwu, M. (2021). Digital divide and marginalized women during COVID-19: A study of women recently released from prison. Information, Communication & Society, 24(14), 2113–2132. https://doi.org/10.1080/1369118x.2021.1963462
Bourdieu, P. (1986). The forms of capital. In J. G. Richardson (Ed.), Handbook of theory and research for the sociology of education (pp. 241–258). Greenwood Press.
Bottesi, G., Ghisi, M., Altoè, G., Conforti, E., Melli, G., & Sica, C. (2015). The Italian version of the Depression Anxiety Stress Scales-21: Factor structure and psychometric properties on community and clinical samples. Comprehensive Psychiatry, 60, 170–181. https://doi.org/10.1016/j.comppsych.2015.04.005
Bretherton, J., & Pleace, N. (2023). Causation. In J. Bretherton & N. Pleace (Eds.), The Routledge handbook of homelessness (pp. 24–34). Routledge. https://doi.org/10.4324/9781351113113-4
Calo, R., & Rosenblat, A. (2017). The taking economy: Uber, information, and power. Columbia Law Review, 117(6), 1623–1690. https://www.columbialawreview.org/wp-content/uploads/2017/10/Calo-Rosenblat_The-Taking-Economy.pdf
Castells, M. (1996). The rise of the network society. Blackwell.
Chan, M. (2018). Digital communications and psychological well-being across the life span: Examining the intervening roles of social capital and civic engagement. Telematics and Informatics, 35(6), 1744–1754. https://doi.org/10.1016/j.tele.2018.05.003
Collier, P. (2008). The bottom billion: Why the poorest countries are failing and what can be done about it. Oxford University Press.
Correa-Velez, I., Spaaij, R., & Upham, S. (2013). “We are not here to claim better services than any other”: Social exclusion among men from refugee backgrounds in urban and regional Australia. Journal of Refugee Studies, 26(2), 163–186. https://doi.org/10.1093/jrs/fes003
Crandall, M., & Fisher, K. E. (Eds.). (2009). Digital inclusion: Measuring the impact of information and community technology. Information Today, Inc.
Derogatis, L. R., & Unger, R. (2010). Symptom checklist‐90‐revised. In I. B. Weiner & W. E. Craighead (Eds.), The Corsini encyclopedia of psychology (pp. 1–2). Wiley. https://doi.org/10.1002/9780470479216.corpsy0970
Dekker, R., & Engbersen, G. (2014). How social media transform migrant networks and facilitate migration. Global Networks, 14(4), 401–418. https://doi.org/10.1111/glob.12040
Dekker, R., Engbersen, G., Klaver, J., & Vonk, H. (2018). Smart refugees: How Syrian asylum migrants use social media information in migration decision-making. Social Media + Society, 4(1), Article 2056305118764439. https://doi.org/10.1177/2056305118764439
Emasealu, H. U., & Popoola, S. O. (2016). Information needs, accessibility and utilization of library information resources as determinants of psychological well-being of prison inmates in Nigeria. Brazilian Journal of Information Studies, 10(2), 29–46. https://doi.org/10.22478/ufpb.1981-0695.2017v12n1.34588
European Commission: Directorate-general for employment, social affairs and inclusion. (2010). Joint report on social protection and social inclusion 2009 – Social inclusion, pensions, healthcare and long-term care: Summary. Publications Office. https://data.europa.eu/doi/10.2767/37533
Faith, B. (2018). Maintenance affordances and structural inequalities: Mobile phone use by low income women in the United Kingdom. Information Technologies and International Development, 14(Special Section), 66–80. https://hdl.handle.net/20.500.12413/13725
Farley, H., & Hopkins, S. (2017). The prison is another country: Incarcerated students and (im)mobility in Australian prisons. Critical Studies in Education, 58(2), 150–167. https://doi.org/10.1080/17508487.2016.1255240
Finotto, C. A. (2018, August 18). Migranti, come lo smartphone aiuta ad affrontare i viaggi della speranza [Migrants: How smartphones help them face journeys of hope]. Il Sole 24 Ore. https://www.ilsole24ore.com/art/migranti-come-smartphone-aiuta-ad-affrontare-viaggi-speranza-AEhS2oXF
Fondo per la Repubblica Digitale. (2024). Digitale e detenuti: Firmato il protocollo tra il Fondo e il DAP [Digital and prisoners: Memorandum of understanding signed between the Fund and the DAP]. https://www.fondorepubblicadigitale.it/digitale-e-detenuti-firmato-il-protocollo-tra-il-fondo-e-il-dap/
Galperin, H., Bar, F., & Nguyen, H. (2021). The power divide: Mobile communication in Los Angeles’ Skid Row. Mobile Media & Communication, 9(1), 30–50. https://doi.org/10.1177/2050157920932608
Gillespie, M., Osseiran, S., & Cheesman, M. (2018). Syrian refugees and the digital passage to Europe: Smartphone infrastructures and affordances. Social Media + Society, 4(1), Article 2056305118764440. https://doi.org/10.1177/2056305118764440
Goedhart, N. S., Broerse, J. E., Kattouw, R., & Dedding, C. (2019). ‘Just having a computer doesn’t make sense’: The digital divide from the perspective of mothers with a low socio-economic position. New Media & Society, 21(11–12), 2347–2365. https://doi.org/10.1177/1461444819846059
Gonzales, A. L., Ems, L., & Suri, V. R. (2016). Cell phone disconnection disrupts access to healthcare and health resources: A technology maintenance perspective. New Media & Society, 18(8), 1422–1438. https://doi.org/10.1177/1461444814558670
Grellhesl, M., & Punyanunt-Carter, N. M. (2012). Using the uses and gratifications theory to understand gratifications sought through text messaging practices of male and female undergraduate students. Computers in Human Behavior, 28(6), 2175–2181. https://doi.org/10.1016/j.chb.2012.06.024
Haché, A., & Joe, C. (2010). ICT and youth at risk: How ICT-driven initiatives can contribute to their socio-economic inclusion and how to measure it (JRC Research Reports No. JRC58427). Publications Office of the European Union. https://doi.org/10.2791/44210
Hales, A. H., Wood, N. R., & Williams, K. D. (2021). Navigating COVID-19: Insights from research on social ostracism. Group Processes & Intergroup Relations, 24(2), 306–310. https://doi.org/10.1177/1368430220981408
Helsper, E. J. (2017). The social relativity of digital exclusion: Applying relative deprivation theory to digital inequalities. Communication Theory, 27(3), 223–242. https://doi.org/10.1111/comt.12110
Hofinger, V., & Pflegerl, P. (2024). A reality check on the digitalisation of prisons: Assessing the opportunities and risks of providing digital technologies for prisoners. Punishment & Society, 26(5), 898–916. https://doi.org/10.1177/14624745241237190
Hwang, Y. I., Hagos, A., Withall, A., Hampton, S., Snoyman, P., & Butler, T. (2024). Population ageing, incarceration and the growing digital divide: Understanding the effects of digital literacy inequity experienced by older people leaving prison. PLoS ONE, 19(4), Article e0297482. https://doi.org/10.1371/journal.pone.0297482
Hunter, J. F., Hooker, E. D., Rohleder, N., & Pressman, S. D. (2018). The use of smartphones as a digital security blanket: The influence of phone use and availability on psychological and physiological responses to social exclusion. Psychosomatic Medicine, 80(4), 345–352. https://doi.org/10.1097/psy.0000000000000568
Imandeka, E., Putra, P. O. H., Hidayanto, A. N., & Mahmud, M. (2024). Exploring the world of smart prisons: barriers, trends, and sustainable solutions. Human Behavior and Emerging Technologies, 2024(1), Article 6158154. https://doi.org/10.1155/2024/6158154
Alam, K., & Imran, S. (2015). The digital divide and social inclusion among refugee migrants: A case in regional Australia. Information Technology & People, 28(2), 344–365. https://doi.org/10.1108/ITP-04-2014-0083
International Organization for Migration. (2023). Digital inclusion. https://www.iom.int/digital-inclusion
Jackson, L. A., Zhao, Y., Kolenic, A., Fitzgerald, H. E., Harold, R., & Von Eye, A. (2008). Race, gender, and information technology use: The new digital divide. Cyberpsychology, Behavior, and Social Networking, 11(4), 437–442. https://doi.org/10.1089/cpb.2007.0157
Jehoel-Gijsbers, G., & Vrooman, C. (2008). Social exclusion of the elderly: A comparative study of EU member states. SSRN Electronic Journal. https://doi.org/10.2139/ssrn.2027886
Jewkes, Y. (2008). The role of the Internet in the twenty-first-century prison: Insecure technologies in secure spaces. In K. F. Aas, H. Oppen Gundhus, & H. Mork Lomell (Eds.), Technologies of insecurity: The surveillance of everyday life (pp. 171–188). Taylor & Francis.
Johnson, R. (2013). Brave new prisons. In A. Liebling & S. Maruna (Eds.), The effects of imprisonment (pp. 255–284). Willan. https://doi.org/10.4324/9781843926030
Kardefelt-Winther, D. (2014). A conceptual and methodological critique of internet addiction research: Towards a model of compensatory internet use. Computers in Human Behavior, 31, 351–354. https://doi.org/10.1016/j.chb.2013.10.059
Kaufmann, K. (2018). Navigating a new life: Syrian refugees and their smartphones in Vienna. Information, Communication & Society, 21(6), 882–898. https://doi.org/10.1080/1369118X.2018.1437205
Keusch, F., Leonard, M. M., Sajons, C., & Steiner, S. (2021). Using smartphone technology for research on refugees: Evidence from Germany. Sociological Methods & Research, 50(4), 1863–1894. https://doi.org/10.1177/0049124119852377
Kushlev, K., & Leitao, M. R. (2020). The effects of smartphones on well-being: Theoretical integration and research agenda. Current Opinion in Psychology, 36, 77–82. https://doi.org/10.1016/j.copsyc.2020.05.001
Kushel, M. B., Gupta, R., Gee, L., & Haas, J. S. (2006). Housing instability and food insecurity as barriers to health care among low-income Americans. Journal of General Internal Medicine, 21(1), 71–77. https://doi.org/10.1111/j.1525-1497.2005.00278.x
Le Dantec, C. A., & Edwards, W. K. (2008). Designs on dignity: Perceptions of technology among the homeless. CHI '08: Proceedings of the SIGCHI Conference on Human Factors in Computing Systems, 627–636. https://doi.org/10.1145/1357054.1357155
Lee, R. M., & Robbins, S. B. (1995). Measuring belongingness: The Social Connectedness and the Social Assurance scales. Journal of Counseling Psychology, 42(2), 232–241. https://doi.org/10.1037/0022-0167.42.2.232
Leinen, S. (2017). Mobile lifestyles: The homeless and their cell phones (Publication No. 10254679) [Doctoral dissertation, Regent University]. Regent University ProQuest Dissertations & Theses. https://search.proquest.com/openview/2e5d05be24fcf54d043f6c69999167d7/1?pq-origsite=gscholar&cbl=18750&casa_token=YPmvmgjgtzIAAAAA:0RrTBl7B4uAEYQrIfVAbB8i1gK2HJXp0i3g6rfPLUBRn7U8bxwCm_3jRnxH1-j1qdiXCcxEQ8Lw
Leung, L. (2010). Telecommunications across borders: Refugees' technology use during displacement. Telecommunications Journal of Australia, 60(4), 58.1–58.13. https://doi.org/10.2104/tja10058
Lorenzana, J. A. (2016). Mediated recognition: The role of Facebook in identity and social formations of Filipino transnationals in Indian cities. New Media & Society, 18(10), 2189–2206. https://doi.org/10.1177/1461444816655613
López-Montero, R., Delgado-Baena, A., Vela-Jiménez, R., & Sianes, A. (2021). Digital borders: The impact of the digital divide in the educational process of minor migrants living in marginalized urban areas. INTED2021 Proceedings, 5231–5239. https://doi.org/10.21125/inted.2021.1071
Lloyd, A., Kennan, M. A., Thompson, K. M., & Qayyum, A. (2013). Connecting with new information landscapes: Information literacy practices of refugees. Journal of Documentation, 69(1), 121–144. https://doi.org/10.1108/00220411311295351
Mallett, R. (2022, September). Decent work, migration and the 2030 agenda for sustainable development [Briefing note]. ODI. https://media.odi.org/documents/12390.pdf
Marinucci, M., Mazzoni, D., Pancani, L., & Riva, P. (2022). To whom should I turn? Intergroup social connections moderate social exclusion’s short-and long-term psychological impact on immigrants. Journal of Experimental Social Psychology, 99, Article 104275. https://doi.org/10.1016/j.jesp.2021.104275
Marinucci, M., Pancani, L., Aureli, N., & Riva, P. (2022). Online social connections as surrogates of face-to-face interactions: A longitudinal study under Covid-19 isolation. Computers in Human Behavior, 128, Article 107102. https://doi.org/10.1016/j.chb.2021.107102
Marinucci, M., & Riva, P. (2021a). How intergroup social connections shape immigrants’ responses to social exclusion. Group Processes & Intergroup Relations, 24(3), 411–435. https://doi.org/10.1177/1368430219894620
Marinucci, M., & Riva, P. (2021b). Surrendering to social emptiness: Chronic social exclusion longitudinally predicts resignation in asylum seekers. British Journal of Social Psychology, 60(2), 429–447. https://doi.org/10.1111/bjso.12410
Marinucci, M., & Riva, P. (2025). Homelessness in virtual reality: Experiencing social exclusion improves attitudes and behaviors toward unhoused people. Cyberpsychology, Behavior, and Social Networking, 28(1), 65–71. https://doi.org/10.1089/cyber.2024.0027
Marinucci, M., Riva, P., Lenzi, M., Lasagna, C., Waldeck, D., Tyndall, I., & Volpato, C. (2023). On the lowest rung of the ladder: How social exclusion, perceived economic inequality and stigma increase homeless people’s resignation. British Journal of Social Psychology, 62(4), 1817–1838. https://doi.org/10.1111/bjso.12657
Marler, W. (2019). Accumulating phones: Aid and adaptation in phone access for the urban poor. Mobile Media & Communication, 7(2), 155–174. https://doi.org/10.1177/2050157918800350
Mazzoni, D., Pancani, L., Marinucci, M., & Riva, P. (2020). The dual path of the rejection (dis)identification model: A study on adolescents with a migrant background. European Journal of Social Psychology, 50(4), 799–809. https://doi.org/10.1002/ejsp.2672
McGrath, J., Crossley, S., Lhussier, M., & Forster, N. (2023). Social capital and women’s narratives of homelessness and multiple exclusion in northern England. International Journal for Equity in Health, 22, Article 41. https://doi.org/10.1186/s12939-023-01846-1
Migliorino, P. (2010, 9–11 August). FECCA and CALD communities in the digital age: Digital technologies can unite, but they can also divide [Conference presentation]. My Language Conference 2010: My Language, Your Language in the Digital Age: What Next?, Sydney, Australia.
Milburn, N. G., Ayala, G., Rice, E., Batterham, P., & Rotheram-Borus, M. J. (2006). Discrimination and exiting homelessness among homeless adolescents. Cultural Diversity & Ethnic Minority Psychology, 12(4), 658–672. https://doi.org/10.1037/1099-9809.12.4.658
Moczygemba, L. R., Thurman, W., Tormey, K., Hudzik, A., Welton-Arndt, L., & Kim, E. (2021). GPS mobile health intervention among people experiencing homelessness: Pre-post study. JMIR mHealth and uHealth, 9(11), Article e25553. https://doi.org/10.2196/25553
Neagu, S. N., & Vieriu, A. M. (2025). Digital and psychological well-being among technical university students: Exploring the impact of digital engagement in higher education. Education Sciences, 15(9), Article 1192. https://doi.org/10.3390/educsci15091192
Norris, P. (2003). Digital divide: Civic engagement, information poverty, and the internet worldwide. Canadian Journal of Communication, 28(1). https://doi.org/10.22230/cjc.2003v28n1a1352
Notley, T., & Aziz, A. (2024). The unjust burden of digital inclusion for low‐income migrant parents. Policy & Internet, 16(2), 428–442. https://doi.org/10.1002/poi3.383
Ochara, N. M., & Mawela, T. (2015). Enabling social sustainability of e-participation through mobile technology. Information Technology for Development, 21(2), 205–228. https://doi.org/10.1080/02681102.2013.833888
Ono, H., & Zavodny, M. (2007). Digital inequality: A five country comparison using microdata. Social Science Research, 36(3), 1135–1155. https://doi.org/10.1016/j.ssresearch.2006.09.001
Owens, M., Ravi, V., & Hunter, E. (2023). Digital inclusion as a lens for equitable parent engagement. TechTrends. Advance online publication. https://doi.org/10.1007/s11528-023-00859-5
Palmer, E. J., Hatcher, R. M., & Tonkin, M. J. (2020). Evaluation of digital technology in prisons. Ministry of Justice.
Pancani, L., Marinucci, M., Aureli, N., & Riva, P. (2021). Forced social isolation and mental health: A study on 1,006 Italians under COVID-19 lockdown. Frontiers in Psychology, 12, Article 663799. https://doi.org/10.3389/fpsyg.2021.663799
Pancani, L., Preti, E., & Riva, P. (2020). The psychology of smartphone: The development of the Smartphone Impact Scale (SIS). Assessment, 27(6), 1176–1197. https://doi.org/10.1177/1073191119831788
Panova, T., & Lleras, A. (2016). Avoidance or boredom: Negative mental health outcomes associated with use of information and communication technologies depend on users’ motivations. Computers in Human Behavior, 58, 249–258. https://doi.org/10.1016/j.chb.2015.12.062
Posit team. (2024). RStudio: Integrated development environment for R (Version 2024.04.2+764) [Computer software]. Posit Software, PBC.
Ragnedda, M. (2017). The third digital divide: A Weberian approach to digital inequalities. Routledge. https://doi.org/10.4324/9781315606002
Ragnedda, M. (2018). Conceptualizing digital capital. Telematics and Informatics, 35(8), 2366–2375. https://doi.org/10.1016/j.tele.2018.10.006
Raven, M. C., Kaplan, L. M., Rosenberg, M., Tieu, L., Guzman, D., & Kushel, M. (2018). Mobile phone, computer, and internet use among older homeless adults: Results from the HOPE HOME cohort study. JMIR mHealth and uHealth, 6(12), Article e10049. https://doi.org/10.2196/10049
Reisdorf, B. C., & Jewkes, Y. (2016). (B)Locked sites: Cases of Internet use in three British prisons. Information, Communication and Society, 19(6), 771–786. https://doi.org/10.1080/1369118X.2016.1153124
Reisdorf, B. C., & Rikard, R. V. (2018). Digital rehabilitation: A model of reentry into the digital age. American Behavioral Scientist, 62(9), 1273–1290. https://doi.org/10.1177/0002764218773817
Riva, P. (2016). Emotion regulation following social exclusion: Psychological and behavioral strategies. In P. Riva & J. Eck (Eds.), Social exclusion (pp.199–226). Springer. https://doi.org/10.1007/978-3-319-33033-4_10
Riva, P., & Eck, J. (2016). The many faces of social exclusion. In P. Riva & J. Eck (Eds.), Social exclusion (pp. 9–15). Springer.
Riva, P., Montali, L., Wirth, J. H., Curioni, S., & Williams, K. D. (2017). Chronic social exclusion and evidence for the resignation stage: An empirical investigation: An empirical investigation. Journal of Social and Personal Relationships, 34(4), 541–564. https://doi.org/10.1177/0265407516644348
Rhoades, H., Wenzel, S., Rice, E., Winetrobe, H., & Henwood, B. (2017). No digital divide? Technology use among homeless adults. Journal of Social Distress and the Homeless, 26(1), 73–77. https://doi.org/10.1080/10530789.2017.1305140
Rosenberg, M. (1965). Rosenberg Self-Esteem Scale (RSES) [Database record]. APA PsycTests. https://doi.org/10.1037/t01038-000
Rosseel, Y. (2012). lavaan: An R package for structural equation modeling. Journal of Statistical Software, 48(2), 1–36. https://doi.org/10.18637/jss.v048.i02
Rothberg, J. M. (1991). Stress and suicide in the U.S. Army: Effects of relocation on service members’ mental health. Armed Forces & Society, 17(3), 449–458. https://doi.org/10.1177/0095327x9101700307
Rudert, S. C., Janke, S., & Greifeneder, R. (2021). Ostracism breeds depression: Longitudinal associations between ostracism and depression over a three-year period. Journal of Affective Disorders Reports, 4, Article 100118.
https://doi.org/10.1016/j.jadr.2021.100118
Selwyn, N., & Facer, K., (2007). Beyond the digital divide: Rethinking digital inclusion for the 21st century. Futurelab.
Shi, X., Wang, A., & Zhu, Y. (2023). Longitudinal associations among smartphone addiction, loneliness, and depressive symptoms in college students: Disentangling between– and within–person associations. Addictive Behaviors, 142, Article 107676. https://doi.org/10.1016/j.addbeh.2023.107676
Thurman, W., Semwal, M., Moczygemba, L. R., & Hilbelink, M. (2021). Smartphone technology to empower people experiencing homelessness: Secondary analysis. Journal of Medical Internet Research, 23(9), Article e27787. https://doi.org/10.2196/27787
Van Deursen, A. J., & Van Dijk, J. A. (2011). Internet skills and the digital divide. New Media & Society, 13(6), 893–911. https://doi.org/10.1177/1461444810386774
Van Dijk, J. (2020). The digital divide. John Wiley & Sons.
Van Doorn, N., Ferrari, F., & Graham, M. (2023). Migration and migrant labour in the gig economy: An intervention. Work, Employment and Society, 37(4), 1099–1111. https://doi.org/10.1177/09500170221096581
Walsh, S. P., White, K. M., & Young, R. McD. (2009). The phone connection: A qualitative exploration of how belongingness and social identification relate to mobile phone use amongst Australian youth. Journal of Community & Applied Social Psychology, 19(3), 225–240. https://doi.org/10.1002/casp.983
Wamuyu, P. K., (2017). Bridging the digital divide among low income urban communities. Leveraging use of community technology centers. Telematics and Informatics, 34(8), 1709–1720. https://doi.org/10.1016/j.tele.2017.08.004
Waytz, A., & Gray, K. (2018). Does online technology make us more or less sociable? A preliminary review and call for research. Perspectives on Psychological Science, 13(4), 473–491. https://doi.org/10.1177/1745691617746509
Ware, J. E., & Sherbourne, C. D. (1992). The MOS 36-item short-form health survey (SF-36): I. conceptual framework and item selection. Medical Care, 30(6), 473–483. https://doi.org/10.1097/00005650-199206000-00002
Warschauer, M., & Matuchniak, T. (2010). New technology and digital worlds: Analyzing evidence of equity in access, use, and outcomes. Review of Research in Education, 34(1), 179–225. https://doi.org/10.3102/0091732X09349791
Watts, A., & Erdman, S. L. (2020, July 9). Coronavirus deaths and infection rates higher in US prisons than general population, analysis finds. CNN Health. https://www.cnn.com/2020/07/08/health/coronavirus-prisons-death-rates/index.html
Wood, A. J., Graham, M., Lehdonvirta, V., & Hjorth, I. (2019). Good gig, bad gig: Autonomy and algorithmic control in the global gig economy. Work, Employment and Society, 33(1), 56–75. https://doi.org/10.1177/0950017018785616
Williams, H., Faith, B., & Waldman, L. (2024). Technologies of inclusion and marginalization: Mobile phones and multiple exclusion homeless women. Mobile Media & Communication, 12(2), 404–423. https://doi.org/10.1177/20501579231211498
Williams, K. D. (2009). Chapter 6 ostracism: A temporal need‐threat model. In M. P. Zanna (Ed.), Advances in Experimental Social Psychology (Vol. 41, pp. 275–314). Academic Press. https://doi.org/10.1016/S0065-2601(08)00406-1
Wilson, J., Ward, C., Fetvadjiev, V. H., & Bethel, A. (2017). Measuring cultural competencies: The development and validation of a revised measure of sociocultural adaptation. Journal of Cross-Cultural Psychology, 48(10), 1475–1506. https://doi.org/10.1177/0022022117732721
Zamperini, A., Menegatto, M., Mostacchi, M., Barbagallo, S., & Testoni, I. (2020). Loss of close relationships and loss of religious belonging as cumulative ostracism: From social death to social resurrection. Behavioral Science, 10(6), Article 99. https://doi.org/10.3390/bs10060099
Zadro, L., Williams, K. D., & Richardson, R. (2004). How low can you go? Ostracism by a computer is sufficient to lower self-reported levels of belonging, control, self-esteem, and meaningful existence. Journal of Experimental Social Psychology, 40(4), 560–567. https://doi.org/10.1016/j.jesp.2003.11.006
Authors' Contribution
Ilenia Gasparini: conceptualization, methodology, formal analysis, data curation, resources, validation, visualization, writing—original draft. Marco Marinucci: conceptualization, methodology, investigation, formal analysis, data curation, resources, software, validation, visualization, writing—review & editing. Luca Pancani: conceptualization, methodology, supervision, project administration, funding acquisition, validation, writing—review & editing. Paolo Riva: conceptualization, methodology, supervision, project administration, funding acquisition, validation, writing—review & editing.
Editorial Record
First submission received:
December 27, 2024
Revisions received:
July 8, 2025
April 25, 2026
Accepted for publication:
May 30, 2026
Editor in charge:
Lenka Dedkova
Introduction
In contemporary societies, digital technologies have become deeply embedded in everyday life, shaping how people access information, maintain relationships, and participate in economic and civic activities. Among these technologies, smartphones play a particularly central role due to their portability, affordability, and multifunctionality (Keusch et al., 2021; Rhoades, 2017). However, access to and effective use of smartphones are not equally distributed. For individuals already experiencing social marginalization, such as migrants, people experiencing homelessness, and prisoners, digital inequalities may either exacerbate existing vulnerabilities (e.g., Collier, 2008; Ochara & Mawela, 2015; Wamuyu, 2017) or provide critical resources for connection, integration, and well-being (e.g., Kardefelt-Winther, 2014; Kushlev & Leitao, 2020; Waytz & Gray, 2018). Understanding whether and how smartphones function as tools of inclusion or exclusion for these populations is therefore both theoretically and socially significant.
Although prior research has examined the digital divide and documented disparities in access and digital skills, less attention has been paid to how different patterns of smartphone use, and experiences of digital exclusion, are associated with physical, psychological, and social well-being among structurally marginalized groups
(Alam & Imran, 2015; Van Dijk, 2020; Warschauer & Matuchniak, 2010;). Existing studies often focus on single populations or emphasize access rather than outcomes, leaving a gap in our understanding of how digital engagement relates to well-being across diverse contexts of marginalization (Alam & Imran, 2015; Bastick & Mallet-Garcia, 2022; Ono & Zavodny, 2007; Van Dijk, 2020). To address this gap, the present research investigates the associations between smartphone use, digital exclusion, and well-being in five correlational studies involving migrants, people experiencing homelessness, and prisoners (total N = 817). By integrating perspectives from social exclusion theory and digital inequality research, this work aims to clarify the dual role of smartphones as potential resources for resilience and integration, but also as tools that may reinforce psychological distress and structural disadvantage. In doing so, it contributes to ongoing debates about digital inclusion by moving beyond access-based accounts and focusing on the lived consequences of digital engagement for marginalized populations.
Social Exclusion and Marginalized Groups
Social exclusion is a multidimensional concept that spans economic, social, and cultural domains, including poverty, restricted access to fundamental social rights (e.g., housing and health insurance), limited opportunities for social participation (e.g., unemployment), and poor cultural integration (e.g., criminal records;
Jehoel-Gijsbers & Vrooman, 2008). From a psychosocial perspective, social exclusion is viewed as a relational threat that disrupts social bonds and undermines psychological well-being at both interpersonal and intergroup levels
(Baumeister & Leary, 1995). Within this framework, Riva and Eck (2016) defined social exclusion as the experience of being kept apart from others, either physically (e.g., social isolation) or emotionally (e.g., being ignored or explicitly rejected). This definition encompasses both rejection (negative social attention) and ostracism (the lack of social attention) experiences.
Williams' (2009) model posits that both ostracism and broader forms of social exclusion are profoundly distressing experiences. Beyond eliciting immediate feelings of social pain and negative emotions, they threaten individuals' fundamental psychological needs for belonging, self-esteem, control, and recognition. This can lead to a resignation stage where individuals experience persistent feelings of depression, worthlessness, alienation, and helplessness. The model accounts for both short- and long-term psychological consequences of social exclusion, with the resignation stage emerging as a psychological outcome of prolonged exclusion and isolation (Aureli et al., 2020; Marinucci & Riva, 2021a; Rudert et al., 2021).
Marginalized groups, often excluded from economic, social, and cultural participation, face profound challenges to their physical, psychological, and social well-being, stemming from systemic barriers such as poverty, limited access to essential resources, and restricted opportunities for integration. As a result, the negative impact of social exclusion tends to be particularly severe among marginalized groups, such as immigrants, people experiencing homelessness, and prisoners, who often face chronic and pervasive exclusion (Bennett, 2020; Marinucci & Riva, 2021b; Mazzoni et al., 2020; Riva & Eck, 2016; Rothberg, 1991; Rudert et al., 2021; Williams, 2009; Zamperini et al., 2020).
At the same time, people can exhibit resilience in response to social exclusion by mobilizing available social resources. For instance, structured support groups and social ties with members of the national group can buffer the psychological consequences of exclusion and reduce resignation (Aureli et al., 2020; Hales et al., 2021; Marinucci, Mazzoni et al., 2022; Marinucci, Pancani et al., 2022; Marinucci & Riva, 2021a). However, for many marginalized individuals, stable offline networks are fragmented or inaccessible. In such contexts, digital connections offer an alternative pathway to maintain social bonds and may help mitigate some of the negative consequences of exclusion, including those described by Williams (2009), both in the short and long term. While some theories suggest that online interactions may dilute the depth of face-to-face relationships, they can also enhance connectivity and sustain interactions otherwise impossible (Waytz & Gray, 2018). Kardefelt-Winther (2014) proposed that internet use may act as a coping mechanism in challenging circumstances, rather than being purely compulsive. Among digital technologies, smartphones are particularly crucial, serving as primary tools for accessing online resources and maintaining social connections, especially for marginalized groups with limited access to other digital devices. Kushlev and Leitao’s (2020) displacement-interference-complementarity framework further explores this dynamic, suggesting that while smartphones may hinder well-being by displacing essential activities or interfering with face-to-face interactions (e.g., phubbing), they can also enhance well-being by providing access to otherwise unattainable resources and support. For instance, during the COVID-19 lockdown, Marinucci et al. (2022b) and Pancani et al. (2021) found that online interactions helped alleviate the resignation stage caused by the absence of face-to-face contacts.
Smartphones: Tools of Inclusion and Exclusion for Marginalized Groups
Advancements in information and communication technology are reshaping how societies function, but the benefits of digital innovation are not equally distributed. Digital inclusion is broadly conceptualized as a multidimensional framework encompassing not only access to digital technologies but also the skills and support necessary to use them effectively (Crandall & Fisher, 2009; Haché & Cullen, 2010; Owens et al., 2023). In this sense, digital inclusion involves technological literacy, the ability to access relevant online services, and opportunities for meaningful engagement, enabling individuals to participate fully in economic, social, and civic life. However, when these conditions are not met, individuals may experience digital exclusion, defined as the inability to access or effectively use digital resources, significantly limiting individuals’ participation in economic, social, and civic activities (Lloyd et al., 2013; Selwyn & Facer, 2007). This phenomenon, often referred to as the “digital divide,” reflects disparities in access to technology, digital literacy, and actual usage of digital tools
(Alam & Imran, 2015; Warschauer & Matuchniak, 2010). Consistent with this perspective, recent frameworks in digital inequality research emphasize that access alone is insufficient for inclusion. For instance, Van Dijk’s (2020) model distinguishes between three interconnected levels of digital divides: first-level divides concern physical access to digital technologies; second-level divides pertain to differences in digital skills, literacy, and agency; and third-level divides refer to the unequal outcomes and benefits derived from digital engagement.
The digital divide manifests across various demographic lines, including income, gender, age, and race, creating barriers that prevent equal access to critical opportunities (Goedhart et al., 2019; Jackson et al., 2008). These disparities are particularly acute for marginalized groups such as the elderly, low-income individuals, people with disabilities, rural populations, and ethnic minorities (Bastick & Mallet-Garcia, 2022; Ono & Zavodny, 2007). For these populations, even modest gaps in access may exacerbate existing vulnerabilities, further limiting opportunities to engage with essential services such as healthcare, housing, and employment (Collier, 2008; Ochara & Mawela, 2015; Wamuyu, 2017).
This dual disadvantage—offline and online exclusion—is especially severe for marginalized groups such as migrants, people experiencing homelessness, and prisoners. Pre-existing inequalities, including limited education, financial constraints, and restricted access to technology, are mirrored and often intensified in digital spaces (Baum et al., 2012). As a result, these populations face heightened barriers to social and community integration. Migrants may struggle with language barriers and cultural differences in digital practices, people experiencing homelessness often lack stable access to devices or internet connectivity, and prisoners are frequently excluded entirely from digital tools by institutional restrictions. These overlapping disadvantages hinder not only access to vital resources but also opportunities to build meaningful social networks and reduce exclusion (Marinucci & Riva, 2025).
Among digital technologies, smartphones stand out as particularly vital tools for bridging these gaps due to their portability, accessibility, and multifunctionality. Unlike desktop computers or even laptops, smartphones are more affordable and require less infrastructure, making them accessible even to those with limited resources (Keusch et al., 2021; Rhoades, 2017). Research shows that even minimal access to smartphones can mitigate the negative effects of social rejection and improve well-being (Hunter et al., 2018). For marginalized individuals, smartphones are often the primary, or only, digital device available, acting as gateways to critical resources and opportunities. Smartphones offer marginalized individuals access to information about essential services, including housing, employment, and healthcare, while also enabling emotional support and community integration (Alam & Imran, 2015; Galperin et al., 2021). These devices act as lifelines for communication and information, providing tools such as social media, navigation apps, and calendars that help users adapt to different social contexts and manage daily challenges (Marler, 2019). Moreover, smartphones open pathways for autonomous learning and skill development, creating opportunities for personal growth and resilience. Their versatility and widespread use make them indispensable in efforts to address the digital divide and promote social inclusion.
Although smartphones, digital platforms and gig economies seem to offer opportunities, thanks to low entry barriers and flexible conditions, they often replicate and amplify offline inequalities. Migrants, particularly those from the Global South, are frequently subjected to algorithmic control, racial discrimination, and precarious working conditions (Calo & Rosenblat, 2017; Wood et al., 2019). These platforms tend to formalize aspects that benefit companies, like tracking and payments, while shifting risks to workers, leaving undocumented migrants especially vulnerable (Van Doorn et al., 2023). Thus, access to technology, while necessary, is not sufficient to ensure meaningful inclusion or empowerment.
In the following sections, we delve into how digital exclusion uniquely affects specific marginalized groups, including migrants, people experiencing homelessness, and prisoners, and explore how smartphones, as pivotal digital tools, can either mitigate or exacerbate their social and economic vulnerabilities.
While this study acknowledges the critical role of first-level divides, particularly for structurally marginalized groups such as migrants, people experiencing homelessness, and individuals in detention for whom access to digital technologies can be highly constrained, our primary analytical focus lies on the second and third levels. Specifically, we investigate how varying levels and modes of digital technology use, including limited or no access, as in the case of incarcerated individuals, relate to well-being across five studies. Additionally, albeit in a more limited way, and only in Study 4, our analysis also considers individuals’ digital competencies in using technology, through a measure of perceived digital ability among incarcerated participants. These higher-order dimensions of digital inequality offer a deeper understanding of how digital inclusion and exclusion are associated with well-being and social participation among people already facing systemic disadvantage, moving beyond a simplistic focus on mere access.
Digital Exclusion and Migration
For migrants, digital exclusion stems from multiple factors, including the high cost of digital devices and internet services, limited digital literacy, language barriers, and cultural differences (Correa-Velez et al., 2013; López-Montero et al., 2021; Migliorino, 2010; Notley & Aziz, 2024). These barriers contribute to "information disjunctures," where migrants struggle to navigate the digital practices of their host countries, impeding access to essential services such as housing, healthcare, and education (Kaufmann, 2018; Leung, 2010). Limited digital skills further hinder migrants’ participation in online environments, heightening feelings of isolation and complicating integration processes (Alam & Imran, 2015). As a result, digital exclusion exacerbates social exclusion, restricting opportunities for migrants to connect with communities and access critical resources for their well-being.
In contrast, smartphones play a crucial role throughout the migration journey, from the planning stages to the actual journey and eventual settlement in the host country (Mallett, 2022). These devices empower migrants by providing access to crucial information about their destination, planning safer routes, and sharing this knowledge with others. Social media platforms play a key role in this dynamic, facilitating the real-time exchange of updates, practical advice, and support among migrants and their trusted contacts (Dekker et al., 2018; Finotto, 2018; Gillespie et al., 2018; Mancini et al., 2019). Beyond logistical support, smartphones help migrants maintain connections with family and friends, offering emotional support that fosters a sense of belonging and alleviates acculturation stress and resignation (Lorenzana, 2016; Walsh et al., 2009; Williams, 2009).
During the adaptation phase, smartphones facilitate access to critical services such as housing, employment, and healthcare, while also offering tools to navigate local resources, including transportation, cultural events, and language-learning applications. Additionally, smartphones enable migrants to maintain ties to their cultural identity by accessing content such as news from their home countries (Alencar, 2018; Dekker & Engbersen, 2014). These digital tools not only support daily functioning but also contribute to long-term integration by promoting social inclusion and personal agency.
Ultimately, access to smartphones, or the lack thereof, could profoundly shape the integration experiences of migrants. While digital exclusion can amplify existing vulnerabilities, smartphones may act as critical resources for mitigating these challenges, enabling migrants to build connections, access vital information, and foster their overall well-being and social inclusion.
Digital Exclusion and Homelessness
People experiencing homelessness face extreme social exclusion, further compounded by limited digital access. Recognized as one of the most marginalized groups (European Commission: Directorate-General for Employment, Social Affairs and Inclusion, 2010), they frequently encounter discrimination from various sources, including law enforcement and family members, which profoundly impacts their well-being (Marinucci et al., 2023; Milburn et al., 2006). Homelessness extends beyond poverty and the absence of shelter, encompassing significant psychological, cultural, and emotional burdens driven by the insecurity and instability of lacking a safe and affordable home (Bretherton & Pleace, 2023). This extreme marginalization disrupts the ability to maintain social networks, participate in community life, and access essential social services (McGrath et al., 2023).
The digital divide only worsens these challenges. Many people experiencing homelessness face constant issues like sporadic internet access, interrupted phone services due to financial constraints, and a lack of safe, reliable spaces to charge devices (Faith, 2018; Gonzales et al., 2016; Williams et al., 2024). These barriers create a constant shift between moments of connectivity and disconnection (Faith, 2018; Galperin et al., 2021; Gonzales et al., 2016).
Despite these challenges, smartphones serve as vital lifelines for people experiencing homelessness. They provide access to maps, apps, and communication services, enabling users to connect with case managers, potential employers, and healthcare providers (Leinen, 2017; Thurman et al., 2021). This access not only supports practical needs, such as navigating daily life, but also enhances social and emotional well-being by enabling contact with friends and family, connections linked to higher self-esteem, reduced social isolation, and greater resilience (Moczygemba et al., 2021; Raven et al., 2018). Additionally, mobile technologies are seen as tools for emotional support, helping people experiencing homelessness manage stress, depression, and loneliness (Adkins et al., 2017; Leinen, 2017). Moreover, smartphones assist in establishing routines, managing medication schedules, and accessing humanitarian aid, bus schedules, and directions, functions that directly support physical self-management and daily functioning, making them essential tools for overcoming barriers posed by digital exclusion (Kushel et al., 2006; Le Dantec & Edwards, 2008; Raven et al., 2018). Therefore, in the context of homelessness, smartphones could play a dual role: they may mitigate some of the most pressing challenges of exclusion while empowering individuals to access resources and rebuild social ties.
Digital Exclusion and Imprisonment
Incarcerated populations face an even more extreme form of digital exclusion due to restricted access to digital tools imposed by the prison system itself, which isolates prisoners from the digital world. Digital exclusion in this context is a structural issue rooted in the prison system, which restricts or entirely denies access to technology, thereby intensifying the social exclusion experienced by prisoners (Blomberg et al., 2021; Emasealu & Popoola, 2016; Reisdorf & Rikard, 2018). Unlike other forms of digital exclusion, which may stem from financial or educational barriers, the exclusion of prisoners is systematically enforced, leaving them disconnected from the rapidly evolving digital landscape.
Research on digital exclusion in prisons is limited, but existing studies underscore the growing gap between incarcerated populations and the digital world. During incarceration, limited or absent access to digital technologies restricts cognitive stimulation and communication (Jewkes, 2008) and undermines psychological well-being by intensifying feelings of loneliness and depression (Reisdorf & Jewkes, 2016; Palmer et al., 2020). This digital disconnection also hampers prisoners’ ability to maintain social ties, which plays a key role in reducing the likelihood of reoffending (Bales & Mears, 2008). In addition, the lack of digital access leads to significant deficits in digital literacy, exacerbating marginalization upon release. Many former inmates face difficulties navigating online systems for employment, social services, and education, leaving them unprepared for life in a digital society (Reisdorf & Jewkes, 2016). These barriers may intensify feelings of exclusion and contribute to a heightened risk of recidivism (Blomberg et al., 2021; Hwang et al., 2024). Reisdorf and Rikard’s Digital Rehabilitation Model (2018) further demonstrates how the absence of digital access during incarceration negatively affects several life domains, including economic, social, and health, both during imprisonment and after release.
Overview
This paper examines the role of smartphone use and digital exclusion in shaping the physical, psychological and social well-being of marginalized populations, focusing on migrants, people experiencing homelessness, and prisoners. Through five cross-sectional studies, we examine the links between smartphone use patterns, experiences of digital exclusion, and well-being. To this end, we developed tailored scales for measuring smartphone use and digital exclusion, adapting them to the unique characteristics of each group. These scales were then linked to variables assessing physical and psychological health and socio-cultural adaptation. Descriptive statistics for all studies are presented in Table 1.
Given the diverse experiences of these populations, the smartphone use scales and corresponding items were adapted to reflect each group’s specific context. In Study 1, which focused on migrants, smartphone use was assessed across a range of applications capturing interpersonal communication and information/service-related activities. Studies 2a and 2b extended this approach by assessing a broader set of smartphone functions across different stages of the migration journey, including staying in touch with family and friends, gathering information, accessing services, and managing emotions. Study 3 used a similar framework for people experiencing homelessness, focusing on communication, information seeking, and emotional support. Finally, Study 4 assessed digital exclusion among incarcerated individuals, capturing both limited access to technology and the perceived impact of digital deprivation on daily life and social participation. These forms of digital engagement are expected to relate to well-being because they provide pathways to maintain social ties, obtain essential information, and manage emotional states, resources that can buffer the negative effects of social and structural exclusion. Conversely, limited access or inability to use digital tools may exacerbate stress, reduce agency, and increase feelings of isolation, thereby undermining physical, psychological, and social well-being.
Following Williams’ (2009) temporal model of social exclusion, psychological well-being was operationalized using theoretically grounded indicators across studies, ranging from more proximal to more distal outcomes. In Study 1, we focused on basic psychological needs satisfaction (i.e., belonging, self-esteem, meaningful existence, and control) as an immediate indicator of inclusion and exclusion. In Studies 2–4, by contrast, we examined resignation as a more distal indicator of prolonged exclusion and psychological disengagement, reflecting a convergence of depressive affect, alienation, diminished self-worth, and helplessness. Specifically, Study 1 examined migrants’ smartphone use in relation to physical health (i.e., subjective evaluations of one’s overall health and susceptibility to illness), basic psychological needs (i.e., belonging, control, self-esteem, and meaningful existence), and sociocultural adaptation, defined as the ability to navigate everyday life in the host society, including navigating institutions, accessing services, and engaging in meaningful social interactions within the new cultural environment. Studies 2a and 2b focused on migrants, exploring smartphone use during different stages of the migratory journey and its links to sociocultural adaptation and resignation. Study 3 investigated how different uses of smartphones among people experiencing homelessness relate to physical health and resignation. Finally, Study 4 focused on incarcerated individuals, exploring how different dimensions of digital exclusion, measured as limited access to technology and inability to use digital resources, representing an impediment to daily functioning, relate to physical well-being and resignation. Across all five studies, we explore general patterns linking digital engagement and exclusion to well-being. We broadly expect that greater use of smartphones for communication, information access, and practical or emotional support will be associated with higher physical, psychological, and social well-being, whereas higher levels of perceived digital exclusion will be linked to lower physical well-being and greater resignation.
This work focuses on understanding how digital technologies, or their absence, are related to the well-being and social integration of marginalized populations such as migrants, people experiencing homelessness, and prisoners. By examining the dual role of technology as both a tool of inclusion and exclusion, we aim to shed light on the complex dynamics shaping their experiences in a digitally connected world.
Given the involvement of potentially vulnerable populations (migrants, people experiencing homelessness, and prisoners), particular attention was paid to ensuring inclusivity, voluntariness, and the protection of participants’ rights and well-being throughout all phases of the research. Before initiating contact with participants, the research protocols were designed to minimize potential risks and burdens. Recruitment was carried out in collaboration with hosting centers, associations, and institutional authorities already working with the target populations, in order to ensure an appropriate and respectful approach. Participation was entirely voluntary, and no negative consequences followed refusal or withdrawal from the study at any stage. Prior to data collection, all participants received clear and accessible information about the study aims, procedures, anonymity, and data use.
Table 1. Descriptive Statistics of Sample Characteristics Across the Five Studies.
|
|
Study 1 |
Study 2a |
Study 2b |
Study 3 |
Study 4 |
|
N |
278 immigrants |
75 immigrants |
174 immigrants |
71 homeless |
219 prisoners |
|
Gender |
25.5% female |
0% female |
44.8% female |
83.1% female |
0% female |
|
71.9% male |
100% male |
55.2% male |
15.5% male |
95% male |
|
|
1.8% unspecified |
— |
— |
1.4% unspecified |
5% unspecified |
|
|
0.7% non binary |
— |
— |
— |
— |
|
|
Age |
30.66 (SD = 10.67) |
25.8 (SD = 6.4) |
34.56 (SD = 10.6) |
53.1 (SD = 11.02) |
43.22 (SD = 13.04) |
|
Country of origin |
43.2% Western Africa |
92.1% Western Africa |
40.8% Western Africa |
95.7% Italy |
76.7% Italy |
|
9.5% Northern Africa |
1.3% Northern Africa |
17.8% Northern Africa |
4.3% Other |
13.7% Northern Africa |
|
|
5.9% Eastern Europe |
1.3% Eastern Africa |
5.1% Eastern Europe |
— |
9.6% Other |
|
|
8.5% South Asia |
5.3% South Asia |
6.3% South Asia |
— |
— |
|
|
13.8% Latin America |
— |
18.4% Latin America |
— |
— |
|
|
3.0% Middle East |
— |
11.6% Other |
— |
— |
|
|
24.6% Other |
— |
— |
— |
— |
|
|
Marital status |
62.9% Single |
77.3% Single |
45.9% Single |
48.6% Single |
38.6% Single |
|
29.2% Married |
15.4% Married |
36.4% Married |
1.4% Married |
35.7% Married |
|
|
5.6% Separated/ divorced |
6.3% Separated/ divorced |
7.2% Separated/ divorced |
48.6% Separated/ divorced |
23.7% Separated/ divorced |
|
|
2.3% Widowed |
0.9% Widowed |
10.5% Widowed |
1.4% Widowed |
1.93% Widowed |
|
|
Occupational status |
59.1% Unemployed |
83.5% Unemployed |
48.8% Unemployed |
84.1% Unemployed |
— |
|
40.1% Employed |
16.5% Employed |
51.2% Employed |
15.9% Employed |
— |
|
|
Migration status |
74.4% Forced migrants |
100% Forced migrants |
52.2% Forced migrants |
— |
— |
|
25.6% Voluntary migrants |
— |
47.8% Voluntary migrants |
— |
— |
|
|
Night locations |
— |
— |
— |
18.31% Street |
— |
|
— |
— |
— |
67.60% Shelters |
— |
|
|
— |
— |
— |
11.27% Apartments |
— |
|
|
— |
— |
— |
2.82%Other |
— |
|
|
Months of stay in Italy (SD) |
72.4 (SD = 88.0) |
15 (SD = 8.1) |
68 (SD = 62.5) |
— |
— |
|
Months as homeless (SD) |
— |
— |
— |
49.27 (SD = 50.84) |
— |
|
Months spent in prison (SD) |
— |
— |
— |
— |
48.41 (SD = 50.84) |
|
Remaining prison sentence in months (SD) |
— |
— |
— |
— |
64.99 (SD = 71.56) |
|
Education level |
— |
— |
— |
12.7% Primary school |
4.4% Primary school |
|
— |
— |
— |
38% Secondary school |
46.6% Secondary school |
|
|
— |
— |
— |
38% High school |
42.2% High school |
|
|
— |
— |
— |
11.3% University |
4.8% University |
|
|
— |
— |
— |
— |
1.9% Master/Phd |
|
|
Years of education (SD) |
10.5 (SD = 5.2) |
10.4 (SD = 3.8) |
11.4 (SD = 4.86) |
— |
— |
|
Daily smartphone usage time (SD) |
2.85 Hours (SD = 2.17) |
— |
— |
199.16 Minutes (SD = 140.37) |
— |
Informed consent was obtained from all participants. To promote inclusivity and comprehension, questionnaires were made available in multiple languages (Italian, English, French, Spanish, and Arabic), and participants were free to choose the language in which they felt most proficient. For asylum seekers and refugees, data collection took place with the support of cultural and linguistic mediators, who facilitated communication and ensured that instructions and consent procedures were fully understood. As such Italian proficiency was not required for studies among migrants. Data were collected anonymously using self-report questionnaires, and no identifying information was recorded. Participants were informed that their responses would be treated confidentially and used exclusively for research purposes. For prisoners, data collection was conducted in accordance with institutional regulations, ensuring that participation was not linked in any way to detention conditions, benefits, or evaluations, and that perceived coercion was minimized. After data collection, all data were securely stored and analyzed in aggregated form only. Participants were offered the opportunity to ask questions or request further information about the study, and care was taken to ensure that the research process did not interfere with the services provided by the hosting institutions or associations. All participants were adults (18 years or older). Besides, major age, eligibility criteria were primarily related to the target population of each study: first-generation migrants without Italian citizenship for the migrant studies, people experiencing homelessness for Study 3, and incarcerated individuals for Study 4. No additional specific eligibility criteria were applied regarding the time since migration, homelessness, or imprisonment.
Analytic Strategy
Given the distinct characteristics of the marginalized groups considered, we used Principal Component Analysis (PCA) to evaluate item performance in these populations—selecting only the most relevant when needed—and assess the dimensionality of all the measures, including both well-established scales from literature and scales specifically developed to measure smartphone use and digital exclusion. This decision was driven by the recognition that our samples differ from typical populations in psychological research, like students or the general public.
The analytical approach across all five studies followed two steps. First, PCAs examined the dimensionality of the smartphone use and digital exclusion scales and various outcomes, including physical, psychological and social well-being. Following this, we conducted correlations and path analyses to investigate how the smartphone use and digital exclusion components derived from the PCAs were associated with the outcomes. In the path analyses, gender, age and education were included as covariates, given their well-established associations with both digital engagement patterns and psychosocial well-being (Chan, 2018; Neagu & Vieriu, 2025), and to account for potential structural differences across participants. We tested path analyses within the Structural Equation Modeling approach (SEM) using lavaan package (Rosseel, 2012) in RStudio (Posit team, 2024, Version 2024.04.2+764). The Ethical Committee of the University of Milano Bicocca approved all the studies.
Studies’ hypotheses were not pre-registered. Datasets, analytic codes, and the studies‘ materials are available on the OSF platform at: https://osf.io/e2tfv/.
Study 1
Study 1 focused on both forced and voluntary migrants, examining how the frequency of use of different categories of smartphone applications was associated with physical, psychological and social well-being, operationalized with perceived physical health, basic psychological needs satisfaction, and socio-cultural adaptation, respectively. The applications assessed included communication-oriented apps (e.g., messaging apps, phone calls, social media) as well as information- and service-oriented apps (e.g., news, calendar and notes, location services, entertainment, and service-search apps). Drawing on previous research on smartphone use for emotional regulation (e.g., Kardefelt-Winther, 2014; Panova & Lleras, 2016) and digital practices among migrants that appear to support coping strategies and social integration (e.g., Dekker & Engbersen, 2014; Lorenzana, 2016; Mallett, 2022), we formulated the exploratory hypothesis that more frequent use of various smartphone applications would be related to higher levels of basic psychological needs satisfaction, perceived physical health, and socio-cultural adaptation. These apps may support coping, connection, and adaptation, providing resources that promote well-being across physical, psychological, and social domains. Additionally, we explored which types of smartphone applications might show stronger associations with these outcomes.
Method
Participants
A convenience sample of 288 migrants participated in this study. Ten participants were excluded as they did not answer any items related to smartphone application usage. The final sample consisted of 278 participants. All descriptive information regarding the sample's demographic, educational, migration-related, and smartphone usage characteristics is summarized in Table 1.
Participants completed a paper-and-pencil self-report questionnaire on sociodemographic information, well-being, adaptation to the new country, and general health. Although additional measures were collected, only the indices relevant to the study’s aims are reported.
Questionnaires were translated by native speakers into three languages: Italian, French, and English, allowing participants to select the version in which they felt most proficient. For asylum seekers and refugees, data were collected in collective sessions in migrant hosting centers, with the available support of cultural and linguistic mediators. Differently, voluntary migrants were invited to participate in the study in cultural and sports associations. All participants joined the study voluntarily after giving their informed consent. Data collection took place between January and June 2019 in Northern Italy.
Measures
Smartphone Applications Usage Scale. The smartphone scale used in this study was developed specifically for the research. It comprised 13 items that assessed the frequency of use of various smartphone application categories, including texting apps, social media, photo cameras, calendars, and others. Participants were asked to rate the frequency of their use of each app type on a scale of 1 (never) to 5 (almost always). A principal component analysis suggested that the pool of items loaded adequately onto two factors, namely Communication and Information applications. Item 4, which measured camera usage, was removed as it did not align with the content of the Communication factor. After its removal, the two-factor solution accounted for 48% of the total variance. Loadings from the oblimin-rotated solution indicated that the Communication factor consisted of three items related to interpersonal communication: social media apps, phone calls, and messaging apps (loadings’ range: λ = .64–.86; Cronbach’s α = .69). The Information factor included nine items for applications used for accessing news, utilizing the calendar, notes, location services, entertainment, and looking for different services (loadings’ range: λ = .53–.77; Cronbach’s α = .83). We saved the factors’ scores by averaging the related items. For transparency, the full set of items and their factor loadings is reported in Appendix Table A1.
Basic Psychological Needs Satisfaction. The Need Threat Scale (Williams, 2009; Zadro et al., 2004) was used to assess the level of threat to the four fundamental needs outlined in Williams's (2009) model: belonging, self-esteem, meaningful existence, and control. These 20 items were rated on a 5-point Likert scale, ranging from 1 (not at all) to 5 (extremely). An initial PCA suggested a two-factor structure, with non-reversed and reversed items loading separately. Because this pattern appeared to reflect methodological wording effects rather than conceptual distinctions between needs, reversed items were excluded and the final PCA was conducted on the remaining 11 items. After removing poor fitting items, a PCA indicated that the final pool of 11 items assessing the four needs adequately loaded onto a single factor (explained variance: 41%, loadings’ range: λ = .43–.71; Cronbach’s α = .85). We averaged the 11 items into an overall index so that higher scores indicated higher need satisfaction (i.e., greater psychological well-being). For transparency, Appendix Table A2 presents the final items and their PCA loadings.
Physical Health. Health was measured using the Perceived General Health subscale of the 36-Item Short-Form Health Survey (SF-36; Ware & Sherbourne, 1992). This subscale includes four items that evaluate individuals’ perceptions of their overall health, such as the question, I feel like I get sick more easily than others (reversed). The response scale ranged from 1 (definitely false) to 5 (definitely true). In addition, we used a single-item measure of overall perceived health: In general, would you say that your health is? (1 = poor, 5 = excellent). A principal component analysis suggested that the items loaded onto a single factor explaining 41% of the variance (loadings’ range:
λ = .44–.81; Cronbach’s α = .61). We averaged the items into an overall index, with higher levels indicating a higher perception of health.
Socio-Cultural Adaptation. The revised Socio-Cultural Adaptation Scale by Wilson et al. (2017) was used to measure socio-cultural adaptation. It assesses culturally competent behaviors necessary for effective adaptation in new cultural settings. It consists of 11 items categorized into three key domains of cultural competencies: Social Interaction (the ability to communicate effectively and manage casual interactions with members of the host culture), Community Engagement (the ability to establish friendships and social networks with host nationals), and Ecological Adaptability (navigating and adapting to the unfamiliar environment of the host country). Respondents evaluate their level of competence in performing specific behaviors related to these domains using a five-point Likert scale ranging from 1 (not at all) to 5 (extremely). A principal component analysis suggested that the items loaded onto a single factor explaining 44% of the variance (loadings’ range: λ = .57–.77; Cronbach’s α = .87). We averaged the items into an overall index, with higher levels indicating a higher perception of socio-cultural adaptation. Descriptive statistics and correlations of the measures are reported in Table 2.
Results
Correlational analyses (refer to Table 2) indicated a positive correlation between the use of information-related smartphone applications and basic psychological needs satisfaction, physical health, and socio-cultural adaptation. In contrast, the use of communication applications was only associated with a higher degree of socio-cultural adaptation.
Table 2. Means, Standard Deviations, and Correlations for the Core Constructs of Study 1.
|
Variable |
M |
SD |
1 |
2 |
3 |
4 |
5 |
|
1. Communication |
3.70 |
0.85 |
— |
— |
— |
— |
— |
|
2. Information |
2.46 |
0.83 |
.35*** [.24, .45] |
— |
— |
— |
— |
|
3. Basic psychological needs satisfaction |
3.17 |
0.72 |
.10 [−.02, .21] |
.32*** [.21, .42] |
— |
— |
— |
|
4. Socio-cultural adaptation |
3.42 |
0.70 |
.25*** [.13, .36] |
.39*** [.28, .48] |
.50*** [.40, .58] |
— |
— |
|
5. Physical Health |
3.76 |
0.73 |
−.01 [−.13, .11] |
.21*** [.09, .32] |
.24*** [.12, .34] |
.28*** [.17, .38] |
— |
|
Note. ***p < .001. 95% CI values between brackets. |
|||||||
Figure 1. Results of Study 1.
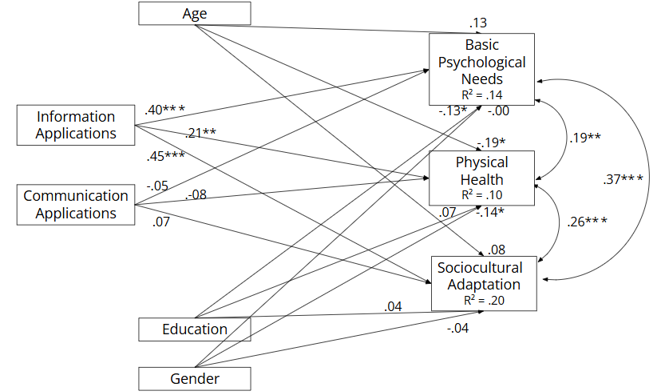
Note. Standardized coefficients. *p <.05, **p <.01, ***p <.001.
To further examine these relationships, we ran a path analysis specifying the Information and Communication applications factors as predictors of the three outcomes of basic psychological needs satisfaction, perceived physical health, and sociocultural adaptation. The results are presented in Figure 1, and the full set of path coefficients is reported in Appendix Table A8.
The analysis revealed that the Information factor was significantly associated with higher levels of basic psychological needs satisfaction, perceived physical health, and sociocultural adaptation among immigrants. In contrast, the Communication factor was not significantly related to any of the three outcomes.
Discussion
Study 1 examined how smartphone use is associated with basic psychological needs satisfaction, socio-cultural adaptation, and physical health among migrants, distinguishing between communication and information-based applications. The results from both correlational and path analyses provide valuable insights into these relationships.
Correlational analyses showed a positive association between information applications and all three outcomes: basic psychological needs satisfaction, socio-cultural adaptation, and physical health. This highlights the importance of apps that provide access to information and services, aligning with the complementarity hypothesis, which suggests digital technologies enhance well-being by providing otherwise inaccessible resources
(Kushlev & Leitao, 2020). Path analysis corroborated these findings, showing a significant positive association between information apps and the three outcomes. This underscores the key role of information-based apps in promoting well-being and integration among migrants.
In contrast, the use of communication applications was not associated with any of the three outcomes, indicating that their use showed no systematic relationship with these aspects of well-being, unlike information-oriented applications.
Overall, these results highlight distinct patterns of association between different types of smartphone applications and immigrants’ well-being. Information-related applications were more consistently associated with various well-being indicators, whereas communication applications showed more limited associations with overall well-being.
Study 2a
Following an initial study on migrants focusing on the frequency of smartphone application use, we conducted two related studies (Studies 2a–2b) examining smartphone use across the migration process, from pre-departure to the journey and arrival in Italy, and its associations with psychological and social well-being. These outcomes were operationalized as resignation and sociocultural adaptation among forced and voluntary migrants, respectively. Importantly, unlike Study 1, which assessed broad categories of applications (e.g., messaging, social media, entertainment) without considering their functional role, these studies captured a wider and more context-specific range of smartphone uses directly tied to the migration experience. Participants were asked to report on their smartphone use across several key functions, including gathering information before migration, staying connected with family and friends, and facilitating their integration into Italian society. By identifying distinct smartphone usage patterns through principal component analysis, this study sought to understand the specific ways in which smartphones support or hinder psychological and social well-being during the migration process. While this study was primarily exploratory in nature, we hypothesized that more frequent smartphone use would correlate with better adaptation, and psychological well-being. This expectation draws on prior literature suggesting that digital engagement can support coping strategies and social integration, especially among migrants (e.g., Dekker & Engbersen, 2014; Kardefelt-Winther, 2014). At the same time, we explored which specific usage patterns were most strongly associated with these outcomes.
Given its particularly limited sample size, Study 2a served as a preliminary exploration to refine the scale measuring smartphone usage across the migration journey and to identify potential associations with psychological and social well-being outcomes, laying the groundwork for the more comprehensive analyses in Study 2b.
Method
Participants
A convenience sample of 112 individuals participated in the study; however, only 81 responded to the questions regarding smartphone use, with 75 participants reporting they owned a smartphone and 6 indicating they did not. All descriptive information regarding the sample's demographic, educational, and migration-related characteristics is summarized in Table 1.
Data was collected through self-reported questionnaires administered during group meetings in three different hosting centers for asylum seekers and refugees in Northern Italy. The questionnaires were available in Italian, English, and French, allowing participants to choose their preferred language. Cultural-linguistic mediators were present to assist participants during data collection when necessary. Data collection took place between September and December 2018.
Measures
Smartphone Usage Scale. Compared to Study 1, which focused on broad application categories, the Smartphone Usage Scale was developed specifically for this study and comprised 28 items designed to assess the frequency of smartphone use for various purposes at different stages of the migratory journey. All participants responded to all items, reporting retrospectively on their smartphone use (a) before departure to Italy (e.g., searching for entry opportunities or job prospects), (b) during the journey (e.g., obtaining travel-related information or seeking assistance), and (c) upon arrival in Italy (e.g., maintaining contact with family in the home country or searching for employment and housing). Items were organized in blocks corresponding to these three temporal phases. Participants rated the frequency of smartphone use for each function on a scale from 1 (never) to 5 (almost always). A principal component analysis was used to identify the dimensionality; four items were excluded due to methodological reasons (i.e., low loadings) and theoretical considerations (i.e., they did not represent specific aspects of smartphone use within the migratory context). We identified four components that captured distinct ways smartphones are used throughout the migration process. The Pre-arrival use dimension consisted in 12 items focusing on smartphone use before reaching Italy to gather information prior to departure and pertaining to communication and logistics during the journey (loading range: λ = .62–.85; Cronbach’s α = .93). The Communication dimension included four items emphasizing maintaining ties with family and friends in the home country after arriving in Italy (loading range: λ = .69–.83; Cronbach’s α = .83). The Information dimension consisted of four items on using smartphones to establish relationships with Italians and search for employment in Italian society (loading range: λ = .58–.80; Cronbach’s α = .79). Finally, the Emotional regulation dimension captured individual, everyday use of smartphones as a coping mechanism, such as using the phone when feeling sad, uncertain, or in need of distraction. This dimension included four items related to managing negative emotions after arrival in Italy (loading range: λ = .46–.88; Cronbach’s α = .79). The four-dimension solution explained 64% of the variance (see Table 3 for correlations between the dimensions). We averaged the items for each factor to calculate factor scores. For transparency, the full set of items and their factor loadings is reported in Appendix Table A3.
Resignation. Following the temporal model of social exclusion (Williams, 2009), we conceptualized resignation as a distal indicator of psychological well-being, reflecting prolonged disengagement resulting from chronic exclusion. As similarly done in previous research (e.g., Riva et al., 2016), we measured the resignation stage by assessing its components of depression, alienation, unworthiness, and helplessness, as theorized by Williams (2009). Depression was measured using 11 items from the Depression subscale of the Symptom Checklist-90R (Derogatis & Unger, 2010). Alienation was assessed with 8 items from the Social Connectedness Scale
(Lee & Robbins, 1995). Unworthiness was evaluated using 5 items from the Rosenberg Self-Esteem Scale (Rosenberg, 1965), and helplessness with 4 items from the Beck Hopelessness Scale (Beck et al., 1974). Participants rated the 28 items on a 5-point Likert scale (1 = not at all, 5 = extremely) based on their experiences over the past three months. An initial parallel analysis suggested a four-dimension solution. However, the solution was very complex to interpret with many items having poor or high saturation on all the dimensions, items from the same scale loading onto different dimensions, and negative item-dimension correlations. To simplify the solution, we selected the highest-loading items from each of the four theoretical components of resignation, resulting in a final set of nine items (two assessing depression, three alienation, two unworthiness, and two helplessness). A final PCA supported a single-component solution, explaining 35% of the variance (loadings range: λ = .37–.78; Cronbach’s α = .75). We averaged the nine items to compute an aggregated resignation index, with higher scores indicating greater resignation.
Socio-Cultural Adaptation. We measured socio-cultural adaptation using the revised Socio-Cultural Adaptation Scale by Wilson et al. (2017). This scale assesses behaviors required for effective adaptation in new cultural settings across three domains: Social Interaction, Community Engagement, and Ecological Adaptability. Participants rated their competence on a 5-point Likert scale. A principal component analysis suggested that the items loaded onto a single factor explaining 41% of the variance (loadings’ range:
λ = .40–.80; Cronbach’s α = .85). We averaged the 11 items into an overall index, with higher levels indicating greater socio-cultural adaptation. Descriptive statistics and correlations are shown in Table 3.
Results
Correlational analyses revealed positive associations between smartphone use for communication and better socio-cultural adaptation. Also, smartphone use for information-seeking was associated with higher sociocultural adaptation. Conversely, higher smartphone use for coping with negative emotions was associated with greater feelings of resignation.
Table 3. Means, Standard Deviations, and Correlations for the Core Constructs of Study 2a.
|
Variable |
M |
SD |
1 |
2 |
3 |
4 |
5 |
|
1. Communication |
3.11 |
1.04 |
— |
— |
— |
— |
— |
|
2. Information |
3.55 |
1.00 |
.33** [.12, .52] |
— |
— |
— |
— |
|
3. Emotional regulation |
2.73 |
1.04 |
.22 [−.01, .42] |
.21 [−.02, .41] |
— |
— |
— |
|
4. Pre-arrival use |
1.83 |
0.98 |
.30** [.08, .49] |
.39*** [.18, .57] |
.10 [−.13, .32] |
— |
— |
|
5. Resignation |
2.04 |
0.72 |
−.06 [−.28, .17] |
−.19 [−.40, .04] |
.34** [.12, .52] |
−.14 [−.36, .09] |
— |
|
6. Socio-cultural adaptation |
3.45 |
0.70 |
.44*** [.22, .62] |
.38** [.15, .57] |
.14 [−.11, .37] |
.11 [−.13, .35] |
−24* [−.45, −.01] |
|
Note. *p < .05, **p < .01, ***p < .001. 95% CI values between brackets. |
|||||||
To examine this relationship, we ran a path analysis specifying the Pre-arrival use, Communication, Information, and Emotional regulation factors as predictors of the two outcomes of socio-cultural adaptation and resignation. Results are reported in Figure 2, and the full set of path coefficients is reported in Appendix Table A9. Results revealed that Emotional regulation was significantly associated with higher resignation. Additionally, Communication was found to be significantly linked to socio-cultural adaptation. Although, Information and Pre-arrival use were not linked to any of the two outcomes.
Figure 2. Results of Study 2a.
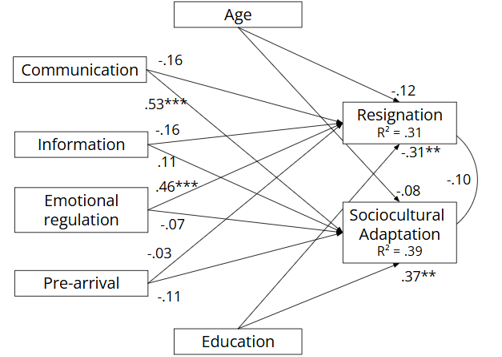
Note. Standardized coefficients. *p < .05, **p < .01, ***p < .001.
Discussion
Study 2a served as an exploratory pilot to examine how distinct patterns of smartphone usage during the migration journey are associated with socio-cultural adaptation and resignation. By identifying four usage factors, Pre-arrival use, Communication, Information, and Emotional regulation, we sought to uncover the diverse roles smartphones play in addressing both practical and emotional needs during migration.
The findings suggest that communication via smartphones was positively associated with socio-cultural adaptation, emphasizing the importance of maintaining and building social connections. However, the positive link between emotional regulation and resignation indicates a more complex relationship between smartphone use and well-being. Greater reliance on smartphones for coping is associated with higher levels of helplessness; yet, it is equally plausible that individuals experiencing higher levels of depression, helplessness, or low self-worth turn to smartphones for emotional regulation.
The exploratory nature of this study highlights the intricate impact of smartphones on migrant experiences and provides a foundation for the more robust analyses conducted in Study 2b.
Study 2b
Study 2b sought to replicate the findings of Study 2a with a larger sample of immigrants. The primary objectives were to test whether (a) the smartphone usage scale retained a similar four-component structure as identified in Study 2a and (b) the associations between the four components and the outcomes of resignation and socio-cultural adaptation could be replicated in a similar population. While the general hypothesis across studies predicts that greater smartphone use for communication, information access, and emotional support is associated with higher physical, psychological and social well-being, Study 2b also formulates a specific hypothesis based on the results of Study 2a: that greater smartphone use for emotional regulation would be associated with increased resignation, while higher use of smartphones for communication would be linked to improved socio-cultural adaptation.
Method
Participants
A convenience sample of 212 participants took part in the study, with 199 responding to smartphone-related questions and 174 owning a smartphone. All descriptive information regarding the sample is summarized in Table 1.
Participants were primarily recruited from state-run hosting centers for asylum seekers and refugees in Northern Italy. Other participants were drawn from two organizations focused on teaching Italian. Additionally, some participants had already completed the reception process and were living independently. Data were collected in group sessions held within migrant hosting centers, with the support of available cultural and linguistic mediators. All participants completed the same self-reported questionnaire used in Study 2a. Data collection took place between March and September 2023.
Measures
Smartphone Usage Scale. In this study, we re-examined the same initial Smartphone Usage Scale item pool used in Study 2a. The PCA yielded a final 25-item solution; unlike in Study 2a, SM23 was retained. The scale assessed the frequency of smartphone use across different stages of the migratory journey: pre-departure, during the journey, and upon arrival in Italy. A principal component analysis confirmed the presence of four distinct factors, consistent with Study 2a. The first factor, Pre-arrival use, showed loadings ranging from .50 to .81 and a Cronbach’s alpha of .93. The second factor, Communication, had loadings between .50 and .78 and a Cronbach’s alpha of .81. The third factor, Information, showed factor loadings ranging from .57 to .71 and a Cronbach’s alpha of .80. Finally, the fourth factor, Emotional regulation, had loadings from .74 to .89 and Cronbach's alpha = .86. Overall, these factors collectively explained 64% of the variance in smartphone use, and the scale showed good internal consistency with a Cronbach’s alpha of .88. Factor scores were computed by averaging the items related to each factor. For transparency, the full set of items and their factor loadings is reported in Appendix Table A4.
Socio-Cultural Adaptation. The revised Socio-cultural Adaptation Scale by Wilson et al. (2017) was used to measure socio-cultural adaptation. A principal component analysis suggested that the items loaded onto a single factor explaining 43% of the variance (loadings’ range: λ = .28–.77; Cronbach’s α = .86). We averaged the 11 items into an overall index, with higher levels indicating greater socio-cultural adaptation.
Resignation. In Study 2b we measured the four components of resignation using a reduced set of items to reduce participant fatigue compared to Study 2a. Depression was measured with three items from the Depression-Anxiety-Stress Scale (Bottesi et al., 2015). Unworthiness was assessed with three items from the Rosenberg Self-Esteem Scale (Rosenberg, 1965). Alienation was measured using three items from the Social Connectedness Scale—alienation subscale (Lee & Robbins, 1995). Helplessness was captured using two items from the Beck Depression Inventory (Beck et al., 1996) and one item from the Beck Hopelessness Scale (Beck et al., 1974). Participants rated their agreement with these items over the past three months using a 5-point Likert scale
(1 = not at all, 5 = extremely). After conducting a principal component analysis, we found that one item (SE1R) from the Unworthiness scale did not load well and was excluded. The final analysis suggested that the remaining items loaded onto a single factor, accounting for 48% of the variance (loadings ranged from λ = .50 to .76; Cronbach’s α = .89). A composite resignation index was calculated by averaging the scores across all dimensions, with higher scores indicating greater resignation. Descriptive statistics and correlations are presented in Table 4.
Results
Correlational analyses revealed that the use of a smartphone to regulate negative emotions was associated with higher levels of resignation. Moreover, Information was associated with higher socio-cultural adaptation.
Table 4. Means, Standard Deviations, and Correlations for the Core Constructs of Study 2b.
|
Variable |
M |
SD |
1 |
2 |
3 |
4 |
5 |
|
1. Communication |
3.94 |
0.99 |
— |
— |
— |
— |
— |
|
2. Information |
3.64 |
0.98 |
.45*** [.32, .56] |
— |
— |
— |
— |
|
3. Emotional regulation |
3.29 |
1.21 |
.33*** [.19, .45] |
.26*** [.12, .39] |
— |
— |
— |
|
4. Pre-arrival use |
2.65 |
1.14 |
.35*** [.21, .48] |
.37*** [.23, .50] |
.21** [.05, .35] |
— |
— |
|
5. Resignation |
2.13 |
0.89 |
−.06 [−.20, .09] |
−.01 [−.15,.14] |
.17* [.02, .31] |
−.02 [−.18, .13] |
— |
|
6. Socio-cultural adaptation |
3.60 |
0.90 |
.13 [−.02, .27] |
.18* [.03, .32] |
.06 [−.09, .20] |
.05 [−.11, .20] |
−20* [−.32, −.06] |
|
Note. *p < .05, **p < .01, ***p < .001. 95% CI values between brackets. |
|||||||
To examine this relationship, we ran a path analysis specifying the Pre-arrival use, Communication, Information, and Emotional regulation factors as predictors of the two outcomes of socio-cultural adaptation and resignation. Results are reported in Figure 3, and the full set of path coefficients is reported in Appendix Table A10.
Results revealed that Emotional regulation was significantly associated with higher resignation. Moreover, Communication was marginally linked to resignation.
Instead, Pre-arrival use was not significantly linked to either resignation and socio-cultural adaptation. Similarly, Information was not significantly connected with Resignation.
Discussion
The findings from Study 2b provide valuable insights into the multifaceted role smartphones play in migrants' lives. Expanding on the results of Study 2a, which identified patterns of smartphone use linked to socio-cultural adaptation and resignation, Study 2b replicated these findings with a larger sample of immigrants. The exploratory factor analysis confirmed the four patterns of smartphone use identified in Study 2a: (1) pre-arrival use, (2) communication, (3) information, and (4) emotional regulation. These categories emphasize the dual role of smartphones in addressing both practical and emotional needs during migration.
Correlational analyses revealed that using smartphones for emotional regulation was positively associated with resignation, echoing the findings of Study 2a. This suggests that while smartphones can provide short-term emotional relief, reliance on them for managing negative emotions may contribute to a deeper sense of resignation over time. Conversely, smartphone use for information was positively correlated with socio-cultural adaptation, reinforcing the importance of leveraging technology to build social networks and access critical resources in the host country.
Figure 3. Results of Study 2b.
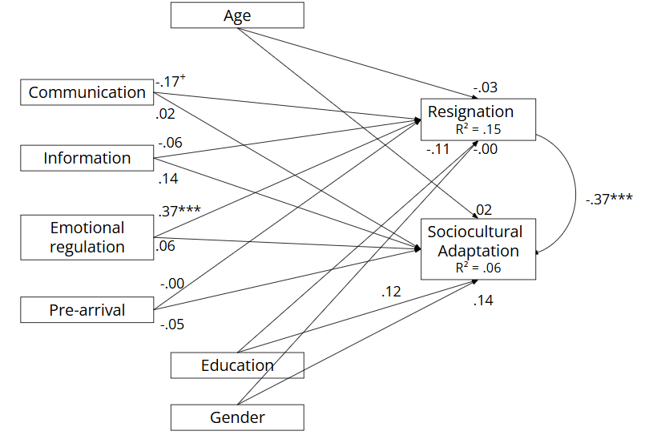
Note. Standardized coefficients. +p < .09, *p < .05, **p < .01, ***p < .001.
Correlational analyses revealed that using smartphones for emotional regulation was positively associated with resignation, echoing the findings of Study 2a. This suggests that while smartphones can provide short-term emotional relief, reliance on them for managing negative emotions may contribute to a deeper sense of resignation over time. Conversely, smartphone use for information was positively correlated with socio-cultural adaptation, reinforcing the importance of leveraging technology to build social networks and access critical resources in the host country.
Path analysis confirmed the strong link between emotional regulation via smartphones and resignation, highlighting potential limitations in fostering long-term emotional resilience. In contrast, the effect of information-seeking on sociocultural adaptation was not significant, mirroring the pattern observed in Study 2a. This suggests that, within Studies 2, informational smartphone use may play a less central role in facilitating migrants’ sociocultural adjustment than initially expected. This finding differs from Study 1, where information-oriented smartphone use was significantly associated with better sociocultural adaptation. One possible explanation for this discrepancy lies in the different operationalizations of smartphone use across studies. Whereas Study 1 focused on broad categories of smartphone applications, Studies 2a and 2b examined how smartphones are used for specific purposes across different phases of the migratory journey. This difference may capture more context-dependent forms of smartphone use that are not directly comparable with the more general patterns assessed in Study 1.
One notable difference from Study 2a was the absence of a significant relationship between smartphone use for communication and socio-cultural adaptation in Study 2b. This lack of replication should be interpreted in light of important structural differences between the two samples. Study 2a included only forced migrants and no female participants, whereas Study 2b comprised both forced and voluntary migrants and a substantially higher proportion of women. These systematic differences in sample composition limit the direct comparability of the two studies. In addition, some portion of the discrepancy may also reflect random variability not accounted for in the study design. It is also possible that the effect observed in Study 2a is not robust enough to generalize across different samples. Therefore, the finding that communication relates to higher socio-cultural adaptation should be interpreted with particular caution.
By contrast, Study 2b revealed a marginal negative association between communicative smartphone use and resignation, a pattern that will also emerge in Study 3 with people experiencing homelessness. These findings suggest that communicative smartphone use may offer a buffer against psychological distress by maintaining connections with supportive others, even in contexts marked by severe social or economic marginalization. However, future studies are needed to confirm the robustness of this effect.
Finally, Study 2a differed from the other studies in that the relationship between resignation and socio-cultural adaptation was not significant in its final model. By contrast, in the other studies where adaptation was assessed (Studies 1 and 2b), it was consistently associated with well-being indicators. This pattern further suggests that the findings of Study 2a may be more exploratory and less stable, likely reflecting its pilot and preliminary nature.
Study 3
In Study 3 we broaden our investigation by considering another marginalized social group: people experiencing homelessness. Building on our previous work with migrants, we aim to explore how different patterns of smartphone use among people experiencing homelessness relate to their levels of physical and psychological well-being, operationalized with perceived physical health, and resignation, respectively. Importantly, we do not assume that the patterns observed among migrants necessarily generalize to this population, as different forms of social exclusion may shape the function of smartphone use in distinct ways. Prior research shows that smartphones help people experiencing homelessness obtain essential resources (e.g., health care, transport), keep social ties that boost self-esteem and curb isolation, and deliver emotional support for stress, depression, and anxiety (e.g., Adkins et al., 2017; Raven et al., 2018; Thurman et al., 2021). Although direct evidence on physical health or resignation outcomes is scarce, these findings provide a solid rationale for exploratory, theory-based testing. We therefore hypothesized that more frequent smartphone use for communication, information-seeking, and emotional regulation would be associated with better physical health and reduced resignation. Additionally, we aim to identify which specific smartphone usage patterns are most strongly linked to these outcomes, with the goal of generating hypotheses for future research and intervention design.
Method
Participants
The convenience sample of people experiencing homelessness comprised 91 participants, of whom 87 responded to questions about smartphone use. Of these, 71 owned a smartphone. All descriptive information regarding the sample is summarized in Table 1.
People experiencing homelessness were recruited through various associations that provide services to this population. These associations facilitated access to participants either in their facilities or during street outreach activities. Data were collected using paper-and-pencil questionnaires administered by trained research assistants. Data collection took place between June and December 2021 in Northern Italy.
Measures
Smartphone Usage Scale. An ad hoc 12-item scale was developed based on the smartphone usage scale used in Study 2a–2b. The 12 items assessed the frequency of smartphone use for various activities such as maintaining contact with family, friends, other people experiencing homelessness, and searching for work or housing. Participants rated each function on a scale from 1 (never) to 5 (almost always). A principal component analysis identified three factors: Communication, Information, and Emotional Regulation, which explained 63% of the variance. The Communication factor included four items related to communicating with family, friends, other people experiencing homelessness, and new acquaintances (factor loadings: λ = .67–.78; Cronbach’s α = .73). The Information factor comprised four items related to searching for services, employment opportunities, and housing (factor loadings: λ = .64–.88; Cronbach’s α = .78). The Emotional Regulation factor included four items related to managing negative emotions (factor loadings: λ = .70–.92; Cronbach’s α = .87). Factor scores were calculated by averaging the related items, with the overall scale showing a Cronbach's alpha of .81. For transparency, the full set of items and their factor loadings is reported in Appendix Table A5.
Physical Health. Health was assessed using the Perceived General Health subscale of the SF-36
(Ware & Sherbourne, 1992), which consists of four items measuring individuals' overall health perceptions. Responses were rated on a 5-point scale (1 = definitely false,
5 = definitely true). A principal component analysis revealed a single factor accounting for 47% of the variance (factor loadings: λ = .59–.81; Cronbach’s α = .62). The items were averaged into an index, with higher scores indicating better perceived health.
Resignation. To assess resignation, we measured its four associated dimensions: depression, unworthiness, alienation, and helplessness, using the same reduced-item approach as in Study 2b (see Study 2b for details of the scales used). After conducting a principal component analysis, we found that item (SE1R) from the Unworthiness scale did not load well and was excluded. The final analysis revealed that the remaining items loaded onto a single factor, accounting for 49% of the variance (loadings ranged from
λ = .22 to .84; Cronbach’s α = .90). Descriptive statistics and correlations are presented in Table 5.
Results
Correlational analyses are shown in Table 5. These analyses revealed a positive correlation between using a smartphone to communicate with others and physical health. Furthermore, using a smartphone to regulate negative emotions was found to be positively associated with resignation.
To examine this relationship, we ran a path analysis specifying the Communication, Information and Emotional regulation factors as predictors of the two outcomes of physical health and resignation. Results are reported in Figure 4, and the full set of path coefficients is reported in Appendix Table A11.
Table 5. Means, Standard Deviations, and Correlations for the Core Constructs of Study 3.
|
Variable |
M |
SD |
1 |
2 |
3 |
4 |
5 |
|
1. Communication |
2.41 |
1.00 |
— |
— |
— |
— |
— |
|
2. Information |
2.88 |
1.15 |
.40*** [.18, .58] |
— |
— |
— |
— |
|
3. Emotional regulation |
2.45 |
1.24 |
.27* [.04, .48] |
.16 [−.08,.38] |
— |
— |
— |
|
4. Resignation |
2.41 |
0.93 |
−.03 [−.26, .21] |
.20 [−.04,.42] |
.62*** [.45, .74] |
— |
— |
|
5. Physical Health |
3.53 |
0.85 |
.24* [.01, .45] |
.02 [−.21,.26] |
−.04 [−.27, .20] |
−.29* [−.49, −.06] |
— |
|
Note. *p < .05, **p < .01, ***p < .001. 95% CI values between brackets. |
|||||||
Results revealed that Communication was associated with lower resignation and showed a marginal positive association with physical health. Additionally, Emotional regulation was associated with higher resignation and exhibited a marginal negative association with physical health. Information was not significantly associated with either of the two outcomes.
Figure 4. Results of Study 3.
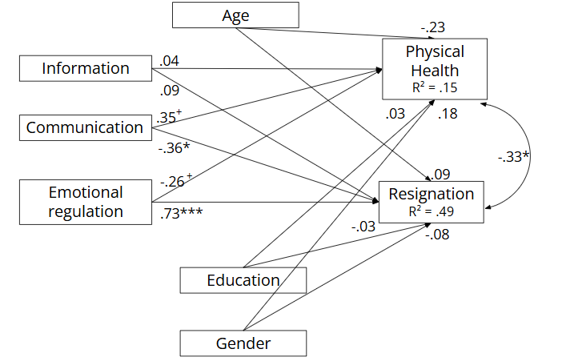
Note. Standardized coefficients. +p < .09, *p < .05, **p < .01, ***p < .001.
Discussion
Study 3 investigates the relationships between distinct patterns of smartphone use and both resignation and physical health outcomes among individuals experiencing homelessness. We measured smartphone use across three primary functions—communication, information-seeking, and emotional regulation—aiming to understand their distinct effects on this marginalized group. The findings, derived from correlational and path analyses, offer preliminary insights into the role of smartphone use in shaping these outcomes.
The factor analysis identified two consistent functions of smartphone use: communication and information-seeking. The path analysis revealed that smartphone use for communication was significantly associated with lower levels of resignation and marginally associated with better physical health. This is consistent with the idea that maintaining social connections through smartphones is associated with better psychological well-being and, to a lesser extent, physical well-being among people experiencing homelessness, aligning with research on the health benefits of social interaction (Baumeister & Leary, 1995). Differently, information-seeking via smartphones was not associated with either resignation or physical health. This indicates that, although smartphones facilitate access to information, the lack of actionable resources or social and structural support may limit the effectiveness of information-seeking as a coping strategy.
Additionally, emotional regulation emerged as a third factor in the analysis. As in Studies 2a and 2b, using smartphones for emotional regulation was linked to increased resignation, suggesting a correlation between reliance on smartphones to manage negative emotions and poorer long-term psychological well-being. In this study, such use was also marginally associated with poorer physical health. This finding may indicate that the negative implications of the use of smartphones for emotional regulation could extend to physical health among people experiencing homelessness, potentially because this is linked to unhealthy behaviors like reduced sleep or a sedentary lifestyle in place of more adaptive coping strategies. Alternatively, it may be that people with poorer health tend to use smartphones more for emotional regulation. However, this interpretation should be considered with caution given the marginal nature of the association.
In summary, the findings highlight the dual-edged nature of smartphone use. While communication via smartphones was associated with lower resignation, the use of smartphones for emotional regulation appears to be associated with negative psychological outcomes and, to a lesser extent, poorer physical health.
Study 4
In Study 4, the focus shifts to prisoners, a uniquely marginalized group. Unlike other populations, incarcerated individuals face absolute digital exclusion due to systemic restrictions on access to digital technologies. This context precluded any investigation of how digital technologies might support or hinder well-being. However, it provided a compelling and extreme case to explore the implications of complete technological deprivation.
Building on prior research highlighting the detrimental effects of digital exclusion on well-being during incarceration (e.g., Palmer et al., 2020; Reisdorf & Jewkes, 2016; Reisdorf & Rikard, 2018), this study explores the relationship between the perception of digital exclusion, defined by limited access to technology and the inability to utilize digital resources, and the psychological and physical well-being of prisoners. We hypothesize that higher levels of perceived digital exclusion will be associated with poorer physical health and greater resignation, reflecting the well-documented costs of technology deprivation. Additionally, we aim to identify the specific dimensions of digital exclusion most strongly associated with these negative outcomes.
Method
Participants
A convenience sample of 219 prisoners from five different male prisons in Italy participated in the study. All descriptive information regarding the sample's demographic is summarized in Table 1. After giving informed consent, participants completed a self-reported paper-and-pencil questionnaire. Data collection took place between May 2022 and September 2023.
Measures
Digital Exclusion. We developed two specific scales for this study to assess different aspects of digital exclusion within prison environments: the Perceived Deprivation Scale (9 items) and the Perceived Impediment Scale (10 items). The Perceived Deprivation Scale focuses on how prisoners perceive their disadvantage compared to individuals outside of prison due to limited access to digital technologies. A principal component analysis (PCA) of this scale revealed two distinct factors. The first factor, Access Deprivation, reflects the sense of being deprived of access to essential technologies such as the internet, smartphones, and social media, with factor loadings ranging from
λ = .48 to .92 (Cronbach’s α = .87). The second factor, Ability Deprivation, captures participants’ perceived inability to effectively use digital technologies, particularly the internet and its resources, with loadings ranging from λ = .57 to .87 (Cronbach’s α = .64). The two-factor solution explained 62% of variance. The Perceived Impediment Scale examines the broader impact of digital exclusion on various aspects of life, such as limiting personal potential, access to critical information, fulfilling social needs, and providing opportunities for growth and learning. A PCA of this scale identified a single factor, Digital Technology Impediment, which encompasses feelings that digital exclusion hinders professional development, access to vital information, and overall social and personal functioning, with factor loadings ranging from λ = .59 to .81 (Cronbach’s α = .90). The one-factor solution explained 55% of the variance. For transparency, the full set of items and their factor loadings of both scales are reported in Appendix Table A6 and A7.
Physical Health. Health was assessed using the Perceived General Health subscale of the SF-36 (Ware & Sherbourne, 1992), which includes four items measuring individuals' overall health perceptions. After removing one poorly loading item, the remaining three items loaded onto a single factor, explaining 63% of the variance (loadings’ range:
λ = .78–.82; Cronbach’s α = .71). Higher scores indicated better perceived health.
Resignation. Resignation was measured using the same reduced-item approach of Studies 3 & 4 covering four outcomes: depression (three items), unworthiness (three items), alienation (three items), and helplessness (two items from the Beck Depression Inventory, and one from the Beck Hopelessness Scale). A principal component analysis revealed a single factor explaining 48% of the variance (loadings’ range: λ = .31–.81; Cronbach’s α = .90). A composite resignation index was created by averaging the scores, with higher scores indicating greater resignation.
Results
Correlational analyses (refer to Table 6) indicated a positive correlation between resignation and both access deprivation and ability deprivation. Additionally, a negative correlation emerged between ability deprivation and physical health. Digital Technology Impediment was also positively associated with resignation and negatively associated with physical health.
Table 6. Means, Standard Deviations, and Correlations for the Core Constructs of Study 4.
|
Variable |
M |
SD |
1 |
2 |
3 |
4 |
5 |
|
1. Resignation |
2.31 |
0.86 |
— |
— |
— |
— |
— |
|
2. Physical Health |
4.09 |
0.91 |
−.39*** [−.50, −.27] |
— |
— |
— |
— |
|
3. Digital technology impediment |
2.73 |
1.01 |
.40*** [.27, .51] |
−.32*** [−.44, −.19] |
— |
— |
— |
|
4. Ability deprivation |
2.12 |
1.06 |
.32*** [.18, .44] |
−.22*** [−.35, −.08] |
.26*** [.12, .39] |
— |
— |
|
5. Access deprivation |
2.59 |
1.23 |
.17* [.03, .30] |
−.08 [−.22, .06] |
.52*** [.41, .61] |
.13 [−.01, .26] |
— |
|
Note. *p < .05, **p < .01, ***p < .001. 95%. CI values between brackets. |
|||||||
To further test these associations, we ran a path analysis specifying Digital technology impediment, Ability deprivation and Access deprivation as predictors of the two outcomes of physical health and resignation. Results are reported in Figure 5, and the full set of path coefficients is reported in Appendix Table A12.
Results revealed that Digital technology impediment was significantly associated with both resignation and physical health. Additionally, Ability deprivation was found to be significantly linked to resignation and to physical health. Access deprivation was not significantly connected to either resignation and physical health.
Figure 5. Results of Study 4.
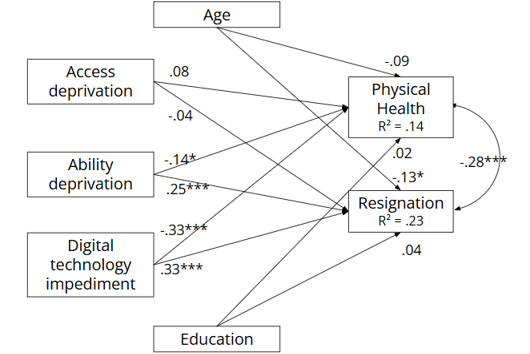
Note. Standardized coefficients. *p < .05, **p < .01, ***p < .001.
Discussion
Study 4 examined how digital exclusion is associated with prisoners' physical health and resignation, perhaps intensifying their marginalization. Through exploratory factor analyses of the Perceived Deprivation Scale and the Perceived Impediment Scale, three distinct components were identified: Access Deprivation (barriers to basic technology access), Ability Deprivation, (limited digital skills), and Digital Technology Impediment (perceived negative impact on social, educational, and professional integration). These findings build on first- and second-level digital divide frameworks (Norris, 2003; Van Deursen & Van Dijk, 2011), showing that digital exclusion extends beyond access to include skills and broader life consequences.
A key finding of our study is the positive association between resignation and all identified components of digital exclusion. The path analysis further elucidated these relationships, showing that both Digital technology impediment and Ability deprivation are significantly associated with resignation. These associations may reflect that perceiving oneself as digitally constrained or technologically incapable is linked to greater feelings of resignation, possibly reflecting increased feelings of helplessness within the prison environment.
Additionally, a negative relationship was found between both Ability deprivation and Digital technology impediment and physical health. The path analysis confirmed that both factors are associated with poorer physical health outcomes. This may indicate that digital exclusion limits access not only to information but also to resources that support health maintenance, such as health-related knowledge, services, and communication channels. For instance, limited access to digital tools may prevent incarcerated individuals from staying informed about health guidelines or accessing health-promoting resources, thereby indirectly affecting their physical well-being.
These findings can be further understood in light of prior research showing that restricted digital access in correctional facilities constrains communication, education, and personal development opportunities (Farley & Hopkins, 2017; Hofinger & Pfegerl, 2024; Reisdorf & Jewkes, 2016). Such constraints are particularly relevant for reintegration processes, as individuals are often released without sufficient digital literacy to navigate increasingly technology-dependent systems (Farley & Hopkins, 2017; Reisdorf & Jewkes, 2016). From this perspective, the negative association between digital exclusion and both resignation and health may reflect not only immediate functional limitations, but also a cumulative process in which prolonged exclusion reduces opportunities for social participation, autonomy, and access to essential resources. Moreover, limitations in digital communication may weaken prisoners’ ability to maintain contact with family and friends, thereby reducing emotional support and reinforcing social isolation (Imandeka et al., 2024; Johnson, 2013). This social dimension is particularly relevant for understanding resignation, as reduced interpersonal connection may contribute to feelings of detachment and diminished future orientation. Similarly, exclusion from digital information flows, such as updates on health guidelines, public services, or institutional procedures (Watts & Erdman, 2020), may further exacerbate both perceived vulnerability and a sense of disconnection from the broader social environment. In this sense, digital exclusion may contribute to subjective experiences of being “second-class citizens” in an increasingly digital society (Imandeka et al., 2024), reinforcing both psychological withdrawal and perceived health vulnerability.
In contrast, Access deprivation was not significantly related to physical health, either in correlational analyses and the path model, nor to resignation in the path model. This suggests that lack of access alone is less impactful than the perceived inability to use technology effectively.
Overall, Study 4 extends existing literature by demonstrating that digital exclusion in prison contexts is a multidimensional phenomenon with distinct psychological and health-related correlates. The findings highlight the importance of moving beyond access-based interventions and addressing digital skills and perceived competence as key components of digital inclusion strategies in correctional settings.
General Discussion
This research investigated how smartphone use and digital exclusion are associated with some measures of physical, psychological, and social well-being of marginalized populations, focusing on migrants, people experiencing homelessness, and prisoners. Across five studies, distinct patterns of smartphone use and digital exclusion emerged, offering insights into the dual role of technology as a resource for integration and a potential source of exclusion. Table 7 summarizes the path analysis results across the five studies.
Patterns of Smartphone Use and Digital Exclusion Across Studies
The findings revealed common themes in smartphone use among marginalized groups. Migrants and people experiencing homelessness consistently relied on smartphones for three primary functions: communication, information access, and emotional regulation. Migrants predominantly used communication apps to maintain ties with loved ones in their home countries, while people experiencing homelessness used similar functions to build and sustain connections with local networks, including peers and support services. Both groups also relied on smartphones for information-seeking, such as accessing resources like housing, employment, and healthcare. For migrants, these efforts extended to connecting with local Italians, reflecting a proactive drive toward integration. Their digital behavior was often more instrumental, aimed at navigating systems and accessing new opportunities. In contrast, people experiencing homelessness’ use of smartphones was more relational, focused on preserving existing relationships and fostering emotional support. Finally, smartphones, in both cases, were also used for emotional regulation, helping them manage negative emotions.
Study 4 focused on digital exclusion in prisons, where the absence of digital technologies created a unique scenario of total deprivation. Prisoners experienced digital exclusion not just as a lack of access but as an acute sense of being left behind in a digitally connected world. This deprivation has specific dimensions such as Ability Deprivation (lack of digital skills) and Digital Technology Impediment (perceived barriers to social and professional integration).
The observed patterns of smartphone use and digital exclusion align with existing literature while adding new insights into the experiences of marginalized populations. Research highlights smartphones as critical tools for maintaining connections and accessing resources during the migration process, spanning pre-departure planning, the journey itself, and settlement in the host country (Mallett, 2022). Migrants frequently use smartphones to stay connected with their home countries and access essential information to facilitate integration, such as resources for housing and employment (Dekker & Engbersen, 2014; Lorenzana, 2016). Similarly, studies on homelessness emphasize the importance of smartphones for maintaining social connections and providing emotional support, helping individuals without stable housing stay in touch with family and friends and cope with loneliness (Leinen, 2017; Thurman et al., 2021).
Table 7. Comprehensive Summary of the Key Results Across the Five Studies. Predictors Measured
in Each Study Are Reported in Rows, Outcomes in Columns.
|
|
|
Physical |
Psychological well-being indicators |
Social |
|
|
Basic needs satisfaction |
Resignation |
||||
|
Study 1 (migrants) |
Communication |
ns. |
ns. |
|
ns. |
|
Information |
+ |
+ |
|
+ |
|
|
Study 2a (migrants) |
Communication |
|
|
ns. |
+ |
|
Information |
|
|
ns. |
ns. |
|
|
Emotional regulation |
|
|
+ |
ns. |
|
|
Pre-arrival use |
|
|
ns. |
ns. |
|
|
Study 2b (migrants) |
Communication |
|
|
−* |
ns. |
|
Information |
|
|
ns. |
ns. |
|
|
Emotional regulation |
|
|
+ |
ns. |
|
|
Pre-arrival use |
|
|
ns. |
ns. |
|
|
Study 3 (homeless people) |
Communication |
+* |
|
− |
|
|
Information |
ns. |
|
ns. |
|
|
|
Emotional regulation |
−* |
|
+ |
|
|
|
Study 4 (prisoners) |
Access deprivation |
ns. |
|
ns. |
|
|
Ability deprivation |
− |
|
+ |
|
|
|
Digital technology impediment |
− |
|
+ |
|
|
|
Note. * = marginally significant relationship; + = positive significant relationship; − = negative significant relationship; ns. = not significant (i.e., effects with p-value > .09). |
|||||
Beyond these immediate functions, the findings of this research can also be interpreted through the lens of digital capital (Ragnedda, 2018), a concept that complements Van Dijk’s framework. Digital capital refers to the accumulation of digital competencies and access, which individuals can leverage to achieve social inclusion, economic advancement, and personal development. Our results suggest that while smartphones offer marginalized individuals critical tools for accessing resources and maintaining connections, disparities in digital skills and agency influence the extent to which these technologies can be effectively converted into broader social or economic benefits. Future research should more systematically examine how digital capital is built, deployed, and sustained among marginalized groups, and how it moderates the relationship between digital engagement and well-being. Beyond social connection, smartphones are often employed to manage internal states, distract from stressors, or regulate negative emotions. This aligns with the Compensatory Internet Use Theory (Kardefelt-Winther, 2014), which posits that individuals turn to digital tools to address offline deficits. For example, Pancani et al. (2020) found that smartphones are frequently used to manage stress and escape unpleasant emotions, while Grellhesl and Punyanunt-Carter (2012) noted that "relaxation and escape" are prominent motivations for texting. Similarly, Panova and Lleras (2016) showed that smartphone use can initially reduce stress following anxiety-inducing events. However, the studies show an association between over-reliance on digital tools for emotional regulation and indicators of frustration and resignation among migrants and people experiencing homelessness. While this could suggest that such usage contributes to negative feelings, it is also possible that individuals turn to their phones more when experiencing frustration or low well-being.
For incarcerated populations, this study provides valuable contributions by conceptualizing digital technology deprivation as a multidimensional phenomenon that extends beyond mere access to include both skill-related limitations and differences in how technologies are used to support social and functional participation. This pattern aligns with and extends existing frameworks on first- and second-level digital divides (Norris, 2003; Van Deursen & Van Dijk, 2011), suggesting that even when access is available, the ability to effectively use digital tools and derive meaningful benefits remains uneven. The present findings further refine this perspective by showing that the psychological and functional implications of digital inequality are closely tied to how individuals experience and internalize these constraints. In this sense, the identification of Ability Deprivation and Digital Technology Impediment highlights that the absence of digital engagement can be experienced not only in material terms, but also as a subjective sense of being left behind in an increasingly digitalized world. These findings extend existing literature by demonstrating that, in highly restrictive environments, digital exclusion goes beyond access deprivation to encompass perceptions of inadequacy and limited agency. This is particularly relevant given that correctional settings often provide minimal opportunities to engage with digital technologies (Hofinger & Pfegerl, 2024; Reisdorf & Jewkes, 2016), thereby amplifying the challenges associated with social reintegration and access to essential resources.
Impact on Physical, Psychological, and Social Well-Being
The findings from the studies converge around three macro-dimensions of well-being—physical, psychological, and social—revealing both shared patterns and notable divergences across the groups studied.
In terms of physical well-being, smartphone use may be associated with access to essential resources. Results from Study 1 showed that migrants, for example, might benefit from information-seeking behaviors that can help them access healthcare, and employment, with potential beneficial effects for their physical health. However, for people experiencing homelessness, the relationship between information-seeking and physical well-being was not statistically significant. This difference may suggest that, despite similar efforts to access information, structural barriers or limited service availability may prevent these behaviors from translating into tangible well-being benefits for people experiencing homelessness. Furthermore, it is also possible that information-seeking among this group is contingent on negative events and driven by urgent needs rather than strategic health-related goals. Additionally, among people experiencing homelessness, the use of smartphones for emotional regulation was marginally associated with negative outcomes for physical health. This may be due to the passive nature of emotional regulation through digital distractions, which may provide a temporary alleviation of distress without addressing the root causes of psychological or physical suffering. It is possible that smartphone-based emotional coping could replace healthier coping strategies, for instance by disrupting sleep or inducing a sedentary life-style, with ultimate negative repercussions for physical health (Kushlev & Leitao, 2020). At the same time, smartphone use for communication also exhibited a marginal association with physical health. One possible explanation for this finding lies in the well-established link between social connection and health outcomes. Even in contexts of severe marginalization, maintaining interpersonal contact through smartphones may positively influence health. However, the marginal nature of this association suggests that these benefits may be limited or indirect. In the context of homelessness, structural constraints, such as limited access to healthcare, unstable living conditions, or lack of material resources, may attenuate the extent to which social connectivity can translate into tangible physical health improvements. Thus, while communication via smartphones may represent a relatively adaptive coping strategy, its impact on physical health may remain modest unless supported by broader social and structural resources.
Psychological well-being emerged as another critical dimension associated with smartphone use and digital exclusion. In line with Williams’ (2009) model of social exclusion, which posits that chronic threats to fundamental psychological needs, such as belonging, self-esteem, control, and meaningful existence, may culminate in resignation, the present findings suggest that distinct patterns of smartphone use are differentially associated with basic need satisfaction and resignation. Emotional regulation through smartphones was consistently associated with higher resignation. Given the cross-sectional nature of the data, it is unclear whether smartphone use contributes to resignation or whether individuals experiencing more resignation tend to use smartphones for emotional support. Migrants and people experiencing homelessness both relied on smartphones to manage stress and negative emotions, but this pattern may reflect either reliance on smartphones during periods of distress or the possibility that such use is associated with less effective coping over time. While smartphones may temporarily alleviate negative emotions and prevent rumination (Riva, 2016), research shows that over-reliance on this strategy often leads to long-term frustration and worsened psychological states (Shi et al., 2023). This aligns with the “security blanket effect” (Panova & Lleras, 2016), where smartphones provide initial comfort but hinder the development of healthier coping mechanisms. Conversely, the relationship between smartphone use for information-seeking and migrants' psychological well-being was not as straightforward. In Study 1, a positive association was found, with the use of specific apps for information-seeking seen as efforts to reduce resource gaps and foster a sense of stability. However, in Studies 2a and 2b, this association did not replicate and was found to be non-significant. This shift may be attributed to a broader conceptualization of smartphone use in these studies, where the focus moved away from specific apps used for information-seeking to a more general understanding of smartphone usage.
This shift may have diluted the psychological relevance of purposeful, goal-directed use. As a result, the link between motivated information-seeking and psychological well-being may have become less visible. For people experiencing homelessness, however, the relationship was different. Communicative use of smartphones was positively associated with higher psychological well-being. This finding suggests that, unlike migrants who may benefit from information-seeking behaviors, people experiencing homelessness derive more psychological benefit from using their smartphones to maintain social connections. Migrants, too, may experience psychological benefits from communicative smartphone use, although to a lesser extent, as reflected in the marginally significant association found in Study 2b. These connections, whether with family, friends, or support networks, can provide a sense of belonging and emotional support, which are critical for coping with the psychological challenges of homelessness. For this group, maintaining social ties and receiving emotional support via communication plays a more significant role in improving mental health. Smartphones help reduce isolation and connect individuals to their support networks, offering both emotional relief and practical assistance, such as shelter or food. As a result, the psychological benefits of smartphone use for people experiencing homelessness are more closely linked to communication than to information-seeking, which is less effective due to limited access to stable resources or their inability to act on the information they find. These patterns of results also suggest the possible specificity of each sample in how smartphone use links to psychological well-being, reflecting the unique contexts and challenges faced by each group.
Prisoners’ experiences highlight how subjective feelings of deprivation and technological incompetence, rather than mere lack of access, undermine psychological and physical well-being. These findings highlight the importance of subjective perceptions of technological deprivation, as inmates compare their circumstances to the outside world, intensifying feelings of exclusion. The social relativity of digital exclusion framework (Helsper, 2017) helps interpret these findings, emphasizing that well-being is influenced not only by absolute deprivation but also by one’s standing relative to others. Prisoners’ awareness of the essential role of digital skills in modern society reinforces their sense of being “left behind”, contributing to anxiety and resignation.
Social well-being appeared to be linked to the communicative and informational functions of smartphones. For migrants, communication apps were primarily used to maintain emotional ties with loved ones in their countries of origin. While these connections provided important emotional support, they were generally less effective in fostering integration into the host society and offered limited practical benefits in everyday life. Indeed, it is reasonable that migrants’ digital close relationships, including those far away in their home countries, might convey little, if any, support to navigate and adjust to the host societal context. Notably, the only study showing a significant association between communicative smartphone use and social well-being was Study 2a, which was exploratory in nature, had the smallest sample size and as such might provide unstable results. Moreover, the sample in Study 2a consisted exclusively of asylum seekers and refugees, whose pronounced vulnerability may lead them to rely more heavily on digital close relationships even for seeking support in adjusting to the host context. In contrast, migrants’ chronic lack of essential resources may make instrumental smartphone use, such as seeking information, more impactful than purely communicative use. Consistent with this idea, Study 1 revealed a positive association between information-oriented smartphone use and social well-being. However, this pattern did not replicate in Studies 2a and 2b. A likely explanation lies in differences in how smartphone use was operationalized. While Study 1 captured broad engagement with information-oriented applications, Studies 2a and 2b focused on specific, context-bound behaviors during settlement in Italy (e.g., searching for a job or housing, or communicating with locals). This narrower focus may have captured situational actions constrained by immediate opportunities, rather than a more general orientation toward instrumental use, thereby weakening its link to overall adaptation. Moreover, although social connections are central to well-being (Baumeister & Leary, 1995), under conditions of severe resource deprivation digital communication may be insufficient to satisfy belonging needs. Language barriers can further limit interactions to similarly marginalized peers or distant ties, reducing access to meaningful support, as such contacts often lack the local integration required to offer effective instrumental or social assistance. In contrast, more general use of applications that provide access to diverse information resources may more directly support social well-being, suggesting that the adaptive value of smartphone use emerges more clearly at a higher level of abstraction than through narrowly defined, situation-specific behaviors.
Together, these findings highlight the nuanced role of smartphones in promoting physical, psychological, and social well-being among marginalized groups. The interplay between context, purpose, and access to resources shapes the outcomes of smartphone use, emphasizing the complexity of its impact on marginalized populations. It is important to note, however, that the observed effect sizes were modest, suggesting that smartphones may provide only partial support rather than substantially transforming the well-being of marginalized individuals. However, in populations with limited access to institutional support or formal inclusion pathways, even modest digital effects may hold meaningful implications for everyday functioning and psychosocial coping. At the same time, we fully acknowledge that digital technologies can reproduce or intensify vulnerabilities. As the data on resignation suggest, emotional regulation via smartphones may reflect not only a coping mechanism but also a signal of distress and structural abandonment. Moreover, while digital tools can help mitigate some barriers to information, communication, and emotional support, they do not address the deeper structural inequalities, such as institutional discrimination, economic precarity, and housing insecurity, that fundamentally shape marginalization. Furthermore, digital inclusion involves not only access to smartphones, but also to a wider range of digital tools, such as laptops, tablets, and e-learning platforms, as well as infrastructural elements like stable internet connections, public Wi-Fi, and the availability of digital services. As such, effective inclusion policies must go beyond simply ensuring device access or promoting adaptive smartphone use; they must also address systemic issues related to connectivity, accessibility, and internet quality, factors that are especially crucial for marginalized communities.
Taken together, these findings speak directly to current debates on digital inclusion by supporting a multidimensional view that goes beyond access to digital devices. In line with digital inequality frameworks (Ragnedda, 2017; Van Dijk, 2020), our results show that smartphones can function as partial inclusion tools, but their benefits depend on how they are used and on the structural constraints faced by marginalized individuals. While digital access enables communication, information seeking, and coping, it does not guarantee positive outcomes across domains of well-being, particularly when digital use reflects emotional compensation or occurs in contexts of severe deprivation. The findings from incarcerated populations further highlight that digital exclusion operates not only through lack of access, but also through subjective perceptions of being left behind in a digital society. Overall, this study reinforces a critical understanding of digital inclusion as a necessary but insufficient condition for social inclusion, underscoring the need to situate digital technologies within broader social and structural inequalities.
Limitations and Future Directions
This research has several limitations. First, the cross-sectional design of the studies precludes causal inferences, leaving the directionality of relationships between smartphone use, digital exclusion, and well-being being uncertain. Longitudinal research is needed to track how these variables evolve over time, assessing the long-term impact of sustained patterns of smartphone use and digital exclusion on marginalized populations.
Second, the reliance on self-reported measures may introduce social desirability and recall biases. Future research could integrate objective indicators of digital behavior, such as usage logs or behavioral assessments, to strengthen measurement accuracy. Additionally, third-party assessments or behavioral observations could complement self-reported data, particularly for populations with limited literacy or digital access.
Another limitation pertains to sample size. In particular, in Studies 2a and 3, the relatively small number of participants—75 migrants and 71 people experiencing homelessness, respectively—may restrict the generalizability of the findings, particularly concerning smartphone ownership within these populations. In addition, the exclusive inclusion of male participants in some studies (2a and 4) restricts generalizability and precludes conclusions about gender differences. In Study 2a, the lack of female participants may have resulted from the recruitment sites (e.g., male-only hosting centers or shelters), while in Study 4 this imbalance is explained by data collection being conducted exclusively in male prisons. Future research should rely on larger, more diverse, and gender-inclusive samples. Furthermore, the use of convenience sampling through service organizations, while necessary to access hard-to-reach populations, limits representativeness. As a result, the findings may not capture the full diversity of experiences, and caution is warranted when generalizing beyond the recruitment contexts.
We also acknowledge that our focus on smartphone use does not fully capture the broader spectrum of digital deprivation. Digital exclusion may also stem from infrastructural barriers (e.g., limited connectivity, lack of access to other devices and structural constraints like state censorship and digital surveillance), which are particularly salient in institutional settings and low-connectivity contexts.
An important theoretical limitation of our study concerns the predominant focus on digital inequality at the level of physical access. While our research explicitly addressed the first-level digital divide, namely, disparities in access to smartphones and digital resources, access alone is insufficient to guarantee genuine inclusion or empowerment. Differences in digital literacy, emotional regulation patterns involving smartphone use, and individuals’ ability to benefit from digital engagement underscore the importance of considering not only access but also skills and outcomes in digital experiences (Van Dijk, 2020). A key limitation of our study is the lack of a detailed assessment of participants’ digital literacy. Higher digital competence likely enables more effective smartphone use for informational and social purposes, with positive effects on well-being and integration. Future research should more systematically examine digital skills and autonomy of use to better capture digital inequality and its implications for well-being. Nevertheless, the risk of socioeconomic bias is partly mitigated in our samples of migrants and people experiencing homelessness, who generally share similar conditions of economic hardship and limited digital access.
A particularly relevant issue is platform-based discrimination: in some cases, digital access may actually heighten vulnerability, especially for migrants engaged in informal or gig economy labor. Future research should examine more closely the intersections between digital exclusion and precarious platform work, in order to understand how these dynamics may reinforce marginalization. Moreover, our findings indicate that second- and third-level digital divides are equally critical for understanding the well-being of socially disadvantaged groups.
While this research focused on migrants, people experiencing homelessness, and prisoners, other marginalized groups, such as elderly individuals, low-income populations, people with disabilities, rural communities, and ethnic minorities, also experience significant digital exclusion. Future research should expand the scope to explore how digital exclusion and smartphone use affect these groups, providing a broader understanding of its impact across diverse populations.
Additionally, the study examined a limited set of variables, overlooking potential moderating or mediating factors. Aspects such as the quality of online interactions and pre-existing mental health conditions may shape the relationship between smartphone use, digital exclusion, and well-being, warranting further investigation.
Cross-cultural studies are also needed to investigate how cultural contexts shape the interaction between marginalized groups and technology, as these contexts may significantly influence the impact of digital exclusion.
Finally, future research should more systematically integrate structural and sociological perspectives on digital inequality. Frameworks such as social capital theory (Bourdieu, 1986) and the network society (Castells, 1996) may help clarify how economic, cultural, and social resources shape individuals’ ability to convert digital access into meaningful social participation. Integrating these perspectives would allow for a more comprehensive understanding of how digital inclusion is embedded within broader dynamics of social inequality.
Finally, the PCA approach was exploratory and aimed to assess item performance in hard-to-reach populations. Although the resulting scales showed acceptable reliability, item removal raises questions about measurement robustness. Future studies should further validate these measures across diverse marginalized groups.
The findings underscore the need for tailored strategies to maximize the benefits of smartphone use while reducing risks. Migrants may benefit from information-oriented approaches to bridge resource gaps, people experiencing homelessness from strengthened local communication networks, and incarcerated individuals from digital literacy training and controlled technology access to support reintegration. Beyond identifying digital disparities, future efforts should evaluate and support targeted initiatives, such as digital literacy programs by the International Organization for Migration (2023) and the Fondo per la Repubblica Digitale (2024)1, as effective models for promoting inclusion among marginalized populations.
Practical Implications
The present findings highlight several actionable implications for different stakeholders:
- For marginalized individuals: Interventions should support not only access to smartphones but also the development of digital skills and the ability to use technology in goal-directed ways (e.g., accessing services, information, and opportunities).
- For social support services and NGOs: Programs should be tailored to the specific needs of different groups. For instance, migrants may benefit from information-oriented digital support (e.g., job and housing platforms), whereas people experiencing homelessness may benefit more from tools that strengthen local social connections and access to nearby services.
- For mental health professionals and support workers: Given the association between smartphone use for emotional regulation and negative psychological outcomes, digital practices should be integrated with offline psychosocial support to prevent maladaptive coping patterns.
- For correctional institutions: Introducing controlled access to digital technologies, alongside digital literacy training, may reduce the gap between prison environments and digital society, facilitating post-release reintegration.
- For policymakers: Digital inclusion strategies should adopt a multidimensional approach that goes beyond device provision, incorporating access to stable internet, digital education, and broader structural interventions addressing poverty, housing instability, and social exclusion.
Conclusion
This paper highlights the complex and context-dependent relationships between smartphone use, digital exclusion, and well-being among migrants, people experiencing homelessness, and prisoners. Across five studies, the findings indicate that the effects of smartphones may differ significantly depending on their usage patterns and the specific circumstances of each group. While smartphones appear to facilitate social connections and access to vital resources, their use for emotional regulation was often associated with heightened resignation, although the cross-sectional design does not allow us to determine whether this use reflects maladaptive coping, a response to pre-existing distress, or both. Importantly, smartphones alone cannot resolve systemic exclusion. Their impact is shaped by broader structural conditions that require targeted policy, economic, and social interventions. Digital exclusion remains linked to isolation and poor well-being, underscoring the need for equitable access and improved conditions of use. These findings underscore the importance of context-sensitive strategies that promote adaptive smartphone use while also tackling the systemic barriers that perpetuate marginalization. This includes advocating for policies that improve internet affordability, expand digital literacy programs, and promote equitable access to devices and connectivity. Existing initiatives (e.g., the International Organization for Migration or the Fondo per la Repubblica Digitale) offer valuable models for designing inclusive, community-based interventions that enhance digital participation and reduce inequality. Governments, NGOs, and private actors all have a role in tackling both technological and socio-economic barriers. Future research should evaluate how such interventions impact the digital divide and well-being among marginalized groups.
Footnotes
1 Fondo per la Repubblica Digitale (Fund for the Digital Republic) is a social enterprise established through a partnership between the Italian government and private foundations, which promote inclusive digital policies and community-based programs aimed at enhancing digital literacy and access in underserved communities.
Conflict of Interest
The authors have no conflicts of interest to declare.
Use of AI Services
During the preparation of this work, the authors used OpenAI's ChatGPT to refine phrasing and improve the readability of the text. After utilizing this tool, the authors thoroughly reviewed and edited the content as necessary and took full responsibility for the content of the published article.
Data Availability Statement
The datasets, analytic code, and study materials supporting the findings of this research are openly available on the Open Science Framework (OSF) at: https://osf.io/e2tfv/.
Acknowledgement
Support for this work was provided by the Italian Ministry of Education through the PRIN grant 2022X44WX4 (grant period: 2023–2025) for the project titled Human Connections in the Digital Era (CONNECT).
Appendix
Table A1. Smartphone Applications Usage Scale: Items and Factor Loadings (Study 1).
|
Codice |
On average, how often do you use the following Apps |
Communication factor |
Information factor |
|
appUse1 |
Texting apps (WhatsApp, Messenger, Telegram, …) |
0.86 |
0.02 |
|
appUse2 |
Social Network (Facebook, Twitter, Pinterest, Instagram, …) |
0.81 |
0.01 |
|
appUse3 |
Phone calls |
0.64 |
−0.01 |
|
appUse5 |
E-mails |
0.18 |
0.64 |
|
appUse6 |
Calendar & Notes |
−0.02 |
0.75 |
|
appUse7 |
Location apps (Google Maps, Waze, …) |
0.13 |
0.66 |
|
appUse8 |
Entertainment apps (music, videos, films, sports events, …) |
0.24 |
0.53 |
|
appUse9 |
Game apps (Pinball, Angry Birds, …) |
0.05 |
0.55 |
|
appUse10 |
News apps (BBC, CNN, Rai News) |
−0.12 |
0.77 |
|
appUse11 |
Dating apps (Meetic, Tinder, …) |
−0.08 |
0.62 |
|
appUse12 |
Travel and food apps (JustEat, The Fork, TripAdvisor, Yelp, …) |
−0.16 |
0.66 |
|
appUse13 |
Online shopping apps (eBay, Amazon, Zalando, …) |
0.11 |
0.54 |
Table A2. Basic Psychological Needs Satisfaction Scale: Final Items and Factor Loadings (Study 1).
|
Item Code |
Item Text |
Dimension |
PCA Loading |
|
nsms_belong4 |
I felt I belonged to a group |
Belonging |
0.43 |
|
nsms_belong5 |
I felt the other people interacted with me a lot |
Belonging |
0.53 |
|
nsms_sesteem1 |
I felt good about myself |
Self-esteem |
0.70 |
|
nsms_sesteem2 |
My self-esteem was high |
Self-esteem |
0.67 |
|
nsms_sesteem3 |
I felt liked |
Self-esteem |
0.66 |
|
nsms_sesteem5 |
I felt satisfied |
Self-esteem |
0.61 |
|
nsms_meanexist4 |
I felt important |
Meaningful existence |
0.71 |
|
nsms_meanexist5 |
I felt useful |
Meaningful existence |
0.70 |
|
nsms_control1 |
I felt powerful |
Control |
0.70 |
|
nsms_control2 |
I felt I had control over the course of events |
Control |
0.64 |
|
nsms_control3 |
I felt I had the ability to significantly alter events |
Control |
0.65 |
Table A3. Smartphone Usage Scale: Items and Factor Loadings (Study 2a).
|
|
Before leaving for your journey to Italy, did you use a SMARTPHONE… |
Pre-arrival use Factor |
Communication Factor |
Information Factor |
Emotional Regulation Factor |
|
SM1 |
To get information about the possibility of being welcomed in Italy? |
0.62 |
−0.12 |
0.34 |
−0.24 |
|
SM2 |
To get information about the possibility of finding a jo |
0.64 |
−0.03 |
0.22 |
−0.24 |
|
SM3 |
To get information about the dangers and difficulties of the journey to Italy? |
0.69 |
−0.23 |
0.33 |
−0.05 |
|
SM4 |
To get information about the means and ways to travel |
0.64 |
−0.33 |
0.40 |
0.02 |
|
SM5 |
In general, how useful was the smartphone in helping you prepare for your journey |
0.68 |
0.04 |
−0.03 |
−0.13 |
|
|
During your journey to Italy, did you use a SMARTPHONE… |
Pre-arrival use Factor |
Communication Factor |
Information Factor |
Emotional Regulation Factor |
|
SM6 |
To look for travel information? |
0.78 |
0.11 |
0.00 |
−0.02 |
|
SM7 |
To get to ask for help or call emergency services? |
0.85 |
0.06 |
−0.25 |
0.06 |
|
SM8 |
To keep in touch with other migrants? |
0.71 |
−0.03 |
0.09 |
0.10 |
|
SM9 |
To keep in touch with |
0.81 |
0.14 |
−0.09 |
0.13 |
|
SM10 |
To keep in touch with |
0.79 |
0.07 |
0.01 |
0.12 |
|
SM11 |
To look for shelter, food, |
0.77 |
0.00 |
−0.10 |
0.06 |
|
SM12 |
To take photos and videos |
0.78 |
0.22 |
−0.05 |
−0.04 |
|
|
In Italy, do you use a SMARTPHONE… |
Pre-arrival use Factor |
Communication Factor |
Information Factor |
Emotional Regulation Factor |
|
SM13 |
To keep in touch with your country of origin? |
0.11 |
0.83 |
−0.04 |
−0.05 |
|
SM14 |
To keep in touch with |
0.18 |
0.70 |
0.07 |
0.01 |
|
SM15 |
To keep in touch with |
0.02 |
0.82 |
0.20 |
−0.08 |
|
SM16 |
To keep in touch with |
−0.08 |
0.69 |
0.30 |
0.13 |
|
SM19 |
To look for information about Italy? |
−0.02 |
0.27 |
0.78 |
−0.02 |
|
SM20 |
To communicate with Italians? |
0.22 |
0.09 |
0.63 |
−0.01 |
|
SM21 |
To try to make friends |
−0.05 |
0.11 |
0.80 |
0.15 |
|
SM22 |
To look for a job in Italy? |
0.06 |
0.05 |
0.58 |
0.26 |
|
SM25 |
When you don’t know what |
0.21 |
0.36 |
−0.23 |
0.46 |
|
SM26 |
When you feel sad? |
0.08 |
0.12 |
−0.07 |
0.85 |
|
SM27 |
When you feel depressed? |
−0.02 |
−0.07 |
0.10 |
0.88 |
|
SM28 |
When you want to distract yourself from your problems? |
−0.02 |
−0.17 |
0.16 |
0.81 |
Table A4. Smartphone Usage Scale: Items and Factor Loadings (Study 2b).
|
|
Before leaving for your journey to Italy, did you use a SMARTPHONE… |
Pre-arrival use Factor |
Communication Factor |
Information Factor |
Emotional Regulation Factor |
|
SM1 |
To get information about the possibility |
0.79 |
−0.13 |
0.15 |
0.05 |
|
SM2 |
To get information about the possibility |
0.81 |
−0.21 |
0.08 |
0.05 |
|
SM3 |
To get information about the dangers and difficulties of the journey to Italy? |
0.77 |
−0.22 |
0.09 |
−0.01 |
|
SM4 |
To get information about the means and ways |
0.83 |
−0.20 |
0.18 |
0.04 |
|
SM5 |
In general, how useful was the smartphone |
0.80 |
0.01 |
0.09 |
0.04 |
|
|
During your journey to Italy, did you use a SMARTPHONE... |
Pre-arrival use Factor |
Communication Factor |
Information Factor |
Emotional Regulation Factor |
|
SM6 |
To look for travel information? |
0.71 |
0.22 |
−0.02 |
−0.02 |
|
SM7 |
To get to ask for help or call emergency services? |
0.74 |
0.11 |
−0.08 |
0.02 |
|
SM8 |
To keep in touch with other migrants? |
0.53 |
0.34 |
0.03 |
0.00 |
|
SM9 |
To keep in touch with your family? |
0.62 |
0.49 |
−0.24 |
−0.02 |
|
SM10 |
To keep in touch with your friends? |
0.59 |
0.48 |
−0.19 |
−0.05 |
|
SM11 |
To look for shelter, food, and water? |
0.50 |
0.27 |
0.13 |
0.09 |
|
SM12 |
To take photos and videos of your travel experience? |
0.58 |
0.42 |
−0.21 |
0.08 |
|
|
In Italy, do you use a SMARTPHONE… |
Pre-arrival use Factor |
Communication Factor |
Information Factor |
Emotional Regulation Factor |
|
SM13 |
To keep in touch with your country of origin? |
−0.06 |
0.78 |
0.12 |
0.10 |
|
SM14 |
To keep in touch with your family? |
0.03 |
0.76 |
0.17 |
0.12 |
|
SM15 |
To keep in touch with your friends? |
−0.07 |
0.66 |
0.26 |
0.06 |
|
SM16 |
To keep in touch with other migrants? |
−0.15 |
0.50 |
0.38 |
0.12 |
|
SM19 |
To look for information about Italy? |
0.17 |
0.32 |
0.57 |
0.09 |
|
SM20 |
To communicate with Italians? |
0.07 |
0.31 |
0.69 |
−0.06 |
|
SM21 |
To try to make friends with Italians? |
0.00 |
0.19 |
0.71 |
−0.19 |
|
SM22 |
To look for a job in Italy? |
0.16 |
−0.04 |
0.70 |
0.20 |
|
SM23 |
To look for a house in Italy? |
0.18 |
−0.14 |
0.62 |
0.15 |
|
SM25 |
When you don’t know what to do? |
0.00 |
0.15 |
−0.06 |
0.74 |
|
SM26 |
When you feel sad? |
−0.04 |
−0.06 |
0.05 |
0.89 |
|
SM27 |
When you feel depressed? |
0.00 |
−0.07 |
0.06 |
0.86 |
|
SM28 |
When you want to distract yourself from your problems? |
0.04 |
0.11 |
−0.13 |
0.83 |
|
Note. The same pool of items used in Study 2a was employed. As in Study 2a, exploratory factor analysis suggested excluding items 17, 18, and 24, while retaining item 23. |
|||||
Table A5. Smartphone Usage Scale: Items and Factor Loadings (Study 3).
|
|
If you have a smartphone, how much |
Communication Factor |
Information Factor |
Emotional regulation Factor |
|
SMT1 |
Keep in touch with your family? |
0.76 |
−0.11 |
−0.10 |
|
SMT2 |
Keep in touch with your friends? |
0.78 |
0.02 |
0.01 |
|
SMT3 |
Keep in touch with other homeless people? |
0.70 |
0.14 |
0.13 |
|
SMT4 |
Keep in touch with the organizations you rely on? |
0.16 |
0.71 |
−0.07 |
|
SMT5 |
Try to make new friends? |
0.67 |
0.04 |
0.04 |
|
SMT6 |
Look for services that may be useful |
−0.09 |
0.88 |
−0.03 |
|
SMT7 |
Look for a job? |
0.00 |
0.79 |
0.09 |
|
SMT8 |
Look for housing? |
0.13 |
0.64 |
0.01 |
|
SMT9 |
When you don’t know what to do? |
0.05 |
−0.07 |
0.70 |
|
SMT10 |
When you feel sad? |
0.03 |
−0.07 |
0.92 |
|
SMT11 |
When you feel depressed? |
−0.05 |
0.09 |
0.89 |
|
SMT12 |
When you want to distract yourself from |
0.01 |
0.01 |
0.86 |
Table A6. Perceived Deprivation Scale: Items and Factor Loadings (Study 4).
|
|
Compared to people who are NOT in prison, HOW DISADVANTAGED DO YOU FEEL because… |
Access Deprivation Factor |
Ability Deprivation Factor |
|
LackDT_1 |
You don’t have access to the internet |
0.86 |
0.00 |
|
LackDT_2 |
You don’t have access to a smartphone (mobile phone) |
0.92 |
−0.01 |
|
LackDT_3 |
You cannot access social media (Facebook, Instagram, TikTok) |
0.89 |
−0.02 |
|
LackDT_4 |
You cannot make video calls |
0.61 |
0.13 |
|
LackDT_5 |
You cannot play videogames |
0.48 |
0.16 |
|
LackDT_6 |
You cannot send instant messages (WhatsApp) |
0.86 |
0.04 |
|
LackDT_7 |
You don’t know how to use the Internet and its devices |
0.07 |
0.81 |
|
LackDT_8 |
You don’t know how to take advantage of the resources |
0.10 |
0.87 |
|
LackDT_9 |
Once released from prison, you will struggle to keep up |
0.00 |
0.57 |
Table A7. Perceived Impediment Scale: Items and Factor Loadings (Study 4).
|
|
THE LACK OF INTERNET AND RELATED DEVICES (computer, phone) |
Digital Technology Impediment Factor |
|
LackDT_10 |
Limits my potential |
0.77 |
|
LackDT_11 |
Is something I often think about |
0.81 |
|
LackDT_12 |
Cause me suffering |
0.71 |
|
LackDT_13 |
Prevents me from meeting my social needs (staying |
0.77 |
|
LackDT_14 |
Prevents me from learning new things |
0.73 |
|
LackDT_15 |
Prevents me from finding the information I need |
0.76 |
|
LackDT_16 |
Prevents me from relaxing and having fun |
0.75 |
|
LackDT_17 |
Makes my life unfairly harder |
0.77 |
|
LackDT_18 |
It is an overly harsh restriction of the prison |
0.59 |
Table A8 presents all regression paths and covariances among the outcome variables. It includes unstandardized coefficients (b), standard errors (SE), exact p-values, and 95% confidence intervals (95% CI). Age, education, and gender were included as covariates in all analyses.
Table A8. Results of the Path Analysis (Study 1).
|
Outcome |
Predictor |
b |
SE |
z |
p |
95% CI |
|
Sociocultural adaptation |
Communication |
0.056 |
0.054 |
1.03 |
.302 |
[−0.050, 0.161] |
|
Information |
0.365 |
0.058 |
6.24 |
< .001 |
[0.250, 0.480] |
|
|
Age |
0.005 |
0.005 |
1.08 |
.278 |
[−0.004, 0.014] |
|
|
Education |
0.005 |
0.008 |
0.56 |
.575 |
[−0.012, 0.021] |
|
|
Sex |
−0.068 |
0.104 |
−0.65 |
.512 |
[−0.272, 0.136] |
|
|
Physical health |
Communication |
−0.069 |
0.061 |
−1.14 |
.255 |
[−0.188, 0.050] |
|
Information |
0.184 |
0.066 |
2.79 |
.005 |
[0.055, 0.314] |
|
|
Age |
−0.012 |
0.005 |
−2.38 |
.018 |
[−0.022, −0.002] |
|
|
Education |
0.010 |
0.010 |
1.03 |
.303 |
[−0.009, 0.028] |
|
|
Sex |
−0.231 |
0.118 |
−1.97 |
.049 |
[−0.462, -0.001] |
|
|
Basic psychological needs |
Communication |
−0.042 |
0.058 |
−0.73 |
.469 |
[−0.156, 0.072] |
|
Information |
0.338 |
0.063 |
5.35 |
< .001 |
[0.214, 0.461] |
|
|
Age |
0.008 |
0.005 |
1.66 |
.098 |
[−0.002, 0.018] |
|
|
Education |
−0.018 |
0.009 |
−1.99 |
.047 |
[−0.036, −0.000] |
|
|
Sex |
−0.003 |
0.113 |
−0.02 |
.980 |
[−0.223, 0.218] |
|
|
Covariances |
|
|
|
|
|
|
|
Sociocultural adaptation ↔ Physical Health |
|
0.106 |
0.029 |
3.73 |
< .001 |
[0.050, 0.162] |
|
Sociocultural adaptation ↔ Basic psychological needs |
|
0.145 |
0.028 |
5.12 |
< .001 |
[0.090, 0.201] |
|
Physical Health ↔ Basic psychological needs |
|
0.084 |
0.030 |
2.76 |
.006 |
[0.024, 0.143] |
Table A9 presents all regression paths and covariances among the outcome variables. It includes unstandardized coefficients (b), standard errors (SE), exact p-values, and 95% confidence intervals (95% CI). Age and education were included as covariates in all analyses.
Table A9. Results of the Path Analysis (Study 2a).
|
Outcome |
Predictor |
b |
SE |
z |
p |
95% CI |
|
Resignation |
Communication |
−0.104 |
0.071 |
−1.47 |
.140 |
[−0.243, 0.034] |
|
Information |
−0.102 |
0.077 |
−1.33 |
.182 |
[−0.252, 0.048] |
|
|
Emotional regulation |
0.290 |
0.065 |
4.47 |
< .001 |
[0.163, 0.417] |
|
|
Pre-arrival |
−0.021 |
0.074 |
−0.28 |
.781 |
[−0.166, 0.124] |
|
|
Age |
−0.013 |
0.010 |
−1.22 |
.224 |
[−0.033, 0.008] |
|
|
Education |
−0.055 |
0.019 |
−2.90 |
.004 |
[−0.092, −0.018] |
|
|
Sociocultural adaptation |
Communication |
0.363 |
0.079 |
4.62 |
< .001 |
[0.209, 0.517] |
|
Information |
0.078 |
0.083 |
0.94 |
.348 |
[−0.085, 0.240] |
|
|
Emotional regulation |
−0.044 |
0.069 |
−0.64 |
.521 |
[−0.180, 0.091] |
|
|
Pre-arrival |
−0.079 |
0.078 |
−1.02 |
.310 |
[−0.232, 0.074] |
|
|
Age |
−0.009 |
0.011 |
−0.80 |
.426 |
[−0.030, 0.013] |
|
|
Education |
0.070 |
0.021 |
3.34 |
.001 |
[0.029, 0.111] |
|
|
Variables |
|
|
|
|
|
|
|
Resignation ↔ Sociocultural adaptation |
|
−0.032 |
0.038 |
−0.84 |
.403 |
[−0.108, 0.043] |
Table A10 presents all regression paths and covariances among the outcome variables. It includes unstandardized coefficients (b), standard errors (SE), exact p-values, and 95% confidence intervals (95% CI). Age, education, and gender were included as covariates in all analyses.
Table A10. Results of the Path Analysis (Study 2b).
|
Outcome |
Predictor |
b |
SE |
z |
p |
95% CI |
|
Resignation |
Communication |
−0.158 |
0.087 |
−1.81 |
.070 |
[−0.329, 0.013] |
|
Information |
−0.057 |
0.090 |
−0.63 |
.526 |
[−0.233, 0.119] |
|
|
Emotional regulation |
0.275 |
0.069 |
3.99 |
< .001 |
[−0.140, 0.410] |
|
|
Pre-arrival |
−0.001 |
0.070 |
−0.02 |
.986 |
[−0.138, 0.135] |
|
|
Age |
−0.002 |
0.007 |
−0.30 |
.764 |
[−0.016, 0.012] |
|
|
Education |
−0.020 |
0.016 |
−1.27 |
.205 |
[0.050, 0.011] |
|
|
Gender |
−0.008 |
0.156 |
−0.05 |
.961 |
[−0.313, 0.297] |
|
|
Sociocultural adaptation |
Communication |
0.024 |
0.096 |
0.25 |
.805 |
[−0.165, 0.213] |
|
Information |
0.136 |
0.099 |
1.38 |
.167 |
[−0.057, 0.329] |
|
|
Emotional regulation |
0.050 |
0.076 |
0.66 |
.512 |
[−0.099, 0.199] |
|
|
Pre-arrival |
−0.038 |
0.077 |
−0.49 |
.624 |
[−0.189, 0.113] |
|
|
Age |
0.001 |
0.008 |
0.18 |
.856 |
[−0.014, 0.017] |
|
|
Education |
0.022 |
0.017 |
1.30 |
.193 |
[−0.011, 0.056] |
|
|
Gender |
0.263 |
0.171 |
1.54 |
.124 |
[−0.072, 0.597] |
|
|
Variables |
|
|
|
|
|
|
|
Resignation ↔ Sociocultural adaptation |
|
−0.266 |
0.068 |
−3.89 |
< .001 |
[−0.400, −0.132] |
Table A11 presents all regression paths and covariances among the outcome variables. It includes unstandardized coefficients (b), standard errors (SE), exact p-values, and 95% confidence intervals (95% CI). Age, education, and gender were included as covariates in all analyses.
Table A11. Results of the Path Analysis (Study 3).
|
Outcome |
Predictor |
b |
SE |
z |
p |
95% CI |
|
Resignation |
Communication |
−0.338 |
0.133 |
−2.53 |
.011 |
[−0.599, −0.076] |
|
Information |
0.076 |
0.099 |
0.76 |
.445 |
[−0.119, 0.270] |
|
|
Emotional regulation |
0.530 |
0.086 |
6.13 |
< .001 |
[0.360, 0.699] |
|
|
Age |
0.007 |
0.010 |
0.76 |
.447 |
[−0.012, 0.026] |
|
|
Education |
−0.038 |
0.143 |
−0.26 |
.791 |
[−0.318, 0.242] |
|
|
Gender |
−0.184 |
0.255 |
−0.72 |
.471 |
[−0.683, 0.315] |
|
|
Physical health |
Communication |
0.289 |
0.150 |
1.93 |
.054 |
[−0.005, 0.582] |
|
Information |
0.028 |
0.111 |
0.25 |
.803 |
[−0.191 0.246] |
|
|
Emotional regulation |
−0.166 |
0.097 |
−1.71 |
.087 |
[−0.356, 0.024] |
|
|
Age |
−0.017 |
0.011 |
−1.59 |
.111 |
[−0.039, 0.004] |
|
|
Education |
0.036 |
0.160 |
0.22 |
.823 |
[−0.278, 0.350] |
|
|
Gender |
0.351 |
0.286 |
1.23 |
.220 |
[−0.210, 0.911] |
|
|
Covariances |
|
|
|
|
|
|
|
Resignation ↔ Physical health |
|
−0.163 |
0.075 |
−2.16 |
.031 |
[−0.310, −0.015] |
Table A12 presents all regression paths and covariances among the outcome variables. It includes unstandardized coefficients (b), standard errors (SE), exact p-values, and 95% confidence intervals (95% CI). Age and education were included as covariates in all analyses.
Table A12. Results of the Path Analysis (Study 4).
|
Outcome |
Predictor |
b |
SE |
z |
p |
95% CI |
|
Resignation |
Access Deprivation |
−0.023 |
0.053 |
−0.44 |
.660 |
[−0.126, 0.080] |
|
Ability Deprivation |
0.215 |
0.055 |
3.92 |
< .001 |
[0.108, 0.322] |
|
|
Digital Technology Impedimenti |
0.311 |
0.075 |
4.14 |
< .001 |
[0.164, 0.458] |
|
|
Age |
−0.008 |
0.004 |
−1.91 |
.056 |
[−0.017, 0.000] |
|
|
Education |
0.080 |
0.084 |
0.95 |
.343 |
[−0.085, 0.245] |
|
|
Physical health |
Access Deprivation |
0.058 |
0.059 |
0.98 |
.325 |
[−0.057, 0.172] |
|
Ability Deprivation |
−0.135 |
0.061 |
−2.20 |
.027 |
[−0.255, −0.015] |
|
|
Digital Technology Impedimenti |
−0.324 |
0.085 |
−3.82 |
< .001 |
[−0.490, −0.158] |
|
|
Age |
−0.006 |
0.005 |
−1.32 |
.185 |
[−0.016, 0.003] |
|
|
Education |
0.006 |
0.095 |
0.06 |
.953 |
[−0.180, 0.192] |
|
|
Variables |
|
|
|
|
|
|
|
Resignation ↔ Physical health |
|
−0.171 |
0.049 |
−3.53 |
< .001 |
[−0.267, −0.076] |


This work is licensed under a Creative Commons Attribution-ShareAlike 4.0 International License.
Copyright © 2026 Ilenia Gasparini, Marco Marinucci, Luca Pancani, Paolo Riva