
Unravelling social network usage patterns: A study based on unsupervised learning
Vol.19,No.4(2025)
Alfredo Zarco-Alpuente
 Víctor Ciudad-Fernández
Marta Carrique-Martínez
Lucas Serrano-Pastor
Elisabeth Malonda-Vidal
Anna Llorca-Mestre
Rafael García-Ros
Paula Samper-García
Víctor Ciudad-Fernández
Marta Carrique-Martínez
Lucas Serrano-Pastor
Elisabeth Malonda-Vidal
Anna Llorca-Mestre
Rafael García-Ros
Paula Samper-García
We are facing a growing concern regarding the consequences of Problematic Social Network Use (PSNU). Therefore, the aim of the present study was to explore the profiles of social network (SN) users and contrast their differences across variables linked to PSNU in the literature. A sample of 726 participants aged 16 and above (77.0% female) residing in Spain was analysed using Latent Class Analysis (LCA). ANOVA and chi-square test were employed to investigate differences in sociodemographic variables, digital preferences, impulsivity, emotional intelligence, empathy and aggression among the latent classes. The three-class model, which proved the most parsimonious, identified functional, risky, and problematic users. Notably, greater differences were observed between functional and risky users regarding impulsivity and emotional regulation, whereas differences in empathy and aggression were more pronounced between problematic users and the other two groups. The study provides relevant information about the characteristics of different groups of SN users. This information may be useful for the early detection of inappropriate online behaviours that may lead to PSNU, as well as for identifying users who may have already developed it.
problematic social network use; latent class analysis; impulsivity; emotional intelligence; empathy; aggression
Alfredo Zarco-Alpuente
Department of Basic Psychology, Faculty of Psychology and Speech Therapy, University of Valencia
PhD candidate at the Department of Basic Psychology at the Faculty of Psychology and Speech Therapy, University of Valencia, Spain. Member of the EVAIN research group (Evaluation and Intervention in Adolescence). His primary research interests include studying the balance between the positive use of digital media and their problematic use in adolescents and young adults, with a particular focus on athletes.
Víctor Ciudad-Fernández
Department of Personality, Assessment, and Psychological Treatments, Faculty of Psychology and Speech Therapy, University of Valencia
PhD Candidate at the Department of Personality, Assessment and Psychological Treatments, Faculty of Psychology and Speech Therapy, University of Valencia, Spain. He is a member of the research group LabPsiTec (Laboratory of Psychology and Technology, directed by Rosa Baños). His main research interests are structural equation models, network psychometrics and behavioural addictions, especially problematic use of social media.
Marta Carrique-Martínez
Department of Basic Psychology, Faculty of Psychology and Speech Therapy, University of Valencia
PhD candidate at the Department of Basic Psychology, Faculty of Psychology and Speech Therapy, University of Valencia, Spain. Member of the EVAIN research group. Her main research interests are the psychosocial determinants of addictive behaviour in adolescents and young adults.
Lucas Serrano-Pastor
Department of Basic Psychology, Faculty of Psychology and Speech Therapy, University of Valencia, Spain
PhD candidate at the Department of Basic Psychology, Faculty of Psychology and Speech Therapy, University of Valencia, Spain. Member of the EVAIN research group. His main research interests are addiction recovery and mental health.
Elisabeth Malonda-Vidal
Department of Basic Psychology, Faculty of Psychology and Speech Therapy, University of Valencia
Associate Professor in the Department of Basic Psychology, Faculty of Psychology and Speech Therapy, University of Valencia, Spain. Member of the EVAIN research group. Her main research interests are prosocial behaviour, parenting style, gender, emotional regulation and violence.
Anna Llorca-Mestre
Department of Basic Psychology, Faculty of Psychology and Speech Therapy, University of Valencia
Associate Professor in the Department of Basic Psychology, Faculty of Psychology and Speech Therapy, University of Valencia, Spain. Member of the EVAIN research group. Her main research interests are prosocial behaviour, parenting style, gender, emotional regulation and violence.
Rafael García-Ros
Department of Development and Educational Psychology, Faculty of Psychology and Speech Therapy, University of Valencia
is a Full Professor in the Department of Developmental and Educational Psychology, School of Psychology and Speech Therapy, University of Valencia, Spain. His research focuses on health-science education, competency-based education, formative assessment, self-regulated learning, and the first-year university student experience. Coordinator of the INSTECH research group (Instructional Technology: Designing Effective Learning Environments), and member of the GID-Neurophysiotherapy (Neurophysiotherapy Educational Research and Innovation Group).
Paula Samper-García
Department of Basic Psychology, Faculty of Psychology and Speech Therapy, University of Valencia
Full Professor in the Department of Basic Psychology at the Faculty of Psychology and Speech Therapy at the University of Valencia, Spain. Director of the EVAIN research group. Her main research interests are on psychological processes and prosocial vs aggressive behavior, specifically on the contexts: family, school and peer groups and variables related.
Akoglu, H. (2018). User's guide to correlation coefficients. Turkish Journal of Emergency Medicine, 18(3), 91–93. https://doi.org/10.1016/j.tjem.2018.08.001
Andreu Rodríguez, J. M., Fernández, M. E. P., & Ramírez, J. M. (2009). Cuestionario de agresión reactiva y proactiva: un instrumento de medida de la agresión en adolescentes [Reactive and proactive aggression questionnaire: An instrument for measuring aggression in adolescents]. Revista de Psicopatología y Psicología Clínica, 14(1), 37–49. https://doi.org/10.5944/rppc.vol.14.num.1.2009.4065
Arrivillaga, C., Rey, L., & Extremera, N. (2022). A mediated path from emotional intelligence to problematic social media use in adolescents: The serial mediation of perceived stress and depressive symptoms. Addictive Behaviours, 124, Article 107095. https://doi.org/10.1016/j.addbeh.2021.107095
Augner, C., Vlasak, T., & Barth, A. (2023). The relationship between problematic internet use and attention deficit, hyperactivity and impulsivity: A meta-analysis. Journal of Psychiatric Research, 168, 1–12. https://doi.org/10.1016/j.jpsychires.2023.10.032
Babcock, J. C., Tharp, A. L., Sharp, C., Heppner, W., & Stanford, M. S. (2014). Similarities and differences in impulsive/premeditated and reactive/proactive bimodal classifications of aggression. Aggression and Violent Behavior, 19(3), 251–262. https://doi.org/10.1016/j.avb.2014.04.002
Billieux, J., Van der Linden, M., & Rochat, L. (2008). The role of impulsivity in actual and problematic use of the mobile phone. Applied Cognitive Psychology, 22(9), 1195–1210. https://doi.org/10.1002/acp.1429
Boer, M., Stevens, G. W., Finkenauer, C., & Van den Eijnden, R. J. (2022). The course of problematic social media use in young adolescents: A latent class growth analysis. Child Development, 93(2), e168–e187. https://doi.org/10.1111/cdev.13712
Boer, M., Van Den Eijnden, R. J. J. M., Finkenauer, C., Boniel‐Nissim, M., Marino, C., Inchley, J., Cosma, A., Paakkari, L., & Stevens, G. W. J. M. (2022). Cross‐national validation of the Social Media Disorder Scale: Findings from adolescents from 44 countries. Addiction, 117(3), 784–795. https://doi.org/10.1111/add.15709
Bonanomi, A., Nai Ruscone, M., & Osmetti, S. A. (2013). The Polychoric Ordinal Alpha, measuring the reliability of a set of polytomous ordinal items. In Electronic Book “Advances in Latent Variables” (pp. 1-6). Vita e Pensiero. https://staging-unicatt.elsevierpure.com/en/publications/the-polychoric-ordinal-alpha-measuring-thereliability-of-a-set-of-9
Brailovskaia, J., Truskauskaite-Kuneviciene, I., Kazlauskas, E., & Margraf, J. (2021). The patterns of problematic social media use (SMU) and their relationship with online flow, life satisfaction, depression, anxiety and stress symptoms in Lithuania and in Germany. Current Psychology, 42(5), 3713–3724. https://doi.org/10.1007/s12144-021-01711-w
Brand, M., Rumpf, H., Demetrovics, Z., Müller, A., Stark, R., King, D. L., Goudriaan, A. E., Mann, K., Trotzke, P., Fineberg, N. A., Chamberlain, S. R., Kraus, S. W., Wegmann, E., Billieux, J., & Potenza, M. N. (2022). Which conditions should be considered as disorders in the International Classification of Diseases (ICD-11) designation of “other specified disorders due to addictive behaviors”? Journal of Behavioral Addictions, 11(2), 150–159 https://doi.org/10.1556/2006.2020.00035
Brand, M., Wegmann, E., Stark, R., Müller, A., Wölfling, K., Robbins, T. W., & Potenza, M. N. (2019). The interaction of person-affect-cognition-execution (I-PACE) model for addictive behaviors: Update, generalization to addictive behaviors beyond internet-use disorders, and specification of the process character of addictive behaviors. Neuroscience & Biobehavioral Reviews, 104, 1–10. https://doi.org/10.1016/j.neubiorev.2019.06.032
Brand, M., Young, K. S., Laier, C., Wölfling, K., & Potenza, M. N. (2016). Integrating psychological and neurobiological considerations regarding the development and maintenance of specific Internet-use disorders: An Interaction of Person-Affect-Cognition-Execution (I-PACE) model. Neuroscience & Biobehavioral Reviews, 71, 252–266. https://doi.org/10.1016/j.neubiorev.2016.08.033
Burén, J., Nutley, S. B., Crisci, G., & Thorell, L. B. (2023). Evidence of a two-factor structure for Internet Gaming Disorder and Social Media Disorder: Psychometric properties of a new screening instrument for adolescents and adults. Journal of Psychopathology and Behavioral Assessment, 45(3), 702–715. https://doi.org/10.1007/s10862-023-10066-4
Calaresi, D., Cuzzocrea, F., Saladino, V., & Verrastro, V. (2024). The relationship between trait emotional intelligence and problematic social media use. Youth & Society, 57(3), 515–535. https://doi.org/10.1177/0044118X241273407
Cándido, A., Orduña, E., Perales, J. C., Verdejo-García, A., & Billieux, J. (2012). Validation of a short Spanish version of the UPPS-P Impulsive Behaviour Scale. Trastornos Adictivos, 14(3), 73–78. https://doi.org/10.1016/S1575-0973(12)70048-X
Carrier, L. M., Spradlin, A., Bunce, J. P., & Rosen, L. D. (2015). Virtual empathy: Positive and negative impacts of going online upon empathy in young adults. Computers in Human Behaviour, 52, 39–48. https://doi.org/10.1016/j.chb.2015.05.026
Casale, S., Akbari, M., Seydavi, M., Benucci, S. B., & Fioravanti, G. (2023). Has the prevalence of problematic social media use increased over the past seven years and since the start of the COVID-19 pandemic? A meta-analysis of the studies published since the development of the Bergen Social Media Addiction Scale. Addictive Behaviors, 147, Article 107838. https://doi.org/10.1016/j.addbeh.2023.107838
Cataldo, I., Billieux, J., Esposito, G., & Corazza, O. (2022). Assessing problematic use of social media: Where do we stand and what can be improved? Current Opinion in Behavioral Sciences, 45, Article 101145. https://doi.org/10.1016/j.cobeha.2022.101145
Cerniglia, L., Griffiths, M. D., Cimino, S., De Palo, V., Monacis, L., Sinatra, M., & Tambelli, R. (2019). A latent profile approach for the study of internet gaming disorder, social media addiction, and psychopathology in a normative sample of adolescents. Psychology Research and Behaviour Management, 12, 651–659. https://doi.org/10.2147/PRBM.S211873
Chakraborty, R., & Chechi, V. K. (2020). Network psychometrics based validation of volitional component of self regulated learning and estimation of its polychoric ordinal omega reliability. Mukt Shabd Journal, 9(6), 5890–5909.
Cheng, C., Ebrahimi, O. V., & Luk, J. W. (2022). Heterogeneity of prevalence of social media addiction across multiple classification schemes: Latent profile analysis. Journal of Medical Internet Research, 24(1), Article e27000. https://doi.org/10.2196/27000
Cheng, C., Lau, Y. C., Chan, L., & Luk, J. W. (2021). Prevalence of social media addiction across 32 nations: Meta-analysis with subgroup analysis of classification schemes and cultural values. Addictive Behaviors, 117, Article 106845. https://doi.org/10.1016/j.addbeh.2021.106845
Ciudad-Fernández, V., Zarco-Alpuente, A., Escrivá-Martínez, T., Herrero, R., & Baños, R. (2024). How do adolescents lose control over social networks: A process-based approach for social network problematic use. Addictive Behaviours, 154, Article 108003. https://doi.org/10.1016/j.addbeh.2024.108003
Coyne, S. M., Padilla-Walker, L. M., Holmgren, H. G., Davis, E. J., Collier, K. M., Memmott-Elison, M. K., & Hawkins, A. J. (2018). A meta-analysis of prosocial media on prosocial behavior, aggression, and empathic concern: A multidimensional approach. Developmental Psychology, 54(2), 331–347. https://doi.org/10.1037/dev0000412
Crespo-Ramos, S., Romero-Abrio, A., Martínez-Ferrer, B., & Musitu, G. (2017). Variables psicosociales y violencia escolar en la adolescencia [Psychosocial variables and overt school violence among adolescents]. Psychosocial Intervention, 26(2), 125–130. https://doi.org/10.1016/j.psi.2017.05.002
Crick, N. R., & Dodge, K. A. (1996). Social information-processing mechanisms in reactive and proactive aggression. Child Development, 67(3), 993–1002. https://doi.org/10.1111/j.1467-8624.1996.tb01778.x
Cui, J., Wang, Y., Liu, D., & Yang, H. (2023). Depression and stress are associated with latent profiles of problematic social media use among college students. Frontiers in Psychiatry, 14, Article 1306152. https://doi.org/10.3389/fpsyt.2023.1306152
Davis, M. H. (1983). Measuring individual differences in empathy: Evidence for a multidimensional approach. Journal of Personality and Social Psychology, 44(1), 113–126. https://doi.org/10.1037/0022-3514.44.1.113
Donati, M. A., Beccari, C., & Primi, C. (2022). Boredom and problematic Facebook use in adolescents: What is the relationship considering trait or state boredom? Addictive Behaviours, 125, Article 107132. https://doi.org/10.1016/j.addbeh.2021.107132
Eisenberg, N. (2000). Emotion, regulation, and moral Development. Annual Review of Psychology, 51, 665–697. https://doi.org/10.1146/annurev.psych.51.1.665
Flayelle, M., Schimmenti, A., Starcevic, V., & Billieux, J. (2022). The pitfalls of recycling substance-use disorder criteria to diagnose behavioral addictions. In N. Heather, M. Field, A. Moss, & S. Satel (Eds.), Evaluating the brain disease model of addiction (pp. 339–349). Routledge. http://dx.doi.org/10.4324/9781003032762-34
Fournier, L., Schimmenti, A., Musetti, A., Boursier, V., Flayelle, M., Cataldo, I., Starcevic, V., & Billieux, J. (2023). Deconstructing the components model of addiction: An illustration through “addictive” use of social media. Addictive Behaviors, 143, Article 107694. https://doi.org/10.1016/j.addbeh.2023.107694
Goleman, D. (2001). Emotional Intelligence: Issues in paradigm building. In D. Goleman & C. Cherniss (Eds.), The emotionally intelligent workplace: How to select for, measure, and improve emotional intelligence in individuals, groups, and organizations (pp. 13–26). Jossey-Bass.
Griffiths, M. (2005). A ‘components’ model of addiction within a biopsychosocial framework. Journal of Substance Use, 10(4), 191–197. http://doi.org/10.1080/14659890500114359
Guan, S. S. A., Hain, S., Cabrera, J., & Rodarte, A. (2019). Social media use and empathy: A mini meta-analysis. Social Networking, 8(4), 147–157. https://doi.org/10.4236/sn.2019.84010
Guarnaccia, C., Rasho, A. R., Testé, B., & Delouvée, S. (2024). Beyond the screen: A comprehensive analysis of emotional skills and social networking in French young adults. International Journal of Environmental Research and Public Health, 21(9), Article 1176. https://doi.org/10.3390/ijerph21091176
Guo, Z., Liang, S., Ren, L., Yang, T., Qiu, R., He, Y., & Zhu, X. (2022). Applying network analysis to understand the relationships between impulsivity and social media addiction and between impulsivity and problematic smartphone use. Frontiers in Psychiatry, 13, Article 993328. https://doi.org/10.3389/fpsyt.2022.993328
Hall, J. A., & Liu, D. (2022). Social media use, social displacement, and well-being. Current Opinion in Psychology, 46, Article 101339. https://doi.org/10.1016/j.copsyc.2022.101339
Hughes, D. J., & Evans, T. R. (2018). Putting ‘emotional intelligences’ in their place: Introducing the integrated model of affect-related individual differences. Frontiers in Psychology, 9, Article 2155. https://doi.org/10.3389/fpsyg.2018.02155
Hussain, Z., Kircaburun, K., Savcı, M., & Griffiths, M. D. (2023). The role of aggression in the association of cyberbullying victimization with cyberbullying perpetration and problematic social media use among adolescents. Journal of Concurrent Disorders. https://doi.org/10.54127/AOJW5819
Janicke-Bowles, S. H., Buckley, T. M., Rey, R., Wozniak, T., Meier, A., & Lomanowska, A. (2023). Digital flourishing: Conceptualizing and assessing positive perceptions of mediated social interactions. Journal of Happiness Studies, 24(3), 1013–1035. https://doi.org/10.1007/s10902-023-00619-5
Jeri-Yabar, A., Sanchez-Carbonel, A., Tito, K., Ramirez-del Castillo, J., Torres-Alcantara, A., Denegri, D., & Carreazo, Y. (2019). Association between social media use (Twitter, Instagram, Facebook) and depressive symptoms: Are Twitter users at higher risk? International Journal of Social Psychiatry, 65(1), 14–19. https://doi.org/10.1177/0020764018814270
Kardefelt‐Winther, D., Heeren, A., Schimmenti, A., Van Rooij, A., Maurage, P., Carras, M., Edman, J., Blaszczynski, A., Khazaal, Y., & Billieux, J. (2017). How can we conceptualize behavioural addiction without pathologizing common behaviours? Addiction, 112(10), 1709–1715. https://doi.org/10.1111/add.13763
Knezek, G., Christensen, R., & Gibson, D. (2022). Empathy: How can technology help foster its increase rather than decline in the 21st century? In Y. Wang, S. Joksimović, M. O. Z. San Pedro, J. D. Way, & J. Whitmer (Eds.), Social and emotional learning and complex skills assessment (pp. 51–73). Springer. https://doi.org/10.1007/978-3-031-06333-6_4
Koçak, O., Arslan, H., & Erdoğan, A. (2021). Social media use across generations: From addiction to engagement. European Integration Studies, 15, 63–77. http://dx.doi.org/10.5755/j01.eis.1.15.29080
Labouvie-Vief, G. (2015). Integrating emotions and cognition throughout the lifespan. Springer. https://doi.org/10.1007/978-3-319-09822-7_6
Lachmann, B., Sindermann, C., Sariyska, R. Y., Luo, R., Melchers, M. C., Becker, B., Cooper, A. J., & Montag, C. (2018). The role of empathy and life satisfaction in internet and smartphone use disorder. Frontiers in Psychology, 9, Article 398. https://doi.org/10.3389/fpsyg.2018.00398
Laurence, P.G., Busin, Y., & da Cunha Lima, H. S., & Macedo, E. C. (2020). Predictors of problematic smartphone use among university students. Psicologia: Reflexão e Crítica, 33(1), Article 8. https://doi.org/10.1186/s41155-020-00147-8
Lewin, K. M., Kaur, A., & Meshi, D. (2023). Problematic social media use and impulsivity. Current Addiction Reports, 10(3), 553–562. https://doi.org/10.1007/s40429-023-00495-2
Lin, S., Fabris, M. A., Longobardi, C., & Mastrokoukou, S. (2024). The association between social media addiction and aggressive behaviors: A longitudinal and gender‐specific analysis. Journal of Adolescence, 97(3), 798–807. https://doi.org/10.1002/jad.12454
Luo, T., Qin, L., Cheng, L., Wang, S., Zhu, Z., Xu, J., Chen, H., Liu, Q., Hu, M., Tong, J., Hao, W., Wei, B., & Liao, Y. (2021). Determination the cut-off point for the Bergen social media addiction (BSMAS): Diagnostic contribution of the six criteria of the components model of addiction for social media disorder. Journal of Behavioural Addictions, 10(2), 281–290. https://doi.org/10.1556/2006.2021.00025
Martínez-Ferrer, B., Moreno, D., & Musitu, G. (2018). Are adolescents engaged in the problematic use of social networking sites more involved in peer aggression and victimization? Frontiers in Psychology, 9, Article 801. https://doi.org/10.3389/fpsyg.2018.00801
Mayer, J. D., & Salovey, P. (1997). What is emotional intelligence? In P. Salovey & D. J. Sluyter (Eds.), Emotional development and emotional intelligence: Implications for educators (pp. 3–31). Basic Books. https://psycnet.apa.org/record/1997-08644-001
McNeish, D. (2018). Thanks coefficient alpha, we’ll take it from here. Psychological Methods, 23(3), 412–433. https://doi.org/10.1037/met0000144
Mestre-Escrivá, V., Frías-Navarro, M. D., & Samper-García, P. (2004). La medida de la empatía: Análisis del Interpersonal Reactivity Index [The measurement of empathy: Analysis of the Interpersonal Reactivity Index]. Psicothema, 16(2), 255–260. https://reunido.uniovi.es/index.php/PST/article/view/8243
Mirowska, A., & Arsenyan, J. (2023). Sweet escape: The role of empathy in social media engagement with human versus virtual influencers. International Journal of Human-Computer Studies, 174, Article 103008. https://doi.org/10.1016/j.ijhcs.2023.103008
Moretta, T., & Buodo, G. (2021). Response inhibition in problematic social network sites use: An ERP study. Cognitive, Affective, & Behavioral Neuroscience, 21(4), 868–880. https://doi.org/10.3758/s13415-021-00879-9
Moretta, T., Buodo, G., Demetrovics, Z., & Potenza, M. N. (2022). Tracing 20 years of research on problematic use of the internet and social media: Theoretical models, assessment tools, and an agenda for future work. Comprehensive Psychiatry, 112, Article 152286. https://doi.org/10.1016/j.comppsych.2021.152286
Müller, S. M., Wegmann, E., Oelker, A., Stark, R., Müller, A., Montag, C., Wölfling, K., Rumpf, H., & Brand, M. (2022). Assessment of criteria for specific internet-use disorders (ACSID-11): Introduction of a new screening instrument capturing ICD-11 criteria for gaming disorder and other potential internet-use disorders. Journal of Behavioral Addictions, 11(2), 427–450. https://doi.org/10.1556/2006.2022.00013
Nick, E. A., Cole, D. A., Cho, S.-J., Smith, D. K., Carter, T. G., & Zelkowitz, R. L. (2018). The Online Social Support Scale: Measure development and validation. Psychological Assessment, 30(9), 1127–1143. https://doi.org/10.1037/pas0000558
Nogueira-López, A., Rial-Boubeta, A., Guadix-García, I., Villanueva-Blasco, V. J., & Billieux, J. (2023). Prevalence of problematic internet use and problematic gaming in Spanish adolescents. Psychiatry Research, 326, Article 115317. https://doi.org/10.1016/j.psychres.2023.115317
Nylund, K. L. (2007). Latent transition analysis: Modeling extensions and an application to peer victimization [Doctoral dissertation, University of California]. https://www.statmodel.com/download/nylunddis.pdf
Oh, Y., Kim, Y., & Joung, Y. S. (2021). A latent profile analysis of problematic media device use and its association with executive function and behavioral problem among children: A population-based study. Psychiatry Investigation, 18(9), 895–903. https://doi.org/10.30773/pi.2021.0133
Pacheco, N. E., Rey, L., & Sánchez, N. (2019). Validation of the Spanish version of the Wong Law Emotional Intelligence Scale (WLEIS-S). Psicothema, 31(1), 94–100. https://doi.org/10.7334/psicothema2018.147
Peng, P., & Liao, Y. (2023). Six addiction components of problematic social media use in relation to depression, anxiety, and stress symptoms: A latent profile analysis and network analysis. BMC Psychiatry, 23(1), Article 321. https://doi.org/10.1186/s12888-023-04837-2
Perales, J. C., King, D. L., Navas, J. F., Schimmenti, A., Sescousse, G., Starcevic, V., Van Holst, R. J., & Billieux, J. (2020). Learning to lose control: A process-based account of behavioral addiction. Neuroscience & Biobehavioral Reviews, 108, 771–780. https://doi.org/10.1016/j.neubiorev.2019.12.025
Pi, L., Wang, Y., Zou, L., Mo, X., & Guo, L. (2024). An analysis of the latent class and influencing factors of problematic mobile social media usage among Chinese college students. Psychology Research and Behavior Management, 17, 367–378. https://doi.org/10.2147/PRBM.S438713
Piccerillo, L., & Digennaro, S. (2025). Adolescent social media use and emotional intelligence: A systematic review. Adolescent Research Review, 10(2), 201–218. https://doi.org/10.1007/s40894-024-00245-z
Raine, A., Dodge, K., Loeber, R., Gatzke-Kopp, L., Lynam, D., Reynolds, C., Stouthamer-Loeber, & Liu, J. (2006). The reactive-proactive aggression questionnaire: Differential correlates of reactive and proactive aggression in adolescent boys. Aggressive Behavior, 32(2), 159–171. https://doi.org/10.1002/ab.20115
Romero-Rodríguez, J. M., Marín-Marín, J. A., Hinojo-Lucena, F. J., & Gómez-García, G. (2022). An explanatory model of problematic internet use of southern Spanish university students. Social Science Computer Review, 40(5), 1171–1185. https://doi.org/10.1177/0894439321998650
Rothen, S., Briefer, J., Deleuze, J., Karila, L., Andreassen, C. S., Achab, S., Thorens, G., Khazaal, Y., Zullino, D., & Billieux, J. (2018). Disentangling the role of users’ preferences and impulsivity traits in problematic Facebook use. PLoS One, 13(9), Article e0201971. https://doi.org/10.1371/journal.pone.0201971
Saladino, V., Verrastro, V., Cannavò, M., Calaresi, D., & Barberis, N. (2024). Emotion dysregulation and problematic social media use: The role of need fulfillment and fear of missing out. Current Psychology, 43(26), 22200–22211. https://doi.org/10.1007/s12144-024-06005-5
Sechi, C., Loi, G., & Cabras, C. (2020). Addictive internet behaviors: The role of trait emotional intelligence, self‐esteem, age, and gender. Scandinavian journal of psychology, 62(3), 409–417. https://doi.org/10.1111/sjop.12698
Shannon, H., Bush, K., Villeneuve, P. J., Hellemans, K. G., & Guimond, S. (2022). Problematic social media use in adolescents and young adults: Systematic review and meta-analysis. JMIR Mental Health, 9(4), Article e33450. https://doi.org/10.2196/33450
Simsir-Gokalp, Z., & Akyurek, M. I. (2024). Self-control and problematic social media use: A meta-analysis. Journal of Education in Science, Environment and Health,10(3), 199–215. https://doi.org/10.55549/jeseh.722
Starcevic, V. (2016). Tolerance and withdrawal symptoms may not be helpful to enhance understanding of behavioural addictions. Addiction, 111(7), 1307–1308. https://doi.org/10.1111/add.13381
Su, W., Han, X., Yu, H., Wu, Y., & Potenza, M. N. (2020). Do men become addicted to internet gaming and women to social media? A meta-analysis examining gender-related differences in specific internet addiction. Computers in Human Behavior, 113, Article 106480. https://doi.org/10.1016/j.chb.2020.106480
The jamovi project (2022). Jamovi (Version 2.3) [Computer Software]. https://www.jamovi.org
Tullett-Prado, D., Stavropoulos, V., Gomez, R., & Doley, J. (2023). Social media use and abuse: Different profiles of users and their associations with addictive behaviours. Addictive Behaviors Reports, 17, Article 100479. https://doi.org/10.1016/j.abrep.2023.100479
Van den Eijnden, R. J., Lemmens, J. S., & Valkenburg, P. M. (2016). The Social Media Disorder Scale. Computers in Human Behaviour, 61, 478–487. https://doi.org/10.1016/j.chb.2016.03.038
Vanden Abeele, M. M. (2021). Digital wellbeing as a dynamic construct. Communication Theory, 31(4), 932–955. https://doi.org/10.1093/ct/qtaa024
Vaziri-Harami, R., Heidarzadeh, F., & Kheradmand, A. (2020). Relationship between mobile phone addiction and Narcissistic personality disorder among medical students. Archives of Clinical Psychiatry, 48(1), 24–48. https://archivespsy.com/menu-script/index.php/ACF/article/view/216
Verdejo-García, A., Lozano, Ó., Moya, M., Alcázar, M. Á., & Pérez-García, M. (2010). Psychometric properties of a Spanish version of the UPPS–P Impulsive Behavior Scale: Reliability, validity and association with trait and cognitive impulsivity. Journal of Personality Assessment, 92(1), 70–77. http://doi.org/10.1080/00223890903382369
Wegmann, E., Müller, S. M., Turel, O., & Brand, M. (2020). Interactions of impulsivity, general executive functions, and specific inhibitory control explain symptoms of social-networks-use disorder: An experimental study. Scientific Reports, 10(1), Article 3866. https://doi.org/10.1038/s41598-020-60819-4
Weller, B. E., Bowen, N. K., & Faubert, S. J. (2020). Latent class analysis: A guide to best practice. Journal of Black Psychology, 46(4), 287–311. https://doi.org/10.1177/0095798420930932
Williams, M., Lewin, K. M., & Meshi, D. (2024). Problematic use of five different social networking sites is associated with depressive symptoms and loneliness. Current Psychology, 43(24), 20891–20898. https://doi.org/10.1007/s12144-024-05925-6
Wong, C. S., & Law, K. S. (2002). The effects of leader and follower emotional intelligence on performance and attitude: An exploratory study. Leadership Quarterly, 13(3), 243–274. https://doi.org/10.1016/S1048-9843(02)00099-1
Wong, N., Yanagida, T., Spiel, C., & Graf, D. (2022). The association between appetitive aggression and social media addiction mediated by cyberbullying: The moderating role of inclusive norms. International Journal of Environmental Research and Public Health, 19(16), Article 9956. https://doi.org/10.3390/ijerph19169956
World Health Organization. (2022). International classification of diseases (ICD-11). https://icd.who.int/en
Authors' Contribution
Alfredo Zarco-Alpuente: writing—review & editing, writing—original draft, visualization, validation, software, methodology, investigation, formal analysis, data curation, conceptualization. Victor Ciudad-Fernández: writing—review & editing, writing—original draft, visualization, validation, software, methodology, investigation, formal analysis, data curation. Marta Carrique-Martínez: conceptualization, visualization and writing—review & editing. Lucas Serrano-Pastor: conceptualization, visualization and writing—review & editing. Elisabeth Malonda-Vidal: data curation, project administration, supervision and writing—review & editing. Anna Llorca-Mestre: data curation, project administration, supervision and writing—review & editing. Rafael García-Ros: data curation, project administration, supervision and writing—review & editing. Paula Samper-García: data curation, project administration, supervision and writing—review & editing.
Editorial Record
First submission received:
October 4, 2024
Revisions received:
March 3, 2025
April 29, 2025
June 3, 2025
Accepted for publication:
June 17, 2025
Editor in charge:
Maèva Flayelle
Introduction
The use of social networks (SN) has become an integral part of people's daily lives, groups, and institutions worldwide (Vanden Abeele, 2021). With the rapid adoption of SN, some users may develop problematic usage patterns, characterized by excessive engagement with SN platforms, thus leading to negative consequences in personal, professional, or social functioning (Cataldo et al., 2022). Researchers highlight that functional impairment serves as a crucial feature that distinguishes Problematic Social Network Use (PSNU) from behaviours that, although intense, do not interfere with daily functioning or well-being (Fournier et al., 2023; Moretta et al., 2022).
The prevalence rates of PSNU have shown to be inflated and inconsistent, highlighting significant measurement challenges. For example, a meta-analysis reported an overall pooled prevalence of 24%, with individual study estimates ranging from 0% to 82% (Cheng et al., 2021), reflecting the lack of a standardized framework and assessment tools. To address these issues, tools like the Social Media Disorder Scale (SMD-S) have emerged, which increase the emphasis on functional impairment (Van den Eijnden et al., 2016). The measurement of PSNU has been largely guided by the components model of addiction (Griffiths, 2005), which focuses on criteria such as salience, mood modification, tolerance, withdrawal symptoms, conflict, and relapse. However, Fournier et al. (2023) emphasize the importance of functional impairment as a key feature of problematic behaviour. In line with this perspective, the SMD-S incorporates four conflict-related items specifically linked to SN use, offering a more precise approach to identifying genuinely problematic behaviours (Van den Eijnden et al., 2016). This approach aligns with the World Health Organization’s ICD-11 framework, which highlights functional impairment and loss of control as core features of “other specified disorders due to addictive behaviours” (Brand et al., 2022; WHO, 2022). Drawing on a growing body of evidence that individuals with PSNU frequently experience such impairments, Brand et al. (2022) have advocated for its inclusion in diagnostic classification systems like the ICD-11.
Nonetheless, not all users who exhibit PSNU do so in the same way. To gain a more nuanced understanding of this phenomenon, it is crucial to explore the subtypes within the PSNU population, and the variables associated with each. In this regard, Latent Class Analysis (LCA) has been extensively applied to identify distinct PSNU profiles. For example, Boer, Stevens, et al. (2022) identified three profiles—problematic, risky, and normative—among 6,626 adolescents in the Netherlands, finding that problematic users faced the most significant mental health, academic, and sleep issues, while risky users also reported more problems than normative users. Other studies have likewise identified three latent classes (Cerniglia et al., 2019; Cheng et al., 2022; Oh et al., 2021; Pi et al., 2024; Tullet-Prado et al., 2023), although some have proposed models with five classes (Luo et al., 2021; Peng & Liao, 2023), but a three-latent-class approach would have been plausible in these studies. These more expanded models tend to subdivide the functional and at-risk profiles: functional users are split into “casual” and “regular” users, while at-risk users are divided into groups with differing levels of engagement and risk (Luo et al., 2021; Peng & Liao, 2023).
In turn, understanding the variables associated with PSNU is critical for capturing its multifaceted nature. Drawing on previous empirical research, the present study focuses on four psychological constructs that have shown consistent associations with PSNU: impulsivity, emotional intelligence, empathy and aggression. While our selection was primarily driven by empirical evidence, two of these variables, impulsivity and emotional intelligence, can also be meaningfully situated within the explanatory mechanisms proposed by the Interaction of Person-Affect-Cognition-Execution (I-PACE) model (Brand et al., 2016, 2019). According to this model, internet-related disorders emerge from the interaction of three layers. Initially, predisposing factors (P) such as stable personality traits, genetic influences, psychopathology, and early developmental experiences create an underlying vulnerability. Upon encountering specific internal or external cues, individuals experience affective and cognitive reactions (A/C), including cravings, mood alterations, and biased expectations regarding potential rewards. Finally, executive functions (E), particularly inhibitory control, determine whether these emotional and cognitive responses escalate into excessive, problematic behaviours by either suppressing or permitting the impulses triggered by cues (Brand et al., 2016, 2019).
Within this framework, impulsivity is conceptualized as a predisposing personality trait located in the P layer, whose influence on PSNU severity is particularly evident when combined with reductions in general executive functions or specific inhibitory control (Wegmann et al., 2020). Recent meta-analytic evidence further confirms a moderate association (r = .41) between impulsivity and PSNU (Augner et al., 2023), with recent studies hypothesizing a bidirectional relationship, whereby impulsive individuals may be more prone to PSNU, and excessive SN use may in turn exacerbate impulsive tendencies through the immediate social rewards provided by the platforms (Lewin et al., 2023).
In turn, emotional intelligence, defined as the capacity to perceive, appraise, and regulate emotions in ways that foster adaptive functioning (Mayer & Salovey, 1997), is also conceptualized within the I-PACE framework as a predisposing personality trait located in the P layer. Higher trait emotional intelligence directly reduces vulnerability to problematic internet-related use by negatively influencing affective and cognitive responses and reinforcing executive control, thereby diminishing the likelihood that such reactions escalate into addictive behaviours (Sechi et al., 2020). In this study, emotional intelligence was considered as a whole, rather than focusing solely on regulation skills, because it subsumes both appraisal and regulation processes, offering a broader and more stable protective factor (Hughes & Evans, 2018; Mayer & Salovey, 1997). Empirical reviews support that individuals with higher emotional intelligence are less prone to PSNU, partly because they are less likely to rely on these platforms to alleviate negative emotions (Arrivillaga et al., 2022; Piccerillo & Digennaro, 2025).
Building on this, empathy, an essential component of emotional intelligence (Goleman, 2001), is another protective factor potentially linked to PSNU (Coyne et al., 2018; Guan et al., 2019; Knezek et al., 2022; Mirowska & Arsenyan, 2023). Empathic response entails the ability to understand another person, put oneself in their shoes, and take their perspective based on observations, verbal information, or memories, along with an affective response of sharing their emotional state (Eisenberg, 2000). Lower empathy levels predispose individuals towards self-centered online rewards, indirectly elevating PSNU risk by reinforcing maladaptive reward patterns (Guarnaccia et al., 2024).
Aggression, defined as actions intended to harm others physically, emotionally, or socially (Crick & Dodge, 1996), has also emerged as a risk factor associated with PSNU (Hussain et al., 2023; Lin et al., 2024; N. Wong et al., 2022). Research distinguishes between reactive aggression (emotion-driven responses to perceived threats) and proactive aggression (goal-oriented behaviours aimed at obtaining benefits or resolving conflicts), both of which have been linked to higher PSNU scores (Martínez-Ferrer et al., 2018). Collectively, these four constructs—impulsivity, emotional intelligence, empathy and aggression—span complementary risk-and-protective factors, justifying their inclusion in the present study.
Lastly, a number of sociodemographic variables and digital preferences have been linked to PSNU in the literature. Regarding gender, early research suggests that females are more prone to PSNU, while males are more likely to report disordered internet gaming (Su et al., 2020). However, more recent meta-analytic evidence offers a less consistent picture, with some reviews finding no significant gender differences in PSNU prevalence (Casale et al., 2023: Cheng et al., 2021), indicating that the overall evidence remains inconclusive. Age is also a critical factor, with studies indicating that adolescents and young adults are at greater risk of developing PSNU (Shannon et al., 2022). Marital status has been associated with other problematic online behaviours, such as internet and mobile phone addiction (Romero-Rodríguez et al., 2022; Vaziri-Harami et al., 2020), suggesting it may also play a role in PSNU. Higher educational attainment is linked to increased social media addiction, with greater dependency among those completing secondary school or higher education (Koçak et al., 2021). Furthermore, technological features themselves have been associated with PSNU. Platform-specific characteristics and interaction dynamics shape user engagement, dependency patterns, and emotional responses, influencing the likelihood of problematic use (Williams et al., 2024). In addition, device type has also been linked to problematic smartphone use, with participants who owned an iPhone exhibiting significantly higher problematic smartphone use scores compared to those who owned Samsung or other smartphone brands (Laurence et al., 2020).
In this outlined context, the objective of the present study is (1) to explore user profiles of SN in a sample of the general population. Subsequently, to assess the validity of the formed groups, it aims to (2) contrast the differences between these groups in sociodemographic data, digital preferences and relevant variables that scientific literature has associated with PSNU, such as impulsivity, emotional intelligence, empathy, and aggression.
Method
Participants
A total of 726 participants completed the survey with ages ranging from 16 to 67 years (M = 22.31; SD = 7.49). Table 1 presents the sociodemographic data of the sample. The majority of participants are women (n = 559; 77.0%), while the proportion of men is lower (n = 157; 21.6%). Regarding marital status, a large portion of participants are single (n = 398; 54.8%) or in a relationship (n = 318; 43.8%). Furthermore, a significant proportion of participants have attained higher education, with 476 individuals having completed an undergraduate degree (65.6%), while 69 obtained a master's degree (9.5%).
Table 1. Sample Description.
|
Demographics |
n or M |
% or SD |
|
Age |
22.31 |
7.49 |
|
Gender |
||
|
Male |
157 |
21.6% |
|
Female |
559 |
77.0% |
|
Prefer not to answer |
6 |
0.8% |
|
Other |
4 |
0.6% |
|
Marital status |
||
|
Single |
398 |
55.0% |
|
In a relationship |
288 |
39.8% |
|
Married |
30 |
4.1% |
|
Divorced |
2 |
0.3% |
|
Separated |
4 |
0.6% |
|
Widowed |
1 |
0.1% |
|
Education |
||
|
No education |
2 |
0.3% |
|
Primary education |
2 |
0.3% |
|
Secondary education (ESO) |
10 |
1.4% |
|
Vocational education and training (intermediate/higher) |
49 |
6.7% |
|
Baccalaureate |
105 |
14.5% |
|
University degree |
476 |
65.6% |
|
University master's degree |
69 |
9.5% |
|
PhD |
13 |
1.8% |
|
Have installed a social network |
726 |
100% |
|
Note. M = Mean, SD = Standard Deviation. Depending on the type of variable (categorical or quantitative), frequencies or means and percentages or standard deviations are shown. There were three missing values in the Marital Status variable. |
||
Procedure
The research was conducted through a secure online platform (Lime Survey), and participants accessed it through study presentations in various classrooms at the University of Valencia banners posted on SN (Facebook and Instagram), and/or through advertising posters. The inclusion criteria to access the survey were: (1) being over 16 years old, (2) being a resident of Spain and (3) actively using any SN platform on their smartphone, such as Instagram, WhatsApp, or TikTok. This study received approval from the University of Valencia ethics committee (2039883). Prior to participation, all individuals were fully briefed on the study’s objectives and gave their informed consent. Participants did not receive any compensation for their participation. Data collection took place between September and October 2023.
Instruments
The instruments used to assess the variables measured in the study are described below.
Sociodemographic Data
Participants were asked to indicate their gender, age, place of residence, marital status, level of education and employment status.
Digital Preferences
Participants were asked to indicate their smartphone brand and their three favourite SNs through an open-ended question.
Problematic Social Network Use (PSNU)
PSNU was measured using the Spanish version of the SMD-Scale (Boer, Van Den Eijnden, et al., 2022; Van den Eijnden et al., 2016). The SMD-S consists of 9 dichotomous items (No/Yes) assessing salience, tolerance, withdrawal, mood modification, conflict, relapse, problems in important life areas, displacement of activities and deception, with questions such as: During the past year, have you regularly found that you can't think of anything else but the moment you will be able to use social media again? (preoccupation). The internal consistency of this scale was .81 in its original validation (Boer, Van Den Eijnden, et al., 2022). In our study, the internal consistency was high (α = .81; ω = .86).
Impulsivity
Impulsivity was measured using the Spanish version of the UPPS-S (Cándido et al., 2012; Verdejo-García et al., 2010). The UPPS-S is a multidimensional inventory assessing 5 subscales measuring impulsive behaviour: negative urgency, lack of perseverance, lack of premeditation, sensation seeking, and positive urgency. Items are rated on a 4-point Likert scale ranging from 1 (strongly agree) to 4 (strongly disagree), with an example item being: I usually think carefully before I do anything. In the Spanish adaptation, internal consistency using Cronbach’s α was .68 for negative urgency, .78 for lack of premeditation, .79 for lack of perseverance, .81 for sensation seeking, and .61 for positive urgency (Cándido et al., 2012). In our study, the internal consistency of all subscales was higher than .75 (positive urgency: α = .75; ω = .80; negative urgency: α = .84; ω = .87; lack of perseverance: α = .83; ω = .87; lack of premeditation: α = .82; ω = .83; sensation seeking: α = .87; ω = .90).
Emotional Intelligence
Emotional intelligence was measured using the Spanish version of the Wong Law Emotional Intelligence Scale (WLEIS-S; Pacheco et al., 2019; C. S. Wong & Law, 2002). The WLEIS-S is a questionnaire measuring four aspects of emotional intelligence: self-emotion appraisal, others' emotion appraisal, use of emotions, and regulation of emotions, as well as an overall score in emotional intelligence. Responses are given using a 7-point Likert scale ranging from 1 (strongly disagree) to 7 (strongly agree), with questions such as: I am quite capable of controlling my own emotions. In the Spanish adaptation, internal consistency was .91 for self-emotion appraisal, .81 for others' emotion appraisal, .81 for use of emotions, .84 for regulation of emotions, and .91 for total emotional intelligence (Pacheco et al., 2019). The internal consistency of all emotional intelligence subscales was high to excellent (self-emotion appraisal: α = .88; ω = .90; others' emotion appraisal: α = .86; ω = .90; use of emotions: α = .87; ω = .91; regulation of emotions: α = .90; ω = .92; total emotional intelligence: α = .91; ω = .94).
Empathy
Empathy was measured using the Spanish version of the Interpersonal Reactivity Index (IRI; Davis, 1983; Mestre-Escrivà et al., 2004). The IRI is a scale assessing four dimensions of empathy: fantasy, perspective taking, empathic concern, and personal distress, although only a selection of items from the perspective taking and empathic concern subscales were utilized. Items are rated on a 5-point Likert scale ranging from 1 (does not describe me well) to 5 (describes me very well), with an example item being: I would describe myself as a fairly sensitive person. In the Spanish adaptation, internal consistency was .56 for perspective taking and .59 for empathic concern (Mestre-Escrivà et al., 2004). In our study, both the reliability of the perspective taking subscale (α = .80; ω = .85) and empathic concern subscale (α = .83; ω = .86) were high.
Aggressive Behaviour
Aggression was measured using a selection of items from the Spanish version of the Reactive-Proactive Aggression Questionnaire (RPQ; Andreu Rodríguez et al., 2009; Raine et al., 2006). The RPQ is a scale assessing two dimensions of aggression: reactive and proactive. Items are rated on a 3-point Likert scale ranging from 1 (never) to 3 (often), with questions such as: I have threatened or intimidated someone. In the Spanish adaptation, internal consistency was .84 for reactive aggression and .87 for proactive aggression (Andreu Rodríguez et al., 2009). In our study, the internal consistency of both subscales was high (reactive: α = .78; ω = .86; proactive: α = .78; ω = .85).
Analysis
First, a graphical and statistical analysis of the data was conducted to identify possible anomalies. Subsequently, the internal consistency of the scales was evaluated using McDonald's ω and Cronbach's α (McNeish, 2018). Since the response scale of the questionnaires are categorical (ordinal or dichotomous), polychoric or tetrachoric matrices were used to compute these values (Bonanomi et al., 2013; Chakraborty & Chechi, 2020).
Next, Latent Class Analysis (LCA) was applied. This method, similar to cluster analysis, is used to identify latent classes in a population based on multivariate categorical data, allowing for the use of binary variables. In our study, the 9 criteria of the SMD-S were selected as indicators. Subsequently, several LCA models were estimated and compared (from 2 to 6 latent classes) since there were no clear hypotheses about the optimal number of subgroups. The choice of the number of latent classes was based on various criteria, such as the Akaike Information Criterion (AIC), the Consistent Akaike Information Criterion (CAIC), and the Bayesian Information Criterion (BIC). These indicators indicate a better fit of the model the lower the value (including negative numbers). Both AIC and BIC have been widely used to evaluate the comparative fit of structural equation models, with both criteria applying a penalty for the number of parameters in the model. However, in this study, priority was given to the BIC value, as the penalty it applies is greater (Nylund, 2007). In addition, the value of entropy, which ranges from 0 to 1, was considered. This is another diagnostic indicator that indicates the accuracy with which the model defines the classes (Weller et al., 2020). The improvement in the deviation of each model compared to the previous one was also compared to determine if it was significant. Finally, the sample size of each obtained latent class model was examined, considering its interpretability. Since the selection of the number of latent classes does not necessarily indicate a single model as the most suitable, the results obtained in other similar studies in the context of PSNU were also taken into account.
Once the latent class model was selected, χ² tests were conducted to test the null hypothesis that the conditional probability distribution of each criterion was not significantly different between latent classes. Additionally, χ² tests were performed to assess the association between sociodemographic data, digital preferences, and their membership to the class. To determine the magnitude of the association, Cramer's V values were calculated. Cramer’s V values range from 0 to 1. The thresholds selected for interpretation are as follows: values greater than .25 suggest a very strong association; values exceeding .15 are considered strong; a value above .10 indicates a moderate association and values greater than .05 are deemed weak (Akoglu, 2018). Finally, several Analysis of Variance (ANOVA) models were conducted to assess the differences between latent classes in terms of age, empathy, aggression, impulsivity, and emotional intelligence. These models allow for the identification and quantification of mean differences between latent classes in terms of the studied variables, unlike other analyses used in the context of LCA such as using covariates or conducting logistic regressions. They are interesting for modelling latent classes because they characterize the mean scores of each subgroup generated in the model, highlighting the characteristics of the user types. In most models, the Fisher's F statistic was used as a contrast measure. However, in cases where the assumption of homogeneity of variances was not met, the robust version of this statistic, known as Welch's F, was used. Subsequently, post-hoc tests were conducted to assess specific differences between groups. The Games-Howell post-hoc test was used when group variances were significantly different, as determined by the Levene test. On the other hand, if no significant differences in variances were found, the Tukey post-hoc test was employed. All statistical analyses were performed using Jamovi v2.3 (The jamovi project, 2022).
Results
The results of the different latent class models evaluated in this study are presented in Table 2. Initially, a two-latent class model was tested, computing successive comparisons until reaching the six-latent class model.
Table 2. Summary of the Tested Latent Class Models.
|
Class |
Parameters |
−2LL |
AIC |
CAIC |
BIC |
Entropy |
df |
|
2 |
24 |
−3,043 |
6,124 |
6,230 |
6,211 |
.63 |
492 |
|
3 |
39 |
−2,992 |
6,043 |
6,205 |
6,176 |
.66 |
482 |
|
4 |
54 |
−2,963 |
6,005 |
6,223 |
6,184 |
.73 |
472 |
|
5 |
69 |
−2,952 |
6,002 |
6,276 |
6,227 |
.76 |
462 |
|
6 |
84 |
−2,942 |
6,001 |
6,331 |
6,272 |
.72 |
452 |
|
Note. Class = Number of latent classes in the model; Parameters = Number of free parameters in each model; −2LL = Log-Likelihood; AIC = Akaike Information Criterion; CAIC = Consistent AIC; BIC = Bayesian Information Criterion; df = Degrees of Freedom. |
|||||||
In the initial evaluation of the models, both CAIC and BIC reached their minimum scores in the model with three latent classes, although the AIC suggests that the model with four latent classes might be more suitable. However, priority was given to BIC values rather than AIC values (Nylund, 2007), thereby supporting the three latent classes solution. Upon analysing entropy, a relevant change was observed in the model with four latent classes, with its value increasing from .66 to .73. Additionally, the test to evaluate whether the difference between the model with one less class produced a significant difference in deviation showed significant results in all evaluated models.
Most studies focusing on SN tend to select three latent classes or profiles (Cerniglia et al., 2019; Cheng et al., 2022; Pi et al., 2024; Tullet-Prado et al., 2023), or they have chosen a different number of profiles, but nonetheless, the approach of three latent classes would have been plausible (Luo et al., 2021). Specifically, in the original validation of the questionnaire, it was found that the three latent class model was the most parsimonious, obtaining similar entropy to what was found in this study for the three-class model (Boer, Stevens, et al., 2022).
Therefore, according to fit indices, entropy, and previous literature, both the three latent class and four latent class solutions were feasible. Hence, both solutions were explored in this sample. However, in the four latent class model a prevalence of one of the latent classes was observed to be low (4.5%), resulting in a sample size of 33 participants for that class. Opting for the four latent class model would have posed difficulties in analysing mean differences among the different groups. Therefore, the decision was made to select the three latent class model for subsequent analysis. Detailed fit indices for all tested models can be found in the Supplementary Materials (see Figure A1).
The χ² tests indicated an association between membership group and the likelihood of scoring affirmatively on the criteria (p < .001) for all the items. These three classes are clearly distinguished in all the indicators employed to constitute the latent classes (see Figure 1). Additional information on the conditional probabilities of scoring positively on each item across latent classes can be found in the Appendix (see Table B1).
Figure 1. Probability of Scoring Negatively on Each of the Criteria for Each of the Latent Classes.
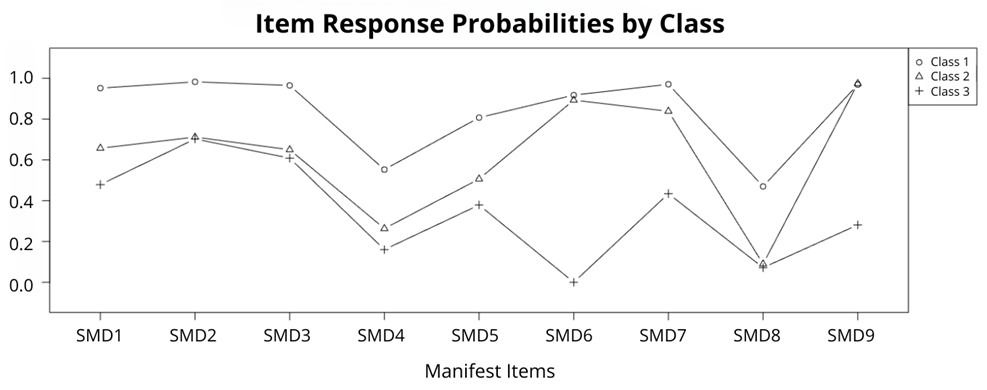
Note. Latent Class 1 = Functional users; Latent Class 2 = Risky users; Latent Class 3 = Problematic Users. SMD1 = Salience/Preoccupation; SMD2 = Tolerance; SMD3 = Withdrawal; SMD4 = Persistence; SMD5 = Displacement; SMD6 = Problem; SMD7 = Deception; SMD8 = Escape; SMD9 = Conflict.
The first latent class represents users who exhibit a functional use of SN. This class is characterized by a low probability of meeting the problematic criteria assessed in the scale. The second latent class describes users who show a risky use of SN, as they do not score on most of the evaluated criteria but do so on those indicating that SN use may lead them to neglect their leisure activities and have difficulties reducing their usage time, despite intending to do so, as well as a tendency to prioritize SN use as an emotional regulation strategy. Lastly, a third latent class composed of users with PSNU is identified. These users show a high probability of scoring positively on most items of the PSNU scale. In summary, the analysis reveals the existence of three latent classes representing different patterns of SN use: functional, risky, and problematic. The marginal prevalence of the latent class was .52 in the first, .41 in the second, and .08 in the last.
Table 3 shows the significance tests between latent classes, and sociodemographic data and digital preferences. The χ² analysis reveals an association between latent classes membership and gender (p < .001), marital status (p < .001), educational level achieved (p = .018), and Twitter preferences as favourite SN (p = .032). However, no significant association was found between smartphone brand (p = .142), preferences for TikTok (p = .074), Instagram (p = .073), and WhatsApp (p = .812), as favourite SN and membership in latent classes. According to Cramer’s V the association between membership in the latent class and the sociodemographic variables is lower than .20, being most of them strong, with the relationship between the user's digital preferences and their membership in the latent class being weaker.
Table 3. Characterization of Each of the Latent Classes.
|
|
Latent classes |
||||||||
|
|
1 |
2 |
3 |
|
|
|
|||
|
|
n |
% |
n |
% |
n |
% |
χ² |
p-value |
Cramer’s V |
|
Gender |
|
|
|
|
|
|
23.5 |
< .001 |
.127 |
|
Male |
99 |
13.7% |
45 |
6.2% |
12 |
1.7% |
|
|
|
|
Female |
275 |
38% |
241 |
33.3% |
42 |
5.8% |
|
|
|
|
Prefer not to answer |
4 |
0.6% |
0 |
0% |
2 |
0.3% |
|
|
|
|
Other |
0 |
0% |
3 |
0.4% |
1 |
0.1% |
|
|
|
|
Marital Status |
|
|
|
|
|
|
30.4 |
< .001 |
.145 |
|
Single |
206 |
28.5% |
160 |
22.2% |
32 |
4.4% |
|
|
|
|
In a relationship |
144 |
19.9% |
123 |
17% |
21 |
2.9% |
|
|
|
|
Married |
26 |
3.6% |
3 |
0.4% |
1 |
0.1% |
|
|
|
|
Divorced |
1 |
0.1% |
0 |
0% |
1 |
0.1% |
|
|
|
|
Separated |
1 |
0.1% |
1 |
0.1% |
2 |
0.3% |
|
|
|
|
Widowed |
0 |
0% |
0 |
0% |
0 |
0% |
|
|
|
|
Education |
|
|
|
|
|
|
51.5 |
< .001 |
.188 |
|
No education |
0% |
0 |
0% |
0 |
2 |
0.3% |
|
|
|
|
Primary education |
1 |
0.1% |
0% |
0 |
0% |
0 |
|
|
|
|
Secondary education |
10 |
1.4% |
1 |
0.1% |
0% |
0 |
|
|
|
|
Vocational training |
18 |
2.5% |
26 |
3.6% |
5 |
0.7% |
|
|
|
|
High school diploma |
51 |
7% |
39 |
5.4% |
15 |
2.1% |
|
|
|
|
University degree |
244 |
33.7% |
200 |
27.6% |
32 |
4.4% |
|
|
|
|
Master's degree |
45 |
6.2% |
19 |
2.6% |
3 |
0.4% |
|
|
|
|
PhD |
9 |
1.2% |
4 |
0.6% |
0 |
0% |
|
|
|
|
Smartphone |
|
|
|
|
|
|
19.858 |
.031 |
.142 |
|
iPhone |
64 |
37.21% |
155 |
54.20% |
17 |
45.95% |
|
|
|
|
Samsung |
35 |
20.35% |
44 |
15.38% |
4 |
10.81% |
|
|
|
|
Huawei |
12 |
6.98% |
9 |
3.15% |
3 |
8.11% |
|
|
|
|
Xiaomi |
44 |
25.58% |
53 |
18.53% |
10 |
27.03% |
|
|
|
|
LG |
2 |
1.16% |
0 |
0% |
0 |
0% |
|
|
|
|
Other brand |
15 |
8.72% |
25 |
8.74% |
3 |
8.11% |
|
|
|
|
TikTok |
|
|
|
|
|
|
2.7 |
.256 |
.074 |
|
No |
106 |
21% |
137 |
27.2% |
15 |
3% |
|
|
|
|
Yes |
84 |
16.7% |
148 |
29.3% |
14 |
2.8% |
|
|
|
|
|
|
|
|
|
|
|
3.8 |
.146 |
.073 |
|
No |
114 |
15.7% |
69 |
9.5% |
13 |
1.8% |
|
|
|
|
Yes |
264 |
36.5% |
220 |
30.4% |
44 |
6.1% |
|
|
|
|
|
|
|
|
|
|
|
6.9 |
.032 |
.098 |
|
No |
256 |
35.4% |
179 |
24.7% |
45 |
6.2% |
|
|
|
|
Yes |
122 |
16.9% |
110 |
15.2% |
12 |
1.7% |
|
|
|
|
|
|
|
|
|
|
|
.4 |
.812 |
.024 |
|
No |
95 |
13.1% |
78 |
10.8% |
16 |
2.2% |
|
|
|
|
Yes |
283 |
39.1% |
211 |
29.1% |
41 |
5.7% |
|
|
|
|
Note. The SNs included in the table are those that participants indicated as their favourites. Latent Class 1 = Functional users; Latent Class 2 = Risky users; Latent Class 3 = Problematic Users. |
|||||||||
Table 4 provides an overview of the one-way ANOVAs conducted to examine differences across latent classes (functional use, problematic use, and risky use) on age, impulsivity, emotional intelligence, empathy, and aggression. It highlights the mean scores and standard deviations for each variable within the latent classes, as well as the corresponding F-statistics and p-values. Only F-statistics reaching statistical significance were followed up with post-hoc tests. In Table 4, statistically significant differences were found between latent classes for all variables except for Empathic Concern (p = .079) and Sensation Seeking (p = .319).
Table 4. One-Way ANOVA for Psychological Variables and Age With Latent Class as the Independent Variable.
|
|
1 |
2 |
3 |
|
|
|||
|
|
n |
% |
n |
% |
n |
% |
|
|
|
|
378 |
52.2% |
289 |
39.9% |
57 |
7.9% |
|
|
|
|
M |
DT |
M |
DT |
M |
DT |
F |
p |
|
Age |
23.70 |
9.26 |
20.80 |
4.01 |
21.60 |
7.53 |
15.20 |
< .001 |
|
Empathic concern |
19.18 |
3.26 |
19.38 |
3.28 |
18.12 |
3.65 |
2.55 |
.079 |
|
Perspective taking |
18.85 |
3.42 |
18.71 |
3.32 |
17.14 |
4.08 |
4.51 |
.011 |
|
Reactive aggression |
1.61 |
0.25 |
1.66 |
0.27 |
1.82 |
0.34 |
7.39 |
.001 |
|
Proactive aggression |
1.40 |
0.24 |
1.41 |
0.22 |
1.62 |
0.32 |
8.16 |
< .001 |
|
Positive urgency |
2.72 |
0.56 |
2.49 |
0.56 |
2.36 |
0.67 |
17.6 |
< .001 |
|
Sensation seeking |
2.52 |
0.72 |
2.47 |
0.64 |
2.37 |
0.82 |
1.15 |
.319 |
|
Lack of premeditation |
3.29 |
0.53 |
3.21 |
0.55 |
3.08 |
0.61 |
4.02 |
.018 |
|
Lack of perseverance |
3.34 |
0.55 |
3.08 |
0.60 |
2.88 |
0.67 |
22.33 |
< .001 |
|
Negative urgency |
2.77 |
0.70 |
2.52 |
0.67 |
2.30 |
0.75 |
17.57 |
< .001 |
|
Appraisal of one’s own emotions |
5.26 |
1.08 |
4.82 |
1.16 |
4.54 |
1.20 |
16.97 |
< .001 |
|
Appraisal of others’ emotions |
5.68 |
0.86 |
5.63 |
0.87 |
5.34 |
1.00 |
3.29 |
.038 |
|
Use of emotions |
5.09 |
1.23 |
4.61 |
1.18 |
4.54 |
1.25 |
13.46 |
< .001 |
|
Emotional regulation |
4.81 |
1.22 |
4.30 |
1.22 |
3.77 |
1.07 |
23.00 |
< .001 |
|
Emotional intelligence |
5.20 |
0.82 |
4.84 |
0.82 |
4.54 |
0.86 |
22.32 |
< .001 |
|
Note. Empathic concern = IRI Empathic concern; Perspective taking = IRI Perspective taking; Reactive aggression = RPQ Reactive aggression; Proactive aggression = RPQ Proactive aggression ; Positive urgency = UPPS Positive urgency; Sensation seeking = UPPS Sensation seeking; Lack of premeditation = UPPS Lack of premeditation; Lack of perseverance = UPPS Lack of perseverance; Negative Urgency = UPPS Negative urgency; Appraisal of one’s own emotions = WLEIS Appraisal of one’s own emotions; Appraisal of others’ emotions = WLEIS Appraisal of others’ emotions; Use of emotions = WLEIS Use of emotions; Emotional regulation = WLEIS Emotional regulation; Emotional intelligence = WLEIS Emotional intelligence (global score). Latent Class 1 = Functional users; Latent Class 2 = Risky users; Latent Class 3 = Problematic Users. |
||||||||
Table 5 shows the post-hoc tests carried out to compare the latent classes pairwise with each other. Significant differences are observed across different variables.
First, in terms of age, members of latent class 1 are significantly older than those of latent class 2 (p < .001). Regarding facets of impulsivity, significant differences emerged. The UPPS scale indicates that lower scores reflect a higher tendency towards impulsivity. Therefore, members of the functional use latent class scored significantly higher on positive urgency and negative urgency compared to both the problematic (p < .001; p < .001, respectively) and risky classes (p < .001; p < .001, respectively), indicating that latent classes 2 and 3 have a greater propensity to be swayed by emotions of positive and negative valence. Additionally, members of the functional use class also scored significantly higher than members of the problematic class on lack of premeditation (p = .024). Lastly, lack of perseverance scores was significantly lower in the risky group (p < .001) and the problematic group (p < .001) compared to the functional group.
Regarding the ANOVA models that evaluated emotional intelligence, all of them yielded significant results. Specifically, concerning self-emotion appraisal, functional users reported better ability compared to both risky (p < .001) and problematic users (p < .001). Concerning others' emotion appraisal, problematic users reported lower ability compared to functional users (p = .029). Regarding use of emotions, scores were significantly higher in functional users compared to both risky (p < .001) and problematic users (p < .001). Regarding regulation of emotions, latent class 1 showed a higher score compared to classes 2 (p < .001) and 3 (p < .001). Additionally, latent class 2 presented higher scores in this construct compared to latent class 3 (p < .001). Lastly, the global factor of emotional intelligence and, others' emotion appraisal scores were significantly higher in the functional use group compared to both problematic (p < .001) and risky users (p < .001).
Table 5. Post-hoc Tests for Psychological
Variables and Age With Latent Class as the Independent Variable.
|
Pairwise comparisons |
||||||
|
|
1 vs. 2 |
1 vs. 3 |
2 vs. 3 |
|||
|
|
t |
p |
t |
p |
t |
p |
|
Age |
5.53 |
< .001 |
1.94 |
.134 |
0.77 |
.720 |
|
Empathic concern |
0.66 |
.789 |
1.94 |
.129 |
2.26 |
.063 |
|
Perspective taking |
0.42 |
.908 |
2.99 |
.008 |
2.70 |
.020 |
|
Reactive aggression |
1.92 |
.134 |
3.63 |
.002 |
2.73 |
.024 |
|
Proactive aggression |
0.64 |
.801 |
4.05 |
< .001 |
3.77 |
.001 |
|
Positive urgency |
5.02 |
< .001 |
4.26 |
< .001 |
1.52 |
.282 |
|
Sensation seeking |
1.04 |
.551 |
1.32 |
.391 |
0.84 |
.679 |
|
Lack of premeditation |
1.66 |
.221 |
2.62 |
.024 |
1.69 |
.208 |
|
Lack of perseverance |
5.55 |
< .001 |
4.73 |
< .001 |
2.03 |
.113 |
|
Negative Urgency |
4.68 |
< .001 |
4.64 |
< .001 |
2.06 |
.098 |
|
Appraisal of one’s own emotions |
4.89 |
< .001 |
4.22 |
< .001 |
1.58 |
.257 |
|
Appraisal of others’ emotions |
0.70 |
.767 |
2.56 |
.029 |
2.15 |
.080 |
|
Use of emotions |
4.83 |
< .001 |
2.96 |
.009 |
0.36 |
.930 |
|
Emotional regulation |
5.07 |
< .001 |
5.56 |
< .001 |
2.80 |
.015 |
|
Emotional intelligence |
5.31 |
< .001 |
5.19 |
< .001 |
2.30 |
.056 |
|
Note. Empathic concern = IRI Empathic concern; Perspective taking = IRI Perspective taking; Reactive aggression = RPQ Reactive aggression; Proactive aggression = RPQ Proactive aggression ; Positive urgency = UPPS Positive urgency; Sensation seeking = UPPS Sensation seeking; Lack of premeditation = UPPS Lack of premeditation; Lack of perseverance = UPPS Lack of perseverance; Negative Urgency = UPPS Negative urgency; Appraisal of others’ emotions = WLEIS Appraisal of others’ emotions; Appraisal of one’s own emotions = WLEIS Appraisal of one’s own emotions; Use of emotions = WLEIS Use of emotions; Emotional intelligence = WLEIS; Emotional regulation = WLEIS Emotional regulation; Emotional intelligence (global score). Latent Class 1 = Functional users; Latent Class 2 = Risky users; Latent Class 3 = Problematic Users. |
||||||
Regarding empathy, there are significant differences in perspective taking (p < .001) across groups. Non-problematic users reported a higher score on perspective taking compared to problematic users (p < .001). Additionally, risky users also displayed higher scores on this construct compared to problematic users (p = .020). In relation to aggression, problematic users have significantly higher levels of proactive aggression compared to functional (p < .001). Problematic users also show higher scores on this variable compared to risky users (p < .001). Problematic users also display higher reactive aggression scores compared to both functional (p = .002) and risky users (p = .024). However, there are no significant differences in any of the dimensions of empathy or aggression between functional users and those at risk.
Discussion
The present study had two objectives: 1) To define profiles of problematic SN users and 2) to contrast the differences between these groups in sociodemographic data, digital preferences, impulsivity, emotional intelligence, empathy, and aggression.
The first objective was the analysis of SN user profiles in a sample of the Spanish general population. The results of the Latent Class Analysis (LCA) identified three types of SN users based on the manifestation of maladaptive SN use characteristics. The selection of the three latent class model was due to the value of the information criteria, the value of entropy, the interpretability of the model compared to the higher-class model, and previous evidence. Specifically, most studies focused on SN usually select three latent classes or profiles (Boer, Stevens, et al., 2022; Cerniglia et al., 2019; Cheng et al., 2022; Pi et al., 2024; Tullet-Prado et al., 2023), or have selected a different number of profiles, but likewise, the three latent class approach would have been plausible (Luo et al., 2021). Using this model, three distinct groups were identified based on their sociodemographic and psychological characteristics related to PSNU: functional, at risk, and problematic.
There are a series of user characteristics that are differentially associated with the various latent classes. Specifically, items related to discussions and conflicts due to SN use serve as key indicators for differentiating among latent classes, although all items showed discriminatory capacity. Previous research highlights the critical role of conflict-related criteria, with some authors emphasizing that functional impairment is a sine qua non condition for diagnosing PSNU (Fournier et al., 2023; Kardefelt‐Winther et al., 2017). In addition, displacing other activities as a result of SN use has also been noted as an important warning sign of PSNU. Therefore, incorporating these variables is crucial for detecting PSNU. Notably, without the inclusion of the four conflict-related items specifically tied to SN use in the SMD Scale (Van den Eijnden et al., 2016), distinguishing the problematic class from the risky class might not have been possible.
Additionally, another subgroup of items has been found to differentiate users who engage in appropriate or functional use of SN from those who are at risk or have already developed problematic use. These items refer to displacing other activities as a result of their SN use, attempting to reduce their time on SN but failing, and using them as a strategy for emotional regulation. On one hand, the growing use of SN appears to displace other daily activities and adaptive behaviours. Hall and Liu (2022) found that increased time spent on SN often replaces activities such as working, internet browsing, or completing household tasks (Ciudad-Fernández et al., 2024). Moreover, when individuals reduce their SN usage, they tend to reintegrate these displaced activities into their routines. On the other hand, using SN as emotional regulators to the point that they are the only way to do so (i.e., the priority strategy), as well as losing control over their ability to reduce use, will be characteristics that alert us that the individual is beginning to present a risk of developing PSNU (Ciudad-Fernández et al., 2024; Saladino et al., 2024). Again, when it comes to detection, these characteristics are of particular relevance, as they are often a signal that the person may be shifting from functional use towards problematic use (for a theoretical framework for the processes underlying the development and maintenance of problematic use of internet-related behaviours, see the I-PACE Model in Brand et al., 2016, 2019).
Furthermore, two least likely items to receive affirmative responses across the three subgroups are tolerance (Have you regularly felt dissatisfied because you wanted to spend more time using SN?) and withdrawal (Have you often felt bad when you couldn't use SN?). Regarding tolerance, the findings of this study are consistent with other research that suggests some peripheral criteria do not have the same validity in potential behavioural addictions, including SN use, as they do in substance addictions (Flayelle et al., 2022; Fournier et al., 2023; Starcevic, 2016). Tolerance may not be a relevant component in measuring PSNU because unlike substance use disorders, which often involves a need to progressively increase consumption to achieve the desired effect, SN use may not inherently follow this pattern. Instead, individuals who engage heavily with SN may do so for diverse motivations that are not necessarily linked to an escalating need for usage. Regarding withdrawal, the findings suggest that it does not play a significant role in detecting PSNU. Withdrawal symptoms in BAs are primarily emotional states, such as irritability, restlessness, or anxiety, rather than the severe physical symptoms associated with substance addictions (Flayelle et al., 2022; Starcevic, 2016) and in SN, studies point out to boredom or diffuse discomfort (Ciudad-Fernández et al., 2024; Donati et al., 2022), being classified as heavy involvement indicator rather than a negative consequence (Burén et al., 2023). Therefore, the debate on whether PSNU could be classified as a behavioural addiction or something else (e.g., dysregulated behaviour) still remains open.
Lastly, another idea that can be drawn from the LCA is that users categorized as at risk are closer, in terms of criteria of PSNU, to users who have developed a problem than to functional users. These results offer a possible explanation for those studies where the prevalence of problematic or addictive use is very high, such as a recent meta-analysis that reported a prevalence of PSNU between 0% and 82%, yielding a pooled estimate of about 24% (Cheng et al., 2021). Thus, when inclusion criteria are less restrictive, what may be happening is that many at risk users would be classified as problematic. Therefore, it is important to refine measurement instruments more and more to distinguish user profiles better and avoid “diagnostic inflation” (Flayelle et al., 2022) and reduce false positive diagnoses in line with the ICD-11 proposal (Nogueira-López et al., 2023; WHO, 2022).
The second objective of this study was to validate the formed groups by examining mean differences in sociodemographic data, digital preferences and four psychological constructs highlighted in the PSNU literature: impulsivity, emotional intelligence, empathy, and aggression. Chi-square tests revealed statistically significant relationships between class membership and these variables. Overall, the findings demonstrated distinctions between the subgroups of SN users. Specifically, in certain constructs (i.e., age, impulsivity and emotional intelligence), more differences were found between functional users and those at risk than between these and problematic users, while in other constructs (i.e., empathy and aggression), the difference was found between problematic users and the other two classes (at risk and functional).
Regarding sociodemographic variables, our study found that gender, marital status, and educational level are associated with the type of problematic or functional use of SN, as indicated in previous literature (Koçak et al., 2021; Shannon et al., 2022; Su et al., 2020). In terms of digital preferences, no significant association was found between smartphone brand or preferred SN, except for Twitter (currently rebranded as X). Other studies have shown that individuals who prioritize Twitter are more likely to experience depressive symptoms, suggesting that expressing emotions and seeking acceptance through SN interactions may increase the risk of PSNU and contribute to these symptoms (Jeri-Yabar et al., 2019). Regarding age, the results indicate that functional users are generally older than those at risk. This could be explained by the greater cognitive-emotional development that occurs as users transition into adulthood, which may serve as a protective factor against PSNU (Labouvie-Vief, 2015).
Regarding impulsivity, differences between user profiles were found in negative and positive urgency, lack of premeditation and lack of perseverance. These results are consistent with research indicating that PSNU is related to impulsivity (Lewin et al., 2023; Moretta & Buodo, 2021). Lewin et al. (2023) propose a bidirectional relationship, suggesting that PSNU may exacerbate impulsivity by impairing decision-making processes, while individuals with higher baseline impulsivity may be more prone to maladaptive SN use. Studies focusing on the facets of impulsivity proposed in the UPPS model demonstrate strong associations with PSNU. For instance, Rothen et al. (2018) found that problematic Facebook use correlated with rash actions following both negative and positive emotions, as well as difficulties in maintaining goals. Impulsivity deserves special attention, as this control mechanism appears central to the development and maintenance of PSNU (Brand et al., 2016, 2019; Perales et al., 2020). Consequently, individuals with higher impulsivity are likely to struggle with postponing SN use, particularly in situations involving intense emotional arousal (Billieux et al., 2008; Guo et al., 2022).
About emotional intelligence, differences between user profiles have been found in self-emotion appraisal, others' emotion appraisal, use of emotions, and regulation of emotions, and total score emotional intelligence, as in other studies (Arrivillaga et al., 2022; Calaresi et al., 2024; Piccerillo & Digennaro, 2025). Our findings suggests that emotional intelligence has been related to PSNU in all steps ranging from understanding our emotions to regulating them. One possible explanation explored by Piccerillo and Digennaro (2025) is that people who struggle to perceive and understand their own emotions may misinterpret social interactions online, leading to increased anxiety and reliance on SN for emotional regulation. Additionally, those who find it challenging to effectively regulate their emotions might use SN as a maladaptive coping mechanism, resulting in higher rates of PSNU. Thus, deficiencies in any of these emotional intelligence components can escalate the likelihood of engaging in problematic SN behaviours (Piccerillo & Digennaro, 2025). Building upon the conclusion of Arrivillaga et al. (2022), training in emotional intelligence skills could be considered a strategy to address a potential underlying cause of PSNU, taking into consideration all phases of the emotional intelligence development process.
Concerning empathy, differences between user profiles have been found in perspective-taking (spontaneous attempts to adopt the perspectives of others and see things from their point of view), but not in empathic concern (feelings of sympathy, compassion, and concern for others). In general, the findings suggest that individuals with lower levels of empathy (perspective-taking) may be more vulnerable to developing PSNU (Guan et al., 2019; Knezek et al., 2022; Mirowska & Arsenyan, 2023). This may be because SN provide a platform to interact with others without the need for direct contact, making individuals with low levels of empathy more likely to use SN to meet their social interaction needs that they are unable to achieve in a non-virtual environment due to the complications that may arise from not exhibiting appropriate empathic behaviour (Lachmann et al., 2018). Regarding differences in the subscales, it is possible that no differences are found in empathic concern, as online interactions are less conducive to eliciting such feelings compared to face-to-face interactions (Carrier et al., 2015). In contrast, perspective-taking may be more conducive to finding support in the virtual environment because it evaluates that spontaneous component of empathy that can more easily occur in SN (Nick et al., 2018).
Respecting aggression, differences between user profiles have been found in reactive and proactive aggression (Martínez-Ferrer et al., 2018). These findings suggest that individuals who have a greater tendency to react impulsively and emotionally to stressful situations may be more likely to use SN problematically (Arrivillaga et al., 2022; Lewin et al., 2023). Martínez-Ferrer et al. (2018) explains that proactive aggression has been associated with a reduced ability to delay gratifications, which suggests that individuals engaging in this type of aggression may prioritize potential benefits over the consequences of their actions (Crespo-Ramos et al., 2017). This behaviour could be linked to PSNU, as it suggests a tendency to act aggressively to achieve goals, reflecting issues with impulse control (Simsir-Gokalp & Akyurek, 2024). Reactive aggression similarly stems from impulse control difficulties, with individuals responding emotionally to perceived threats (Babcock et al., 2014). Both types of aggression, intensified by emotionally charged SN interactions, have been linked to a higher risk of PSNU, creating a cycle of increased aggression and further problematic behaviours (Martínez-Ferrer et al., 2018).
Limitations and Future Lines
One limitation of this study, like most research in the field, is the reliance on cross-sectional data. This poses challenges for establishing causal relationships between PSNU and mental health issues, making it difficult to determine whether PSNU contributes to or results from these problems (Moretta et al., 2022). Additionally, the use of self-reports introduces potential biases, such as social desirability, which may affect the accuracy of the data. Future studies could benefit from integrating observational methods or assessments completed by clinicians to provide a more objective evaluation.
Regarding the questionnaires, SN research has mainly used DSM-based scales like BSMAS and SMD-Scale, applying substance use disorder criteria. However, to our knowledge no studies have classified user groups using ICD-11 criteria (e.g., ACSID-11; Müller et al., 2022). Expanding these results with different classification frameworks is essential.
The sample, primarily composed of psychology students, with a majority of women, may limit the generalizability of the findings. A larger and more diverse sample could allow for a more accurate exploration of alternative latent class models, such as a four-class model (Brailovskaia et al., 2021; Cui et al., 2023).
The present findings highlight the heterogeneity of SN users, with over half of participants classified as “functional”. This subgroup’s adaptive online habits indicate that future research should not only address problematic or at risk usage but also investigate the positive processes underlying the positive impact of SN. Specifically, it would be valuable to integrate validated measures as Digital Flourishing Scale (Janicke-Bowles et al., 2023), characterized by positive perceptions, experiences, and behaviours in online contexts, into studies of SN use. Building on the current latent class framework, future research might compare digital flourishing scores across the three user profiles to explore whether functional users exhibit different digital experiences than at risk or problematic users. Longitudinal or experience-sampling approaches could further clarify the mechanisms by which individuals develop (or transition between) functional and problematic usage styles.
Conclusions
Our study provides relevant information about the characteristics of different groups of SN users. Integrating these findings within theoretical frameworks such as the I-PACE model, which describes pathways from adaptive to maladaptive SN use, can be useful for the early detection of inappropriate online behaviours that may lead to PSNU, as well as for identifying users who have already developed it. Thus, by analysing SN user profiles, it can be concluded that age, emotional intelligence (protective factor) and impulsivity (risk factor) are two variables that differentiate functional users from those entering a risk process, so it will be important to focus on these variables if the goal is early prevention. On the other hand, empathy (protective factor) and aggression (risk factor) are variables that differentiate users at risk from problematic users, so it will be more relevant to focus on them in case of users who are already showing criteria of problematic use but who could not yet be categorised as PSNU.
Conflict of Interest
The authors have no conflicts of interest to declare.
Use of AI Services
The authors declare they have used AI services, specifically ChatGPT 4o, for grammar correction and minor style refinements. They carefully reviewed all suggestions from these services to ensure the original meaning and factual accuracy were preserved.
Acknowledgement
AZA and VCF are supported by the FPU grants FPU22/01588 and FPU21/00527, respectively, funded by the Ministry of Science, Innovation and Universities, Spain. LSP is supported by a predoctoral grant from the “Atracció de Talent” program at the University of Valencia (UV-INV-PREDOC21-1906808).
Data Availability Statement
The datasets presented in this study can be found in online repositories. The names of the repository/repositories and accession number(s) can be found below: https://osf.io/d6tsr.
Appendices
Appendix A
Figure A1. Fit Indices Values for Latent Class Models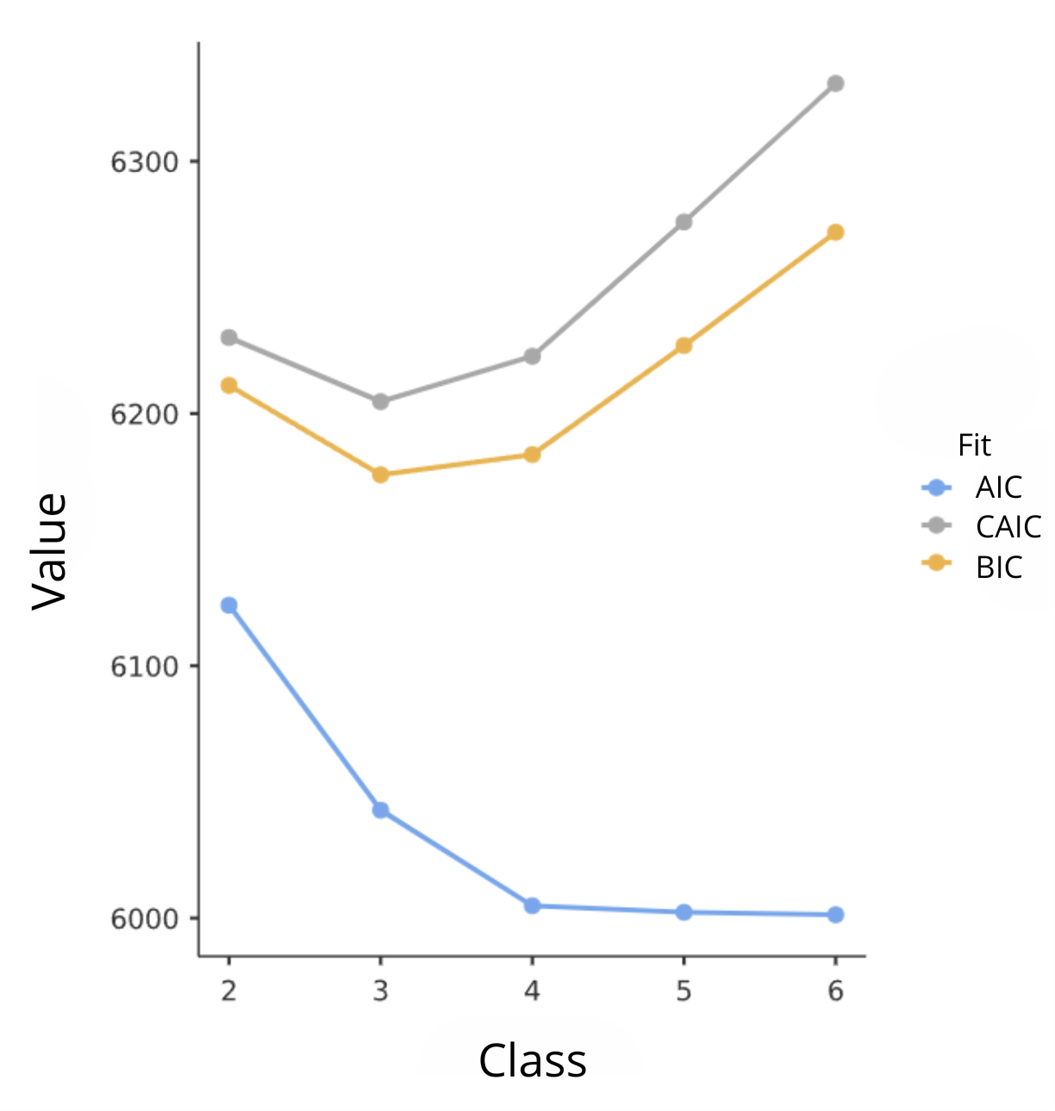
Note. AIC = Akaike Information Criterion; CAIC = Consistent AIC; BIC = Bayesian Information Criterion.
Appendix B
Table B1. Probability of Scoring Positively on Each of the Items.
|
Item |
Latent classes |
|
||
|
1 |
2 |
3 |
χ² |
|
|
During the past year... |
|
|
|
|
|
Have you regularly felt like you couldn't think about anything else other than the moment when you could use social media again? (SMD1) |
.048 |
.343 |
.521 |
<.001 |
|
Have you regularly felt dissatisfied because you wanted to spend more time using social media? (SMD2) |
.017 |
.288 |
.297 |
<.001 |
|
Have you often felt bad when you couldn't use social media? (SMD3) |
.035 |
.350 |
.391 |
<.001 |
|
Have you tried to spend less time using social media but failed? (SMD4) |
.448 |
.737 |
.840 |
<.001 |
|
Have you frequently used social media to escape from negative feelings? (SMD5) |
.530 |
.910 |
.928 |
<.001 |
|
Have you regularly had arguments with others because of your use of social media? (SMD6) |
.082 |
.107 |
1.000 |
<.001 |
|
Have you regularly lied to your parents or friends about the time you spend using social media? (SMD7) |
.029 |
.161 |
.566 |
<.001 |
|
Have you regularly neglected other activities (hobbies, sports) because you wanted to use social media? (SMD8) |
.193 |
.494 |
.621 |
<.001 |
|
Have you had serious conflicts with your parents, siblings, or partner because of your use of social media? (SMD9) |
.031 |
.026 |
.719 |
<.001 |
|
Note. The table shows the probability of scoring 1 (Yes) on each criterion for each latent class. The significance of the χ² statistic is shown in the last column. Latent Class 1 = Functional users; Latent Class 2 = Risky users; Latent Class 3 = Problematic Users. |
||||
Table B1 presents the conditional probabilities of each latent class to respond positively to each of the scale criteria. Specifically, items 6 (Have you regularly had arguments with others because of your use of social media?), 7 (Have you regularly lied to your parents or friends about the time you spend using social media?), and 9 (Have you had serious conflicts with your parents, siblings, or partner because of your use of social media?) stand out due to the varying probabilities observed in each of the latent classes, making them good indicators to characterize the severity of latent class 3. Also notable are items 4 (Have you tried to spend less time using social media, but failed?), 5 (Have you often used social media to escape negative feelings?), and 8 (Have you regularly neglected other activities (hobbies, sports) because you wanted to use social media?), due to the moderate probability of affirmative responses from class 2, representing non-problematic or functional users, compared to latent class 1. Additionally, item 2 (Have you often felt dissatisfied because you wanted to spend more time using social networks?) was the least probable for all three latent classes, with a maximum probability of .297. Similarly, item 3 (Have you often felt bad when you couldn't use social media?) obtained a maximum probability of .391, being the second least probable item to receive a positive response.

This work is licensed under a Creative Commons Attribution-ShareAlike 4.0 International License.
Copyright © 2025 Alfredo Zarco-Alpuente, Víctor Ciudad-Fernández, Marta Carrique-Martínez , Lucas Serrano-Pastor, Elisabeth Malonda-Vidal, Anna Llorca-Mestre , Rafael García-Ros, Paula Samper-García