
The development and validation of the extended active-passive social media use scale
Vol.19,No.3(2025)

Mixed findings regarding the relationship between social media (SM) use and mental health have left the research field at somewhat of a crossroads, with one significant requirement being a comprehensive tool to measure SM use. In an effort to advance relevant research, this study extends the common ‘active-passive model’ of SM use to develop and validate a comprehensive scale. This scale will measure complex SM behaviors, focusing on subtypes of active and passive use. A 29-item Extended Active-Passive Use Scale (E-APUS) developed for adolescents and young adults was validated using a total sample of individuals (N = 4,372) from four independent Chinese samples. An exploratory factor analysis with N1 = 305 and a confirmatory factor analysis with N2 = 289 revealed six dimensions characterizing engagement on SM. These dimensions include targeted-warm use, non-targeted-warm use, cold use, browsing high self-relevance success stories, browsing low self-relevance success stories, and browsing failure stories. The study confirmed measurement invariance (N3 = 3,524) across genders and educational stage groups (i.e., adolescents vs. young adults) through (multi-group) confirmatory factor analyses. Convergent validity of the E-APUS scale was established with active-passive SM use measures, and criterion validity was supported using indicators of subjective well-being. However, discriminant validity was comparatively lower for personality factors. The E-APUS scale exhibited good internal consistency and high test-retest reliability (N4 = 254) over a 2-week period. Summarily, the E-APUS emerges as an effective, valid, and reliable tool for measuring SM use.
extended active-passive model; social media; instrument development; adolescent development; online behavior; mental health
Xiang Niu
Center for Mental Health Education, School of Psychology, Southwest University, Chongqing, China
Xiang Niu is a doctoral student in the Faculty of Psychology, Southwest University, China. Her research interests include social media use effects, well-being and individual’s mental health.
Philippe Verduyn
Faculty of Psychology and Neuroscience, Maastricht University, Maastricht, Netherlands
Philippe Verduyn is a professor at the Faculty of Psychology and Neuroscience, Maastricht University. His research focuses on the effects of social media, smartphone usage, and human-computer interaction.
James Gaskin
Department of Information System, Brigham Young University, Provo, Utah, USA
James Gaskin is an Associate Professor in the Department of Information System, Brigham Young University, Utah, USA. His research interests include human computer interaction, (particularly augmented reality and wearables), and human robot interaction.
Sebastian Scherr
Center for Interdisciplinary Health Research, Department of Media, Knowledge, and Communication, University of Augsburg, Augsburg, Germany
Sebastian Scherr is a professor at the Center for Interdisciplinary Health Research and the Department of Media, Knowledge, and Communication at the University of Augsburg, Germany. His research interests focus on health communication, political communication, and suicide prevention.
Dean McDonnell
Department of Humanities, South East Technological University, Carlow, Ireland
Dean McDonnell is a lecturer at South East Technological University in Carlow, Ireland. His research interests include pedagogy, teaching and learning, as well as online psychology and behavior.
Jin-Liang Wang
Center for Mental Health Education, School of Psychology, Southwest University, Chongqing, China
Jin-Liang Wang is a professor in the Faculty of Psychology, Southwest University, China. His research investigates About Authors the antecedents of online communication and its influence on users’ social and psychological development.
Appel, H., Gerlach, A. L., & Crusius, J. (2016). The interplay between Facebook use, social comparison, envy, and depression. Current Opinion in Psychology, 9, 44–49. https://doi.org/10.1016/j.copsyc.2015.10.006
Appel, M., Marker, C., & Gnambs, T. (2020). Are social media ruining our lives? A review of meta-analytic evidence. Review of General Psychology, 24(1), 60–74. https://doi.org/10.1177/1089268019880891
Banjanin, N., Banjanin, N., Dimitrijevic, I., & Pantic, I. (2015). Relationship between internet use and depression: Focus on physiological mood oscillations, social networking and online addictive behavior. Computers in Human Behavior, 43, 308–312. https://doi.org/10.1016/j.chb.2014.11.013
Batson, C. D., Duncan, B. D., Ackerman, P., Buckley, T., & Birch, K. (1981). Is empathic emotion a source of altruistic motivation? Journal of Personality and Social Psychology, 40(2), 290–302. https://doi.org/10.1037/0022-3514.40.2.290
Bélanger, J. J., Lafreniere, M. A. K., Vallerand, R. J., & Kruglanski, A. W. (2013). Driven by fear: The effect of success and failure information on passionate individuals’ performance. Journal of Personality and Social Psychology, 104(1), 180–195. https://doi.org/10.1037/a0029585
Beyens, I., Pouwels, J. L., van Driel, I. I., Keijsers, L., & Valkenburg, P. M. (2021). Social media use and adolescents’ well-being: Developing a typology of person-specific effect patterns. Communication Research, 51(6), 691–716. https://doi.org/10.1177/00936502211038196
Brown, A., Barker, E. D., & Rahman, Q. (2022). Development and psychometric validation of the Sexual Fantasies and Behaviors Inventory. Psychological Assessment, 34(3), 217–232. https://doi.org/10.1037/pas0001082
Burke, M., Marlow, C., & Lento, T. (2010). Social network activity and social well-being. In Proceedings of the SIGCHI Conference on Human Factors in Computing Systems (pp. 1909–1912). ACM. https://doi.org/10.1145/1753326.1753613
Carstensen, L. L., Isaacowitz, D. M., & Charles, S. T. (1999). Taking time seriously: A theory of socioemotional selectivity. American Psychologist, 54(3), 165–181. https://doi.org/10.1037/0003-066X.54.3.165
Chen, F. F. (2007). Sensitivity of goodness of fit indexes to lack of measurement invariance. Structural Equation Modeling, 14(3), 464–504. https://doi.org/10.1080/10705510701301834
Chen, W., Fan, C. Y., Liu, Q. X., Zhou, Z. K., & Xie, X. C. (2016). Passive social network site use and subjective well-being: A moderated mediation model. Computers in Human Behavior, 64, 507–514. https://doi.org/10.1016/j.chb.2016.04.038
Chen, X, Y., Chen, Y, W., & Zhang, Y, T. (2021). 主动性社交网站使用对生命意义感的影响:有调节的中介模型 [The associations of active use of social network site with meaning in life: A moderated mediating model]. Chinese Journal of Clinical Psychology, 29(2), 236–241. https://doi.org/10.16128/j.cnki.1005-3611.2021.02.004
Cheng, C., Wang, H. Y., Sigerson, L., & Chau, C. L. (2019). Do the socially rich get richer? A nuanced perspective on social network site use and online social capital accrual. Psychological Bulletin, 145(7), 734–764. https://doi.org/10.1037/bul0000198
Cheung, G. W., & Rensvold, R. B. (2002). Evaluating goodness-of-fit indexes for testing measurement invariance. Structural Equation Modeling, 9(2), 233–255. https://doi.org/10.1207/S15328007SEM0902_5
Cosme, D., Scholz, C., Chan, H.-Y., Doré, B. P., Pandey, P., Carreras-Tartak, J., Cooper, N., Paul, A., Burns, S. M., & Falk, E. B. (2023). Message self and social relevance increases intentions to share content: Correlational and causal evidence from six studies. Journal of Experimental Psychology: General, 152(1), 253–267. https://doi.org/10.1037/xge0001270
de Vries, D. A., Möller, A. M., Wieringa, M. S., Eigenraam, A. W., & Hamelink, K. (2018). Social comparison as the thief of joy: Emotional consequences of viewing strangers’ Instagram posts. Media Psychology, 21(2), 222–245. https://doi.org/10.1080/15213269.2016.1267647
Diener, E. D., Emmons, R. A., Larsen, R. J., & Griffin, S. (1985). The satisfaction with life scale. Journal of Personality Assessment, 49(1), 71–75. https://doi.org/10.1207/s15327752jpa4901_13
Digital. (2023). Global overview report. https://datareportal.com/reports/digital-2023-global-overview-report
Ellison, N. B., Steinfield, C., & Lampe, C. (2007). The benefits of Facebook “friends:” Social capital and college students’ use of online social network sites. Journal of computer‐mediated communication, 12(4), 1143–1168. https://doi.org/10.1111/j.1083-6101.2007.00367.x
Festinger, L. (1954). A theory of social comparison processes. Human Relations, 7(2), 117–140. https://doi.org/10.1177/001872675400700202
Frison, E., & Eggermont, S. (2016). Exploring the relationships between different types of Facebook use, perceived online social support, and adolescents’ depressed mood. Social Science Computer Review, 34(2), 153–171. https://doi.org/10.1177/0894439314567449
Gerson, J., Plagnol, A. C., & Corr, P. J. (2017). Passive and Active Facebook Use Measure (PAUM): Validation and relationship to the reinforcement sensitivity theory. Personality and Individual Differences, 117, 81–90. https://doi.org/10.1016/j.paid.2017.05.034
Godard, R., & Holtzman, S. (2024). Are active and passive social media use related to mental health, wellbeing, and social support outcomes? A meta-analysis of 141 studies. Journal of Computer-Mediated Communication, 29(1), Article zmad055. https://doi.org/10.1093/jcmc/zmad055
Godfrey, K. J., Foulkes, L., McMorris, C., Harris, A. D., & Bray, S. (2023). Development and validation of the Social Reward Questionnaire-Early Childhood. Psychological Assessment, 35(3), 229–241. https://doi.org/10.1037/pas0001196
Gold, A. H., Malhotra, A., & Segars, A. H. (2001). Knowledge management: An organizational capabilities perspective. Journal of Management Information Systems, 18(1), 185–214. https://doi.org/10.1080/07421222.2001.11045669
Gouldner, A. W. (1960). The norm of reciprocity: A preliminary statement. American Sociological Review, 25(2), 161–178. https://doi.org/10.2307/2092623
Hair, J. F., Jr., Black, W., Babin, B., & Anderson, R. (2010). Multivariate data analysis: A global perspective. Pearson Education.
Hair, J. F., Jr., Hult, G. T. M., Ringle, C. M., Sarstedt, M., Danks, N. P., & Ray, S. (2021). Partial least squares structural equation modeling (PLS-SEM) using R: A workbook. Springer Nature. https://doi.org/10.1007/978-3-030-80519-7
Hancock, J. T., Gee, K., Ciaccio, K., & Lin, J. M. H. (2008). I’m sad you’re sad: Emotional contagion in computer-mediated communication. In Proceedings of the 2008 ACM Conference on Computer Supported Cooperative Work (pp. 295–298). ACM. https://doi.org/10.1145/1460563.1460611
Hanna, E., Ward, L. M., Seabrook, R. C., Jerald, M., Reed, L., Giaccardi, S., & Lippman, J. R. (2017). Contributions of social comparison and self-objectification in mediating associations between Facebook use and emergent adults’ psychological well-being. Cyberpsychology, Behavior, and Social Networking, 20(3), 172–179. https://doi.org/10.1089/cyber.2016.0247
Hatfield, E., Cacioppo, J. T., & Rapson, R. L. (1993). Emotional contagion. Current Directions in Psychological Science, 2, 96–99. https://doi.org/10.1111/1467-8721.ep10770953
He, M., Zhang, X. Y., Li, L. Y., & Yang, L. Z. (2023). 3~6岁幼儿羞耻发展教师评定量表的编制 [The development of teacher rating scale for shame development in 3–6 years old children]. Psychological and Behavioral Research. 21(2), 231–237. https://doi.org/10.12139/j.1672-0628.2023.02.012
Heine, S. J., Kitayama, S., Lehman, D. R., Takata, T., Ide, E., Leung, C., & Matsumoto, H. (2001). Divergent consequences of success and failure in Japan and North America: An investigation of self-improving motivations and malleable selves. Journal of Personality and Social Psychology, 81(4), 599–615. https://doi.org/10.1037/0022-3514.81.4.599
Henseler, J., Ringle, C. M., & Sarstedt, M. (2015). A new criterion for assessing discriminant validity in variance-based structural equation modeling. Journal of the Academy of Marketing Science, 43, 115–135. https://doi.org/10.1007/s11747-014-0403-8
Hofstede, G. (2001). Culture’s consequences: Comparing values, behaviors, institutions, and organizations across nations (2nd ed.). Sage Publications.
Hu, L., & Bentler, P. M. (1999). Cutoff criteria for fit indexes in covariance structure analysis: Conventional criteria versus new alternatives. Structural Equation Modeling, 6(1), 1–55. https://doi.org/10.1080/10705519909540118
Huang, C. (2017). Time spent on social network sites and psychological well-being: A meta-analysis. Cyberpsychology, Behavior, and Social Networking, 20(6), 346–354. https://doi.org/10.1089/cyber.2016.0758
Kaiser, H. F., & Rice, J. (1974). Little Jiffy, Mark IV. Educational and Psychological Measurement, 34(1), 111–117. https://doi.org/10.1177/001316447403400115
Kaplan, A. M., & Haenlein, M. (2010). Users of the world, unite! The challenges and opportunities of social media. Business Horizons, 53(1), 59–68. https://doi.org/10.1016/j.bushor.2009.09.003
Karsay, K., Matthes, J., Schmuck, D., & Ecklebe, S. (2023). Messaging, posting, and browsing: A mobile experience sampling study investigating youth’s social media use, affective well-being, and loneliness. Social Science Computer Review, 41(4), 1493–1513. https://doi.org/10.1177/08944393211058308
Keltner, D., & Haidt, J. (1999). Social functions of emotions at four levels of analysis. Cognition & Emotion, 13(5), 505–521. https://doi.org/10.1080/026999399379168
Kietzmann, J. H., Hermkens, K., McCarthy, I. P., & Silvestre, B. S. (2011). Social media? Get serious! Understanding the functional building blocks of social media. Business Horizons, 54(3), 241–251. https://doi.org/10.1016/j.bushor.2011.01.005
Kim, Y., Hsu, S. H., & de Zúñiga, H. G. (2013). Influence of social media use on discussion network heterogeneity and civic engagement: The moderating role of personality traits. Journal of Communication, 63(3), 498–516. https://doi.org/10.1111/jcom.12034
Kline, P. (1993). The handbook of psychological testing. Routledge.
Kline, R. B. (2015). Principles and practice of structural equation modeling (3rd ed.). Guildford Press.
Krasnova, H., Wenninger, H., Widjaja, T., & Buxmann, P. (2013). Envy on Facebook: A hidden threat to users’ life satisfaction? In 11th International conference on Wirtschaftsinformatik (pp. 1–16). https://aisel.aisnet.org/wi2013/92
Krause, H. V., große Deters, F., Baumann, A., & Krasnova, H. (2023). Active social media use and its impact on well-being—An experimental study on the effects of posting pictures on Instagram. Journal of Computer-Mediated Communication, 28(1), Article zmac037. https://doi.org/10.1093/jcmc/zmac037
Kross, E., Verduyn, P., Demiralp, E., Park, J., Lee, D. S., Lin, N., Shablack, H., Jonides, J., & Ybarra, O. (2013). Facebook use predicts declines in subjective well-Being in young adults. PLoS ONE, 8(8), Article e69841. https://doi.org/10.1371/journal.pone.0069841
Kross, E., Verduyn, P., Sheppes, G., Costello, C. K., Jonides, J., & Ybarra, O. (2021). Social media and well-being: Pitfalls, progress, and next steps. Trends in Cognitive Sciences, 25(1), 55–66. https://doi.org/10.1016/j.tics.2020.10.005
Lin, R., & Utz, S. (2015). The emotional responses of browsing Facebook: Happiness, envy, and the role of tie strength. Computers in Human Behavior, 52, 29–38. https://doi.org/10.1016/j.chb.2015.04.064
Liu, Y., Sang, B., Zhu, Z, M., Zhang, S, H., & Pan, T, T. (2018). 中学生学业情绪调节问卷的编制 [Development of the academic emotion regulation questionnaire for middle school students]. Chinese Journal of Clinical Psychology, 26(1), 1–5+29. https://doi.org/10.16128/j.cnki.1005-3611.2018.01.001
Liu, Q, Q., Zhang, C, Y., Sun, X, J., Niu, G, F., & Zhou, Z, K. (2017). 被动性社交网站使用与主观幸福感的关系:中介效应分析 [Passive use of social network site and subjective well-being: Mediating effect analysis]. Psychological Science, 40(3), 678–684. https://jps.ecnu.edu.cn/CN/Y2017/V40/I3/678
Markus, H. (1977). Self-schemata and processing information about the self. Journal of Personality and Social Psychology, 35(2), 63–78. https://doi.org/10.1037/0022-3514.35.2.63
Meier, A., Gilbert, A., Börner, S., & Possler, D. (2020). Instagram inspiration: How upward comparison on social network sites can contribute to well-being. Journal of Communication, 70(5), 721–743. https://doi.org/10.1093/joc/jqaa025
Meier, A., & Krause, H. V. (2022). Does passive social media use harm well-being? An adversarial review. Journal of Media Psychology: Theories, Methods, and Applications. 35(3), 169–180. https://doi.org/10.1027/1864-1105/a000358
Meier, A., & Reinecke, L. (2021). Computer-mediated communication, social media, and mental health: A conceptual and empirical meta-review. Communication Research, 48(8), 1182–1209. https://doi.org/10.1177/0093650220958224
Midgley, C., Thai, S., Lockwood, P., Kovacheff, C., & Page-Gould, E. (2021). When every day is a high school reunion: Social media comparisons and self-esteem. Journal of Personality and Social Psychology, 121(2), 285–307. https://doi.org/10.1037/pspi0000336
Niu, X., Gou, L. X., Han, Y., Zhou, X., & Wang, J. L. (2024). Self-concept clarity and envy as mediators between upward social comparison on social networking sites and subjective well-being. British Journal of Developmental Psychology. Advance online publication. https://doi.org/10.1111/bjdp.12538
Orosz, G., Tóth-Király, I., & Bőthe, B. (2016). Four facets of Facebook intensity—The development of the Multidimensional Facebook Intensity Scale. Personality and Individual Differences, 100, 95–104. https://doi.org/10.1016/j.paid.2015.11.038
Ozimek, P., & Bierhoff, H. W. (2016). Facebook use depending on age: The influence of social comparisons. Computers in Human Behavior, 61, 271–279. https://doi.org/10.1016/j.chb.2016.03.034
Ozimek, P., Brailovskaia, J., & Bierhoff, H. W. (2023). Active and passive behavior in social media: Validating the Social Media Activity Questionnaire (SMAQ). Telematics and Informatics Reports, 10, Article 100048. https://doi.org/10.1016/j.teler.2023.100048
Pallant, J., & Manual, S. S. (2001). A step by step guide to data analysis using SPSS for Windows (versions 10–11). Open University Press.
Paulus, F. M., Müller-Pinzler, L., Stolz, D. S., Mayer, A. V., Rademacher, L., & Krach, S. (2018). Laugh or cringe? Common and distinct processes of reward-based schadenfreude and empathy-based fremdscham. Neuropsychologia, 116, 52–60. https://doi.org/10.1016/j.neuropsychologia.2017.05.030
Peter, J., Valkenburg, P. M., & Schouten, A. P. (2005). Developing a model of adolescent friendship formation on the internet. CyberPsychology & Behavior, 8(5), 423–430. https://doi.org/10.1089/cpb.2005.8.423
Pouwels, J. L., Valkenburg, P. M., Beyens, I., van Driel, I. I., & Keijsers, L. (2021). Social media use and friendship closeness in adolescents’ daily lives: An experience sampling study. Developmental Psychology, 57(2), 309–323. https://doi.org/10.1037/dev0001148
Roccas, S., Sagiv, L., Schwartz, S. H., & Knafo, A. (2002). The big five personality factors and personal values. Personality and Social Psychology Bulletin, 28(6), 789–801. https://doi.org/10.1177/0146167202289008
Saiphoo, A. N., Halevi, L. D., & Vahedi, Z. (2020). Social networking site use and self-esteem: A meta-analytic review. Personality and Individual Differences, 153, Article 109639. https://doi.org/10.1016/j.paid.2019.109639
Satici, S. A., Gocet Tekin, E., Deniz, M. E., & Satici, B. (2023). Doomscrolling scale: Its association with personality traits, psychological distress, social media use, and wellbeing. Applied Research in Quality of Life, 18(2), 833–847. https://doi.org/10.1007/s11482-022-10110-7
Seidman, G. (2013). Self-presentation and belonging on Facebook: How personality influences social media use and motivations. Personality and Individual Differences, 54(3), 402–407. https://doi.org/10.1016/j.paid.2012.10.009
Steinsbekk, S., Nesi, J., & Wichstrøm, L. (2023). Social media behaviors and symptoms of anxiety and depression. A four-wave cohort study from age 10–16 years. Computers in Human Behavior, 147, Article 107859. https://doi.org/10.1016/j.chb.2023.107859
Tandoc Jr, E. C., Ferrucci, P., & Duffy, M. (2015). Facebook use, envy, and depression among college students: Is Facebooking depressing? Computers in Human Behavior, 43, 139–146. https://doi.org/10.1016/j.chb.2014.10.053
Tesser, A. (1988). Toward a self-evaluation maintenance model of social behavior. In L. Berkowitz (Ed.), Advances in experimental social psychology (Vol. 21, pp. 181–227). Academic Press. https://doi.org/10.1016/S0065-2601(08)60227-0
Thorisdottir, I. E., Sigurvinsdottir, R., Asgeirsdottir, B. B., Allegrante, J. P., & Sigfusdottir, I. D. (2019). Active and passive social media use and symptoms of anxiety and depressed mood among Icelandic adolescents. Cyberpsychology, Behavior, and Social Networking, 22(8), 535–542. https://doi.org/10.1089/cyber.2019.0079
Timmerman, M. E., & Lorenzo-Seva, U. (2011). Dimensionality assessment of ordered polytomous items with parallel analysis. Psychological Methods, 16(2), 209–220. https://doi.org/10.1037/a0023353
Trifiro, B. M., & Gerson, J. (2019). Social media usage patterns: Research note regarding the lack of universal validated measures for active and passive use. Social Media + Society, 5(2), Article 2056305119848743. https://doi.org/10.1177/2056305119848743
Tuck, A. B., & Thompson, R. J. (2024). The social media use scale: Development and validation. Assessment, 31(3), 617–636. https://doi.org/10.1177/10731911231173080
Valkenburg, P. M., Beyens, I., Pouwels, J. L., van Driel, I. I., & Keijsers, L. (2022). Social media browsing and adolescent well-being: Challenging the “passive social media use hypothesis”. Journal of Computer-Mediated Communication, 27(1), Article zmab015. https://doi.org/10.1093/jcmc/zmab015
Valkenburg, P. M., Peter, J., & Schouten, A. P. (2006). Friend networking sites and their relationship to adolescents’ well-being and social self-esteem. CyberPsychology & Behavior, 9(5), 584–590. https://doi.org/10.1089/cpb.2006.9.584
Valkenburg, P. M., van Driel, I. I., & Beyens, I. (2022). The associations of active and passive social media use with well-being: A critical scoping review. New Media & Society, 24(2), 530–549. https://doi.org/10.1177/14614448211065425
Vahedi, Z., & Zannella, L. (2021). The association between self-reported depressive symptoms and the use of social networking sites (SNS): A meta-analysis. Current Psychology, 40(5), 2174-2189. https://doi.org/10.1007/s12144-019-0150-6
Verduyn, P., Gugushvili, N., & Kross, E. (2022). Do social networking sites influence well-being? The extended active-passive model. Current Directions in Psychological Science, 31(1), 62–68. https://doi.org/10.1177/09637214211053637
Verduyn, P., Gugushvili, N., Massar, K., Täht, K., & Kross, E. (2020). Social comparison on social networking sites. Current Opinion in Psychology, 36, 32–37. https://doi.org/10.1016/j.copsyc.2020.04.002
Verduyn, P., Lee, D. S., Park, J., Shablack, H., Orvell, A., Bayer, J., Ybarra, O., Jonides, J., & Kross, E. (2015). Passive Facebook usage undermines affective well-being: Experimental and longitudinal evidence. Journal of Experimental Psychology: General, 144(2), 480–488. https://doi.org/10.1037/xge0000057
Verduyn, P., Ybarra, O., Résibois, M., Jonides, J., & Kross, E. (2017). Do social network sites enhance or undermine subjective well-being? A critical review. Social Issues and Policy Review, 11(1), 274–302. https://doi.org/10.1111/sipr.12033
Vishkin, A., Kitayama, S., Berg, M. K., Diener, E., Gross-Manos, D., Ben-Arieh, A., & Tamir, M. (2023). Adherence to emotion norms is greater in individualist cultures than in collectivist cultures. Journal of Personality and Social Psychology, 124(6), 1256–1276. https://doi.org/10.1037/pspi0000409
Wang, J. L., Gaskin, J., Rost, D. H., & Gentile, D. A. (2018). The reciprocal relationship between passive social networking site (SNS) usage and users’ subjective well-being. Social Science Computer Review, 36(5), 511–522. https://doi.org/10.1177/0894439317721981
Watson, D., Clark, L. A., & Tellegen, A. (1988). Development and validation of brief measures of positive and negative affect: The PANAS scales. Journal of Personality and Social Psychology, 54(6), 1063–1070. https://doi.org/10.1037/0022-3514.54.6.1063
Wenninger, H., Krasnova, H., & Buxmann, P. (2019). Understanding the role of social networking sites in the subjective well-being of users: a diary study. European Journal of Information Systems, 28(2), 126–148. https://doi.org/10.1080/0960085X.2018.1496883
Wiggins, J. S. (1991). Agency and communion as conceptual coordinates for the understanding and measurement of interpersonal behavior. In W. M. Grove & D. Cicchetti (Eds.), Thinking clearly about psychology: Essays in honor of Paul E. Meehl, Vol. 1. Matters of public interest; Vol. 2. Personality and psychopathology (pp. 89–113). University of Minnesota Press.
Williams, D. (2006). On and off the’ net: Scales for social capital in an online era. Journal of Computer-Mediated Communication, 11(2), 593–628. https://doi.org/10.1111/j.1083-6101.2006.00029.x
Wills, T. A. (1981). Downward comparison principles in social psychology. Psychological Bulletin, 90(2), 245–271. https://doi.org/10.1037/0033-2909.90.2.245
Wu, M. (2010). Practical statistics analysis and application of questionnaires: SPSS operation and application. Chongqing University Press.
Yan, J., Wu. L., Sun, M., Cui, J., & Liang, Q. (2016). 社交网站使用对抑郁的影响:线上社会资本的中介作用 [The effect of social network sites use on adolescent depression: The mediating role of online social capital]. Chinese Journal of Clinical Psychology, 24(2), 317–320. https://doi.org/10.16128/j.cnki.1005-3611.2016.02.030
Yan, H., Zhang, R., Oniffrey, T. M., Chen, G., Wang, Y., Wu, Y., Zhang, X., Wang, Q., Ma, L., Li, R., & Moore, J. B. (2017). Associations among screen time and unhealthy behaviors, academic performance, and well-being in Chinese adolescents. International Journal of Environmental Research and Public Health, 14(6), Article 596. https://doi.org/10.3390/ijerph14060596
Yin, X. Q., de Vries, D. A., Gentile, D. A., & Wang, J.-L. (2019). Cultural background and measurement of usage moderate the association between social networking sites (SNSs) usage and mental health: A meta-analysis. Social Science Computer Review, 37(5), 631–648. https://doi.org/10.1177/0894439318784908
Zhang, M., & Cross, S. E. (2011). Emotions in memories of success and failure: A cultural perspective. Emotion, 11(4), 866–880. https://doi.org/10.1037/a0024025
Zhang, X., Wang, M.-C., He, L., Jie, L., & Deng, J. (2019). The development and psychometric evaluation of the Chinese Big Five Personality Inventory-15. PLoS One, 14(8), Article e0221621. https://doi.org/10.1371/journal.pone.0221621
Zhang, Y., & Liu, H. (2021). 大、中学生社交网站使用强度、自尊和抑郁的关系:好友数量的中介作用和性别的调节作用[Relations of use intensity, self-esteem and depression of the social website of college students and middle school students: The meditation function of the number of friends and the moderating function of genders]. China Journal of Health Psychology, 29(9). https://doi.org/10.13342/j.cnki.cjhp.2021.09.024
Authors’ Contribution
Xiang Niu: conceptualization, methodology, investigation, formal analysis, data curation, visualization, writing—original draft, and writing—review & editing. Philippe Verduyn: conceptualization, methodology, investigation, formal analysis, data curation, validation, and writing—review & editing. James Gaskin: conceptualization, methodology, and writing—review & editing. Sebastian Scherr: conceptualization, methodology, and writing—review & editing. Dean McDonnell: methodology and writing—review & editing. Jin-Liang Wang: conceptualization, writing—review & editing, investigation, and supervision.
Editorial Record
First submission received:
August 10, 2024
Revision received:
April 6, 2025
Accepted for publication:
June 3, 2025
Editor in charge:
Lenka Dedkova
Introduction
In 2023, there were 4.76 billion social media users around the world, equating to just under 60 percent of the total global population. Additionally, social media now accounts for its greatest-ever share of total time spent online, with almost 4 in every 10 minutes devoted to online interaction being attributable to social media activities (Digital, 2023). Since the introduction of “traditional” television (i.e., broadcast and cable TV channels), very few technologies have had such a profound impact on how people allocate their time and engage in social interactions. Therefore, the psychological implications triggered by the widespread popularity of social media (SM) has become a focal point for many researchers (M. Appel et al., 2020). However, a major challenge in this field is the lack of a universal and effective measurement to assess SM usage. Therefore, the present study explicitly defines the broad scope of SM as digital platforms that enable users to create, share, and engage with content while interacting with others (Kaplan & Haenlein, 2010). This broad definition encompasses different types of digital platforms: (1) text-based social networking platforms, such as Twitter, Weibo, and QQ Zone; (2) image-centric platforms, including Instagram and Xiaohongshu1; (3) video-sharing platforms, such as YouTube, TikTok, Douyin, and Kuaishou2; (4) instant messaging services with social features, such as WeChat and WhatsApp; and (5) comprehensive social networking platforms that integrate text, images, and videos, such as Facebook and WeChat. Although SM platforms have diverse functionalities, they share some common core features, such as social interaction, information acquisition, and content creation and sharing. In this study, we develop a scale that can capture these general patterns of SM use. Given the rapid development of SM, a universal measurement standard can ensure that our findings remain applicable across different platforms and contexts (Trifiro & Gerson, 2019). This approach is consistent with previous research, which focuses on examining underlying behavioral tendencies on SM rather than platform-specific usage (e.g., Tuck & Thompson, 2024).
Overview of Social Media Use Measurement
Based on relevant research findings, the measurement of SM usage can be categorized into general measurement (e.g., total time spent on SM) and measurement of broad usage types (i.e., active-passive usage) More specifically, general measurement typically relies on assessing indicators such as time spent, frequency, and intensity of using SM, without differentiating specific behaviors exhibited by individuals on these platforms. For example, in Valkenburg et al. (2006), participants were surveyed regarding the daily time they spent on platforms such as Facebook or the frequency of SM usage on an average day. In contrast, the Facebook Intensity Scale, developed by Ellison et al. (2007), has been used extensively to assess the level of engagement with social networking site activities, frequency of interaction, emotional attachment to the platform, and the extent to which Facebook is integrated into daily life. However, there is still a lack of studies examining the convergent and discriminant validity of this scale.
Regarding the measurement of broad usage types, the active-passive distinction is particularly popular. Most research derives relevant items based on the concepts of active and passive use. Active use usually refers to the act of engaging in activities that involve direct communication with others, such as sending messages or sharing updates, either one-on-one or with a larger audience. Passive use refers to the act of observing or consuming information without actively engaging in direct communication, such as browsing news or viewing posts (Krause et al., 2023; Verduyn et al., 2017). A recent review article summarized the operationalization and outcome types related to active-passive usage and found that 90% of the studies used unique operational definitions (Valkenburg, van Driel et al., 2022), indicating a lack of consistency in the measurement tools used for assessing active-passive usage. Additionally, rigorous tests of reliability and validity are yet to be completed for the majority of these scales, with some exceptions observed in the Passive and Active Facebook Use Measure (PAUM; Gerson et al., 2017) and the Social Media Activity Questionnaire (SMAQ; Ozimek et al., 2023), both of which are based on the framework of active-passive usage.
However, PAUM is limited to Facebook as a specific platform, and its generalizability remains to be examined. Regarding SMAQ, though it is not restricted to a single platform, it fails to differentiate the specific passive usage behaviors, which may lead to mixed psychological effects. To overcome the issues aforementioned, recent research has integrated SM use frequency with the active-passive model framework to develop a four-factor Social Media Use Scale (SMUS; Tuck & Thompson, 2024). Though SMUS contributes to the development of a general SM use scale that is not dependent on a specific platform, it still has certain limitations. For example, the four-factor scale developed in this study fails to take into account the private communication function of direct messaging, which represents a core respect of SM use (Kietzmann et al., 2011). Direct messaging not only facilitates direct communication and emotional connection between users but also significantly impacts their social experience and psychological well-being (Karsay et al., 2023). According to the latest data, 51.5% of young people aged 16 to 24 reported that their primary reason for using SM is to stay connected with friends and family (Statistic, 2024). This indicates that direct messaging plays an irreplaceable role in young people’s SM use and is a key component in understanding SM behaviors and their psychological impacts. The main existing SM activity scales are summarized in Table 1.
Table 1. Overview of Main Existing Social Media Activity Scales.
|
Measure |
Source |
Platform |
Dimensions (items) |
Strengths |
Weaknesses |
|
Facebook Intensity Scale |
Ellison et al., 2007 |
FB |
Single dimension (7) |
Item conciseness |
Single platform, overlooking different aspects of usage intensity |
|
Multidimensional Facebook Intensity Scale |
Orosz et al., 2016 |
FB |
Persistence (4), boredom (3), overuse (3), self-expression (3) |
Consider various aspects of usage intensity |
Single platform |
|
Facebook Activity Scale |
Ozimek & Bierhoff, 2016 |
FB |
Watching (11), Acting (13), Impressing (6) |
Consider a broader range of usage behaviors beyond just intensity |
Single platform |
|
Passive and Active Facebook Use Measure (PAUM) |
Gerson et al., 2017 |
FB |
Active non-social (4), active social (5), passive (4) |
Differentiate active use |
Single platform |
|
Social Media Activity Questionnaire (SMAQ) |
Ozimek et al., 2023 |
SM |
Active use (7), passive use (10) |
Not limited to a single platform (e.g., Facebook) |
Has not carefully distinguished the different aspects of active and passive use |
|
Social Media Use Scale |
Tuck & Thompson, 2024 |
SM |
Image-Based (5), Comparison-Based (3), Belief-Based (4), Consumption-Based (5) |
Not limited to a single platform and slightly surpasses the active-passive framework |
Does not consider one-on-one direct interaction, nor the emotional and content attributes of browsing |
|
Note. FB = Facebook; SM = Social media; This overview does not address SM use motivations. For more information on the scales, please refer to Ozimek et al. (2023). |
|||||
Similar to the studies by Ozimek et al. (2023) and Tuck and Thompson (2024), our goal is to develop a universal SM use scale that is not restricted to any specific platform, and the proposal of this scale development is based on the following considerations. First, SM user behaviors are diverse and complex, with many users frequently switching between multiple platforms (Pouwels et al., 2021). For example, a student might interact with friends on WeChat, browse entertainment content on TikTok, and acquire knowledge on Xiaohongshu. Second, while different SM platforms vary in functions and user behaviors, they share certain core features, such as social interaction, information acquisition, and content creation and sharing. Finally, the functionalities and user behaviors associated with specific SM platforms may change over time (Trifiro & Gerson, 2019). A general SM use scale can more flexibly adapt to these dynamic shifts while maintaining research consistency and comparability. In contrast, platform-specific scales may limit our ability to comprehensively assess common user behavior patterns across different platforms and struggle to keep pace with platform evolution. More importantly, this study addresses some of the limitations of the research by Ozimek et al. (2023) and Tuck and Thompson (2024). Our scale not only further refines active and passive SM use but also incorporates direct messaging, the emotional attributes of interactions, and the emotional characteristics of browsed content. This allows for a more comprehensive representation of different dimensions of SM use.
Mixed Findings Drive Scale Development
The findings from comprehensive empirical studies and meta-analyses have yielded mixed conclusions regarding the associations between the measurement of both general and active-passive SM usage on individual outcomes such as psychological well-being, life satisfaction, anxiety, and depression (Vahedi & Zannella, 2021; Yin et al., 2019; Yoon et al., 2019). For the association between general usage of SM and mental health outcomes, some researchers found positive correlations (e.g., H. Yan et al., 2017), some reported negative correlations (e.g., J. Yan et al., 2016), while other researchers have found no relationship (e.g., Banjanin et al., 2015; Y. Zhang & Liu, 2021). Some meta-analyses found mixed evidence, slightly leaning in a negative direction (Huang, 2017; Saiphoo et al., 2020). Recently, a meta-analysis including 141 studies on the relationship between active and passive use and mental health found that the assumption of the active-passive model may not hold (Godard & Holtzman, 2024). Analogously, the results regarding the relationship between active-passive SM usage and mental health outcomes have been inconsistent. Several studies have supported the assumptions proposed by the original active-passive model (W. Chen et al., 2016; X. Y. Chen et al., 2021; Verduyn et al., 2015; Wang et al., 2018), suggesting that active use leads to positive effects, while passive use results in adverse outcomes (Verduyn et al., 2017). However, other studies have found the opposite (Frison & Eggermont, 2016; Thorisdottir et al., 2019) or null effects (Hanna et al., 2017). For example, Thorisdottir et al. (2019) found that active use was positively correlated with depressed mood and anxiety. Furthermore, some recent studies have identified person-specific effects, revealing that the consequences of active and passive SM usage might depend on the person under consideration (Beyens et al., 2021; Steinsbekk et al., 2023; Valkenburg, Beyens et al., 2022).
Recently, several reviews have criticized and debated the research findings regarding the relationship between active and passive usage of SM and subjective well-being (Meier & Krause, 2022; Valkenburg, van Driel et al., 2022). For example, some researchers have argued that the active-passive model does not consider the specific content people see on SM and that, depending on this content, the consequences of passive usage might be different (Valkenburg, Beyens, et al., 2022; Verduyn et al., 2022). Other studies have suggested that there is a lack of effective measurement tools for assessing active and passive use (Trifiro & Gerson, 2019). Some researchers have even proposed that the active-passive distinction is too coarse and subtypes of active and passive SM usage should be examined (Kross et al., 2021; Verduyn et al., 2022). It is evident that this research field urgently needs a more refined SM use scale based on the active-passive framework.
Theoretical Framework
The inconsistent findings and debates mentioned above have brought research in this field to a critical juncture. Building on these critiques, Verduyn and colleagues (2022) have recently proposed the extended active-passive model. According to this model, active usage does not always confer benefits, while passive usage does not necessarily lead to adverse outcomes. To further unpack the complexities of these dynamics, it is essential to delve into the specific characteristics that underlie active and passive use.
In terms of active use, we focus on two core characteristics: reciprocity and communion. Reciprocity reflects the direct or indirect rewards individuals receive from social interactions and can be categorized into targeted and non-targeted forms (Gouldner, 1960; Verduyn et al., 2022). Specifically, direct interactions, such as liking someone’s post or replying to messages, are more likely to generate immediate social rewards, thereby contributing to the accumulation of social capital and the maintenance of long-term social relationships (Wenninger et al., 2019). In contrast, non-targeted interactions, such as sharing others’ content or participating in group discussions, may not elicit direct responses but can still enhance an individual’s social recognition and sense of identity (Gouldner, 1960). Communion refers to the emotional connection and relationship-oriented behaviors in interpersonal interactions, reflecting the emotional quality and nature of interactions (Verduyn et al., 2022; Wiggins, 1991). It exists on a continuum from warm interactions, which are agreeable and supportive, to cold interactions, which are quarrelsome and distant. Based on the interpersonal circumplex model and the socioemotional selectivity theory (Carstensen et al., 1999; Wiggins, 1991), we argue that warm interactions (e.g., supportive comments, encouraging private messages) can strengthen social cohesion and interpersonal connections, ultimately enhancing individual well-being. Conversely, cold or negative interactions (e.g., being ignored, perfunctory replies, or even malicious comments) may reduce social satisfaction and even trigger negative emotions.
In summary, active use is not only related to the form of interaction but also to the quality of the interaction. Therefore, we propose that the combination of reciprocity and communion can further divide the active SM use into four refined types: targeted-warm use, non-targeted-warm use, targeted-cold use, and non-targeted-cold use. Furthermore, these four types of active use may be associated with different emotional experiences. Specifically, we hypothesize that warm interactions are linked to higher positive emotions, higher life satisfaction, and greater well-being, whereas cold interactions may be associated with more negative emotions, lower life satisfaction, and reduced well-being.
Regarding passive use, this study emphasizes two key dimensions: self-relevance and achievement characteristics. Self-relevance determines the extent to which individuals emotionally resonate with the content they consume and directly influences the direction and intensity of social comparison. According to the self-evaluation maintenance model and social comparison theory (Festinger, 1954; Tesser, 1988), individuals are more likely to have emotional reactions to content that is highly relevant to themselves, which may trigger upward or downward comparisons, leading to feelings of anxiety, inferiority, satisfaction, or compassion. Specifically, highly self-relevant content, such as peers’ academic or career progress and friends’ life updates, is more likely to induce social comparison. In contrast, low self-relevance content, such as posts from strangers or entertainment news, generally has a weaker psychological impact (H. Appel et al., 2016).
However, achievement-related displays on SM often have a significant social impact but may also trigger social comparisons. For instance, consuming success-related content (e.g., promotions, awards, fitness achievements) may stimulate individuals’ motivation for personal growth (de Vries et al., 2018). However, prolonged exposure to such content may result in upward social comparison, leading to stress and anxiety (Kross et al., 2013). Conversely, consuming failure-related content (e.g., stories of setbacks or challenges) may alleviate social pressure and evoke empathy (Hancock et al., 2008). Although consuming failure-related content may bring immediate happiness through downward social comparison (Midgley et al., 2021), individuals are generally more likely to experience empathy when confronted with others’ failures. According to the social functional theory of emotion and the empathy-altruism hypothesis, this empathy fosters compassion and potential altruistic behaviors, such as offering support and comfort (Batson et al., 1981; Keltner & Haidt, 1999).
Conversely, the emotional contagion theory (Hatfield et al., 1993) explains the phenomenon of emotional transmission in passive use, wherein individuals may unconsciously be influenced by the emotions conveyed in the content they consume. For example, frequent exposure to positive content may enhance well-being, whereas excessive exposure to negative content may increase anxiety (Wang et al., 2018). Thus, the combination of self-relevance and achievement characteristics can further distinguish four types of passive use: browsing high self-relevance success stories, browsing low self-relevance success stories, browsing high self-relevance failure stories, and browsing low self-relevance failure stories. Given that SM content often exhibits a positive bias (i.e., users tend to share more positive events), individuals are more likely to engage in upward social comparisons and be influenced by impression management during browsing (Niu et al., 2024; Tuck & Thompson, 2024). Therefore, we hypothesize that browsing high self-relevance success stories is more likely to induce negative affect. Additionally, browsing low self-relevance success stories may lead to more positive affect, higher life satisfaction, and greater well-being, whereas browsing failure stories, regardless of relevance, is likely to be associated with more negative affect.
In this study, the criterion validity of the E-APUS scale is assessed using subjective well-being in line with previous research on the relationship between active and passive use and subjective well-being (Beyens et al., 2021; Q. Q. Liu et al., 2017; Wang et al., 2018). We used the Chinese version of the Tandoc et al. (2015) Social Media Surveillance Use Scale to test the convergent validity of the E-APUS scale. This scale has been validated in China with good reliability and validity (Q. Q. Liu et al., 2017). Since targeted-warm use, non-targeted-warm use, targeted-cold use, and non-targeted-cold use all fall under the category of active use, we expect that these four dimensions will be positively correlated with active use. Similarly, browsing high self-relevance success stories, browsing low self-relevance success stories, browsing high self-relevance failure stories, and browsing low self-relevance failure stories belong to the category of passive use, so we expect that these four dimensions will be positively correlated with passive use. Furthermore, given that previous studies have consistently found a positive correlation between active and passive use (e.g., Ozimek et al., 2023; Thorisdottir et al., 2019), we expect that these eight dimensions also exhibit positive correlations with each other.
Finally, a short version of the Chinese Big Five Personality Inventory (CBF-PI-15; X. Zhang et al., 2019) was utilized as a benchmark for discriminant validity, as the Big Five is widely recognized and well-established with strong theoretical foundation and empirical support (Roccas et al., 2002). In addition, the previous articles on passive and active use measures also used personality scales as their discriminant validity indicators (Gerson et al., 2017). Extraverts tend to engage more in social interactions, such as liking posts, commenting, and private messaging on SM, to maintain social relationships and enhance social capital (Cheng et al., 2019). Additionally, they are more likely to stay updated on social dynamics and seek out others’ success stories for inspiration or as conversation topics (Cheng et al., 2019). Individuals with high openness typically possess strong curiosity, creativity, and a desire for new experiences. They may be more willing to engage in deep discussions, express their unique perspectives, and interpret social media content from diverse viewpoints (Kim et al., 2013). Highly agreeable individuals are more friendly, helpful, and empathetic, with a tendency to maintain positive interpersonal relationships (Seidman, 2013). Conscientious individuals, characterized by strong self-discipline and goal orientation, are inclined to use their time efficiently and avoid wasting it on low-value SM activities (e.g., group discussions, random sharing, or browsing irrelevant information; Seidman, 2013). In contrast, individuals with high neuroticism are more prone to experiencing anxiety, depression, and stress, making them more sensitive to negative information on SM (Seidman, 2013). Therefore, we expect that the two warmth-related dimensions are positively associated with extraversion, openness, agreeableness, and conscientiousness. The two indifference-related dimensions are either unrelated or negatively associated with extraversion, agreeableness, and conscientiousness but positively associated with neuroticism and openness. Browsing high self-relevance success stories is expected to be positively associated with extraversion, conscientiousness, openness, agreeableness, and neuroticism, while browsing low self-relevance success stories is likely to be positively associated with extraversion and openness. The two failure-related dimensions are expected to be positively associated with agreeableness, neuroticism, and openness, while they are either negatively associated with or unrelated to extraversion.
In sum, the extended active-passive model (Verduyn et al., 2022) requires a set of measures to test or validate its dimensions or nomological relevance. However, such a comprehensive measurement tool is currently lacking. Therefore, the main goal of this study is to develop a comprehensive measurement tool, as described above, with eight dimensions, based on the recommendations provided by Trifiro and Gerson (2019) and Verduyn et al. (2022), namely the Extended Active-Passive Use Scale (E-APUS). This enhanced instrument will not only facilitate a clearer understanding of complex social network behavior but also contribute to further enriching empirical research in related fields.
The Present Study
This study aims to develop a psychometric scale based on an extended active-passive model to measure SM usage. Initially, qualitative feedback was gathered for item generation through interviews with college students (N = 36) who regularly use SM. Then Study 1 evaluated item difficulty and identified an initial set of items through item analysis and exploratory factor analysis using an independent sample (EFA, N1 = 305). Then Study 2 confirmed the latent structure of the E-APUS in an independent sample through confirmatory factor analysis (CFA, N2= 289). Additionally, we examined measurements of invariance in gender and educational stages of each group3 (i.e., adolescents vs. young adults) using a larger independent sample (N3 = 3,524). The internal consistency coefficients, convergent validity, and criterion validity were tested using the same, larger sample. Moreover, we evaluated discriminant validity and test-retest reliability of the scale with an additional independent sample (N4 = 254) at
2-week intervals. Since this scale development is exploratory, we propose the following three research questions:
RQ1: How many factors comprise E-APUS?
RQ2: Do the correlations between the E-APUS and the previously mentioned relevant scales align with theoretical expectations, thereby supporting criterion validity, convergent validity, and discriminant validity?
RQ3: Do the dimensions of the E-APUS demonstrate high internal consistency and test-retest reliability?
Study 1
Item Development and Exploratory Factor Analysis
The aim of Study 1 was to determine potential items corresponding to each factor of the E-APUS. Specifically, we incorporated the content obtained from qualitative interviews (guided by Verduyn et al., 2022) into an initial item pool, followed by conducting EFA to determine items for the final version and ascertain the number of factors.
Methods
Preliminary Item Pool
Based on the theoretical framework of the extended active-passive model (Verduyn et al., 2022), we expected to develop an eight-dimensional measurement scale. The hypothesized dimensions were as follows: (1) targeted-warm use, (2) non-targeted-warm use, (3) targeted-cold use, (4) non-targeted-cold use, (5) browsing high self-relevance success stories, (6) browsing low self-relevance success stories, (7) browsing high self-relevance failure stories, and (8) browsing low self-relevance failure stories. We conducted interviews with 36 university students (until we reached content saturation), yielding a total of 42 items.
Participants and Procedure
The interview sample and Sample 1 were collected in October and December 2022, respectively. The participants for the interview were aged between 17 and 23 (Mage = 19.78, SD = 1.51, N = 36, 52.8% female) and answered open-ended questions regarding their SM usage. The specific questions regarding the interview can be found in the Supplementary Material.
Sample 1. The data of these participants were used for item analysis and EFA, with an age range of 17 to 30 (Mage = 20.9, SD = 2.38, N1 = 3054, 79.3% female). The study employed convenience sampling to collect representative samples, with enrolment carried out through online referrals and posters. The survey was conducted through a web-based platform (https://www.wjx.cn/). We assured participants that the collected data would be treated with confidentiality. Ethical approval was granted by the first author’s University Ethics Committee. The approval number is H23224.
Measures
The initial version of the E-APUS contained 42 items. The scale utilized a 5-point scoring system ranging from 1 (never) to 5 (always).
Data Analysis
Sample 1 was first analyzed using discriminant analysis and homogeneity test to examine the discriminative power of each item and the homogeneity of the items within the entire scale. Then, an EFA aimed to identify the expected factors of the E-APUS. The Kaiser-Meyer-Olkin (KMO) statistic evaluates if the factor analysis adequately explains the shared variance between items. The canonical statistic cutoffs were used for interpretation (i.e., KMO ≥ .9, marvelous, KMO ≥ .8, meritorious, KMO ≥ .7. middling, KMO < .5, unacceptable; Kaiser & Rice, 1974). The Bartlett’s sphericity test was used to determine the presence of correlation among items (p < .05, indicating a significant correlation). Item analysis and EFA analyses were performed using SPSS 25.0.
Results
Item Analysis
The results of the preliminary discriminant analysis and the homogeneity test are presented in Table 2, with total scores on the scale arranged in ascending order. Subsequently, the participants were divided into a lower-score and a higher-score group. Group cutoffs were determined by selecting the top and bottom 27% of the distribution, as is customary in typical research practices (Y. Liu et al., 2018; Wu, 2010). Independent samples t-test for each item aimed to assess differences between the two groups, resulting in significant differences in all 42 items (t = –5.59 to –17.92, p < .001), which suggests the good discriminative power of the items. Pearson correlations were calculated between each item and the total E-APUS score to test the homogeneity of the item pool. The results indicated that the range of correlation coefficients was from r = .17 to .78. Given the low (r < .30; He et al., 2023; P. Kline, 1993) correlation coefficients of TC1 (r = .18) and TC5 (r = .17), both items were excluded from the subsequent EFA.
Table 2. Discriminant Analysis and Homogeneity Test Results (N1 = 305).
|
Item |
t |
r |
Item |
t |
r |
Item |
t |
r |
Item |
t |
r |
|
TW1 |
–9.46*** |
.75*** |
NW6 |
–17.92*** |
.45*** |
HS1 |
–11.66*** |
.38*** |
HF1 |
–9.82*** |
.50*** |
|
TW2 |
–8.38*** |
.39*** |
TC1 |
–5.59*** |
.18a |
HS2 |
–14.28*** |
.42*** |
HF2 |
–10.18*** |
.51*** |
|
TW3 |
–12.14*** |
.44*** |
TC2 |
–12.60*** |
.40*** |
HS3 |
–16.67*** |
.41*** |
HF3 |
–12.28*** |
.53*** |
|
TW4 |
–10.53*** |
.43*** |
TC3 |
–7.67*** |
.34*** |
HS4 |
–13.88*** |
.49*** |
HF4 |
–10.16*** |
.51*** |
|
TW5 |
–6.07*** |
.24*** |
TC4 |
–8.72*** |
.25*** |
HS5 |
–13.00*** |
.46*** |
HF5 |
–10.92*** |
.46*** |
|
TW6 |
–11.22*** |
.38*** |
TC5 |
–6.54*** |
.17b |
HS6 |
–14.42*** |
.45*** |
LF1 |
–7.88*** |
.44*** |
|
NW1 |
–8.53*** |
.33*** |
NC1 |
–8.41*** |
.34*** |
LS1 |
–10.41*** |
.36*** |
LF2 |
–9.25*** |
.44*** |
|
NW2 |
–13.15*** |
.38*** |
NC2 |
–7.75*** |
.26*** |
LS2 |
–8.90*** |
.34*** |
LF3 |
–8.15*** |
.60*** |
|
NW3 |
–11.99*** |
.39*** |
NC3 |
–8.97*** |
.28*** |
LS3 |
–6.61*** |
.41*** |
LF4 |
–9.88*** |
.48*** |
|
NW4 |
–10.58*** |
.41*** |
NC4 |
–8.39*** |
.31*** |
LS4 |
–9.05*** |
.48*** |
LF5 |
–8.14*** |
.78*** |
|
NW5 |
–14.96*** |
.41*** |
|
|
|
LS5 |
–12.10*** |
.51*** |
|
|
|
|
Note. TW = targeted-warm use; NW = non-targeted-warm use; TC = targeted-cold use; NC = non-targeted-cold use; HS = browsing high self-relevance success stories; LS = browsing low self-relevance success stories; HF = browsing high self-relevance failure stories; LF = browsing low self-relevance failure stories. a p = .001. b p = .002. ***p < .001. |
|||||||||||
Exploratory Factor Analysis
An EFA was conducted on the remaining 40 items. We first determined the Kaiser-Meyer-Olkin (KMO) coefficient and ran Bartlett’s test of sphericity to determine the suitability of the E-APUS for EFA. The results indicated that the EFA could be conducted (KMO = .936, χ2 = 8004.21, p < .001; Pallant & Manual, 2001). Therefore, principal axis factoring with oblique (promax) rotation was conducted to assess any correlations among core factors. In addition to a visual inspection of the scree plot, we used a Monte Carlo simulation to perform a parallel analysis of the items that offer additional evidence in support of the optimal factor solution (Timmerman & Lorenzo-Seva, 2011); both (visual inspection and parallel analysis) suggested a 5 to 6-factor solution (see Fig. 1). The EFA yielded six factors with eigenvalues greater than 1, with the initial factor explaining 35.07% of the variance and the cumulative variance of six factors explaining 64.16%. The refining of the factor analysis involved the stepwise exclusion of items with loadings below .4, cases of higher cross- or multiple loadings, and items with inconsistent dimensionality that cannot be adequately explained (Godfrey et al., 2023). Consequently, seven items (TW3, LS4, NW1, NW5, C5, F6, F7) were removed during the EFA stage. After excluding these uninformative items, the final item pool was determined according to their factor loadings and consistency with the underlying theory. The factor loadings of the scale ranged from .436 to .911 (see Table 3). The specific definition of six dimensions are shown in the Supplementary Material.
Table 3. Factor Loadings for Items of the Final E-APUS in the EFA (N1 = 305).
|
Item |
Loading |
Item |
Loading |
|
Targeted-warm Active Use |
|
Browsing High self-relevance Success Stories |
|
|
TW1: When others are facing difficulties, I reach out to them through text, voice, or video to support and comfort them |
.456 |
HS1: I browse SM about others’ success in improving their appearance (e.g., weight loss or body shape). |
.581 |
|
TW2: When someone posts about their success, I congratulate them via private chat, like, or comment. |
.436 |
HS2: I browse others’ academic or work achievements on SM. |
.911 |
|
TW4: I support and care about others by text, voice, or video. |
.728 |
HS3: I browse on SM for beautiful photos of other people’s adventures or travels. |
.883 |
|
TW5: I chat with others using a mix of emojis and text. |
.813 |
HS4: I browse other people’s posts and happy daily lives with their partners on SM. |
.726 |
|
TW6: I share meaningful or enjoyable content directly with others. |
.529 |
HS5: I browse on SM for others’ vibrant campus life or comfortable work situations. |
.751 |
|
Non-targeted-warm Active Use |
|
HS6: I browse posts of others tracking their learning or workouts on SM. |
.745 |
|
NW2: I share content or links that I find interesting and enjoyable in group chats. |
.527 |
Browsing Low self-relevance Success Stories |
|
|
NW3: I share articles or links that are helpful to my studies, life, and work to SM. |
.911 |
LS1: I browse on SM for news on breakthrough technology advancements. |
.642 |
|
NW4: I forward others’ requests for help or important updates to group chats. |
.684 |
LS2: I browse SM for positive news on political or economic developments in other countries. |
.762 |
|
NW6: I share content or links that I find interesting and enjoyable on SM. |
.485 |
LS3: I browse SM for the latest cultural and archeological excavations. |
.694 |
|
Cold Active Use |
|
LS5: I browse SM for updates on others’ outstanding performances in major competitions. |
.504 |
|
C2: I express my dislike of others through text, voice, or video. |
.570 |
Browsing Failure Stories |
|
|
C3: I get into disputes or conflicts with others via text, voice, or video. |
.725 |
F1: I browse posts on SM where others fail to improve their personal appearance. |
.590 |
|
C4: I criticize or negate posts that I don’t approve of or dislike. |
.802 |
F2: I browse on SM for content on others’ academic or occupational struggles. |
.879 |
|
C6: I post unconfirmed social events, gossip, or opinions. |
.716 |
F3: I browse posts on SM about other people’s setbacks in romantic relationships. |
.845 |
|
C7: I gossip or complain about others in the group, even if they’re not there. |
.754 |
F4: I browse the daily lives of others expressing depression and bad feelings on SM. |
.910 |
|
C8: I create and share some whining or sarcastic posts. |
.699 |
F5: I browse posts on SM where other people are struggling with interpersonal relationships. |
.728 |
|
|
|
F8: I browse posts about others’ investment losses, startup failures, or business bankruptcies on SM. |
.768 |
|
|
|
F9: I browse on SM for negative news about a certain celebrity. |
.527 |
|
|
|
F10: I browse SM for content that others have been eliminated in big competitions. |
.728 |
|
Note. E-APUS = Extended Active-Passive Use Scale; EFA = exploratory factor analysis; C = cold use; F = browsing failure stories. |
|||
Figure 1. The Results of Sample Eigenvalues and Parallel Analysis Eigenvalues.
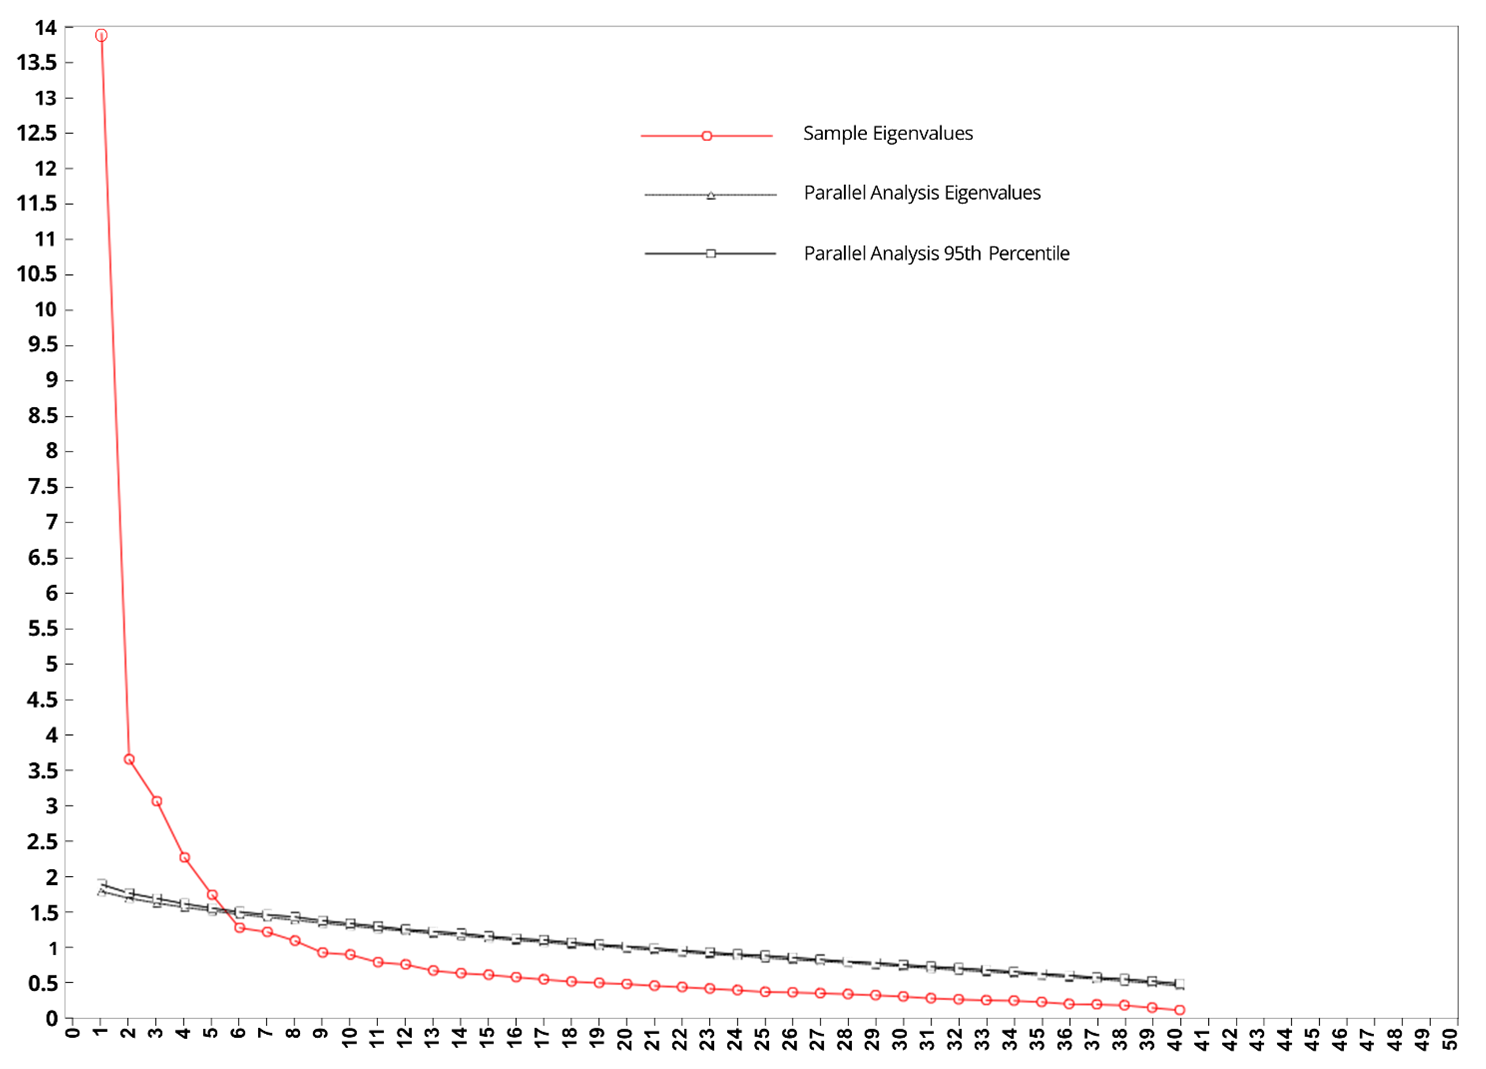
Note. Parallel analysis is a statistical technique used to determine the number of factors or components that should be retained in a factor analysis. Factors with eigenvalues that exceed the corresponding eigenvalues from the random data are considered to be meaningful and retained in the analysis.
Discussion
The lack of comprehensive validated measures for active and passive use has become an urgent problem (Meier & Krause, 2022; Trifiro & Gerson, 2019). Study 1 was conducted based on the extended active-passive model to develop a comprehensive item pool that focuses on both content and interaction types during SM usage. Specifically, the item analysis examined the appropriateness and reliability of each item, and an EFA extracted factors along with their factor loadings. Results showed that the high and low groups in our Extended Active-Passive Use Scale (E-APUS) showed significant differences in the scores of other related items, indicating the appropriateness and reliability of our items. Based on an EFA, the final E-APUS consisted of 33 items that loaded onto six factors: targeted-warm use, non-targeted-warm use, cold use, browsing high self-relevance success stories, browsing low self-relevance success stories, and browsing failure stories.
Contrary to the theoretical expectation of eight factors, our data revealed six (addressing RQ1). Specifically, ‘targeted-cold use’ and ‘non-targeted-cold use’ loaded onto a shared factor, which we referred to as ‘cold use’. Similarly, ‘browsing high self-relevance failure stories’ and ‘browsing low self-relevance failure stories’ loaded onto a common factor labeled ‘browsing failure stories’. This indicates that the significance of making fine-grained distinctions between cold use behavior and browsing failure stories behavior is negligible when individuals engage in SM activities. For cold use, this may be because reciprocity is weakened in “cold” contexts. The core of reciprocity lies in whether an interaction yields direct or indirect social rewards (Gouldner, 1960). However, in “cold” interactions, due to the lack of emotional warmth, users may pay less attention to the targeted nature of the interaction (i.e., “targeted” or “non-targeted”) and focus more on the act itself. For example, users might engage in perfunctory replies out of habit or social obligation (“targeted-cold”) or in casual content sharing (“non-targeted-cold”), but neither behavior provides significant social rewards or emotional satisfaction. Moreover, communion (emotional quality) is a core dimension that distinguishes the nature of interactions (Carstensen et al., 1999; Wiggins, 1991). Whether “targeted” or “non-targeted,” the defining characteristic of these interactions is the lack of emotional warmth or support (i.e., “cold”). This similarity in emotional quality may lead users to exhibit highly consistent behaviors. In other words, the low emotional investment in these interactions may result in psychological and behavioral convergence between the two dimensions, ultimately leading to their integration into a single factor.
For browsing failure stories, the consolidation may be because the core appeal of failure stories lies in the failure itself, rather than the individual’s relevance. Generally, the extent to which people process information depends on its relevance to the self (Cosme et al., 2023; Markus, 1977). Highly self-relevant information tends to elicit stronger emotional reactions, whereas low self-relevant information is often processed from a more objective or observer-like perspective (Cosme et al., 2023; Markus, 1977). However, in the context of failure stories, regardless of their level of self-relevance, users’ attention is often focused on the failure itself rather than its direct connection to themselves. This is primarily because failure stories serve functions related to social comparison and emotional regulation. First, from the perspective of social comparison theory (Festinger, 1954), failure stories on SM—whether highly self-relevant or not—can trigger downward social comparison processes. Users may gain a sense of relative superiority by observing others’ failures, thereby enhancing their self-esteem, or they may use others’ failure experiences as a means of self-comfort and emotional regulation (Midgley et al., 2021; Wills, 1981). Second, research has shown that failure-related content may evoke complex emotional experiences, such as empathy, schadenfreude, anxiety, or self-reflection (Paulus et al., 2018).
These emotional responses are not entirely dependent on the relevance of the failure story to the individual but are more closely related to the failure situation itself (Bélanger et al., 2013). For example, users may feel empathy for failure stories that are unrelated to themselves, or take schadenfreude in the failure of competitors. The universality of these emotional reactions further diminishes the dominant role of self-relevance in information processing. Finally, in the fragmented information environment of SM, users typically do not deeply process the specific content of failure stories but instead focus more on the overall context of the failure. This shallow processing model leads users to concentrate on the emotional arousal and social informational value brought by the failure, rather than its direct relevance to themselves. This phenomenon is similar to the “doomscrolling” behavior on SM, where users unconsciously continue to browse negative content while ignoring its relevance to themselves (Satici et al., 2023). As a result, in factor analysis, these two types of failure stories are likely to exhibit a high degree of covariance, ultimately merging into a single factor.
However, the observed factor convergence may be influenced by cultural differences, as our sample was collected in China, a collectivist society that prioritizes group harmony and relational concerns over individual autonomy (Hofstede, 2001; Vishkin et al., 2023). Compared to users in individualistic cultures, Chinese users may engage less in cold SM behaviors, as collectivist norms emphasize emotionally supportive interactions rather than impersonal exchanges (M. Zhang & Cross, 2011). Similarly, failure stories on SM may be processed differently in different cultures; in collectivist cultures, failure is seen as a socially significant event rather than an opportunity for detached downward comparison (Heine et al., 2001; M. Zhang & Cross, 2011). These cultural tendencies may shape how individuals interpret and engage with SM content, contributing to variations in factor structures within our questionnaire. The observed factor convergence may reflect deeper cultural tendencies in SM use rather than mere measurement issues. Cross-cultural research is needed to explore whether similar factor merging patterns occur across different populations. Considering the limitations of a small sample size in Study 1, we will address this limitation with Study 2, in which we used an independent sample to conduct a CFA and assessed the measurement invariance and reliability of the E-APUS.
Study 2
Measurement Invariance, Validity and Reliability of the E-APUS
Study 2 sought to provide empirical support for the reliability and validity of the E-APUS. We began by confirming the six-factor structure of the E-APUS through CFA. After ensuring the necessary statistical criteria were met, we conducted multi-group CFAs to evaluate measurement invariance across genders and educational stages using the final pool of items. Following this, we examined validity by assessing correlations between the E-APUS and other study variables. Finally, we evaluated the internal consistency of the final version.
Methods
Participants and Procedure
Sample 2. Data from a sample of N = 2895 university students (Mage = 20.49, SD = 1.85, 66.4% female) were recruited. This sample was used to perform a CFA.
Sample 3. A total of N = 3,524 participants (58.0% female) with an average age of 15.11 years (SD = 3.59,
range = 11–35 years) were recruited from multiple provinces in China. Among the participants, there were n = 1,724 (48.9%) middle school students, n = 914 (25.9%) high school students, and n = 886 (25.1%) college students. This sample was used to examine the measurement invariance of gender and educational stage, assess reliability, criterion-related validity, convergent validity, and discriminant validity (Fornell-Larcker criterion and heterotrait-monotrait (HTMT) ratio).
Sample 4. There were N = 254 participants with a mean age of 18.29 years (SD = 2.18). The sample was used for test-retest reliability after a two-week interval and discriminant validity test. Samples 2 and 4 were collected using convenience sampling to obtain representative samples. In sample 3, the group of high school students was recruited from a public high school, while the remaining sample of college students was recruited through SM posters. All of the above samples excluded invalid responses that answered too quickly and were wrong in polygraph questions (e.g., if the participant answers incorrectly to the question: What is the date today?, their data may be deleted.). The data for Samples 2 to 4 were collected between March and October 2023.
Measures
The tools included the newly assembled E-APUS, consisting of 33 items. The scale utilizes a 5-point Likert scoring system ranging from 1 (never) to 5 (always).
Criterion Validity Indicators. To assess the affective component of well-being, we utilized a 20-item measure of the Chinese version of the Positive and Negative Affect Schedule (PANAS, Watson et al., 1988). The measure consists of two 10-item scales, one for positive affect and one for negative affect. It uses a 5-point Likert scale ranging from 1 (very slightly or not at all) to 5 (extremely). In this study, the Cronbach’s α coefficients for positive affect and negative affect were .899 and .896, respectively. The cognitive aspect of well-being among the participants was evaluated using the Chinese version of the Satisfaction with Life Scale (SWLS, Diener et al., 1985), which consists of 5 items. It uses a 7-point Likert scale, ranging from 1 (strongly disagree) to 7 (strongly agree). In this study, the Cronbach’s α coefficient was .804.
Convergent Validity. The scale developed by Tandoc et al. (2015) was used to measure the levels of active and passive usage of SM by individuals. The scale has demonstrated good reliability and validity in the Chinese version (Q. Q. Liu et al., 2017). Participants rated their frequency of engaging in the behaviors described in the 8 items pertaining to SM usage: 4 items each for active and passive usage behavior. The scale uses a 5-point Likert scale, from 1 (never) to 5 (always). In this study, the Cronbach’s α coefficients of these two subscales were .838 and .946, respectively.
Discriminant Validity. The Chinese Big Five Personality Inventory-15 (CBF-PI-15; X. Zhang et al., 2019) is a concise questionnaire designed to measure personality traits among Chinese individuals. The scale has a total of 15 items and encompasses five dimensions, including neuroticism, conscientiousness, agreeableness, openness, and extraversion. Consistent with prior literature, we used a 6-point Likert scale, ranging from 1 (disagree strongly) to 6 (agree strongly). It has been confirmed to have good factor structure, reliability and validity, and measurement invariance (X. Zhang et al., 2019). In this study, the Cronbach’s α coefficients of these five dimensions were .792, .620, .756, .772, and .647, respectively.
Data Analysis Procedure
Normality. We first conducted normality tests on each item of the E-APUS. Specifically, absolute skewness or kurtosis values greater than 1 would be indicative of non-normality of the data (R. B. Kline, 2015). For CFA and measurement invariance, we employed the Satorra-Bentler scaled chi-square statistic to better approximate the chi-square under non-normality.
Goodness of Fit. We then used Sample 2 for a CFA to validate the factor structure. The CFA model fit was evaluated using the χ2/df statistic, the comparative fit index (CFI), the Tuker-Lewis index (TLI), the root mean square error of approximation (RMSEA), and the standardized root mean square residual (SRMR). Specifically, if χ2/df ≤ 5, CFI > .90, TLI > .90, RMSEA < .08, and SRMR < .08, the model was acceptable (Hair et al., 2010; Hu & Bentler, 1999).
Invariance. Sample 3 was then used to test measurement invariance, with the main goal of ensuring consistent interpretation of the questionnaire across different groups or populations. Specifically, we employed multi-group CFAs to examine the measurement invariance of E-APUS across genders and educational stages. Measurement invariance was examined at three levels, including configural invariance, metric (or weak) invariance, and scalar (or strong) invariance (Brown et al., 2022). The models at each level of invariance were compared with the previous model. Among all the metrics, ΔCFI, which assessed changes in the fit index CFI, was considered the most robust indicator for capturing model differences due to the sample size sensitivity of χ2 (F. F. Chen, 2007; Cheung & Rensvold, 2002). In addition, ΔRMSEA and ΔSRMR were computed to evaluate a level of measurement. The recommended critical values for each change measure were as follows: ΔCFI less than .01 indicated insufficient evidence to reject the null hypothesis, suggesting good fit of the nested model; ΔCFI ranging from .01 to .02 suggested moderate worsening in model fit, without indicating significant differences; ΔCFI greater than .02 indicated the presence of substantial differences. ΔRMSEA should be less than .015 in tests of configural, metric, and scalar invariance. ΔSRMR should be less than .03 in tests of configural and metric invariance, and less than .01 in tests of scalar invariance (Brown et al., 2022; F. F. Chen, 2007; Cheung & Rensvold, 2002).
Validity. In addition, the criterion validity and convergent validity of the scale were assessed in sample 3 by calculating the Pearson correlation coefficient between the E-APUS score and the Surveillance Use Scale developed by Tandoc et al. (2015), as well as subjective well-being. The discriminant validity was assessed using both the Fornell-Larcker criterion and the heterotrait-monotrait (HTMT) ratio criterion. Specifically, the Fornell-Larcker criterion requires that the square root of the average variance extracted (AVE) for a construct should exceed its correlations with other constructs. It is considered acceptable if all HTMT values are significantly lower than .85 (R. B. Kline, 2015) or .90 (Gold et al., 2001). In addition, if the bootstrapped confidence interval for the HTMT values, constructed using an HTML process, is significantly below a threshold of 1 (Henseler et al., 2015), such as .90 or even .85 (Hair et al., 2021), then discriminant validity is supported.
Reliability. Finally, the reliability of the E-APUS was examined. Sample 4 was used for test-retest reliability and discriminant validity testing. In summary, we employed SPSS 25.0, Mplus 8.0, and R 4.3.2 to conduct all statistical analyses.
Results
Confirmatory Factor Analysis
The six-factor model obtained from the EFA of Sample 1 was considered as the initial statistical model. Validating the latent variable structure suggested by EFA, an independent sample (N2 = 289) was utilized to conduct the CFA analysis. The initial CFA testing of the 33-item using maximum likelihood indicated a barely acceptable model fit (S-B χ2/df = 1.869, CFI = .903, TLI = .894, RMSEA = .055, SRMR = .062). The evaluation of residuals and modification indices (suggesting redundant or poorly aligned measures) resulted in the removal of items TW5, TW6, HS6, and F86 from the model, leading to a substantial improvement in the model fit (S-B χ2/df = 1.688, CFI = .935, TLI = .927, RMSEA = .049, SRMR = .053). The factor loadings ranged from .577 to .902 (see Fig. 2). These outcomes of the CFA demonstrated a satisfactory fit of the six-factor model, thereby resulting in the final selection of 29 items for inclusion in the E-APUS. Second- or higher-order models were not pursued as there was no identified theoretical justification for such exploration.
Figure 2. The Confirmatory Factor Analysis (CFA) Structural Diagram of E-APUS (N = 289).
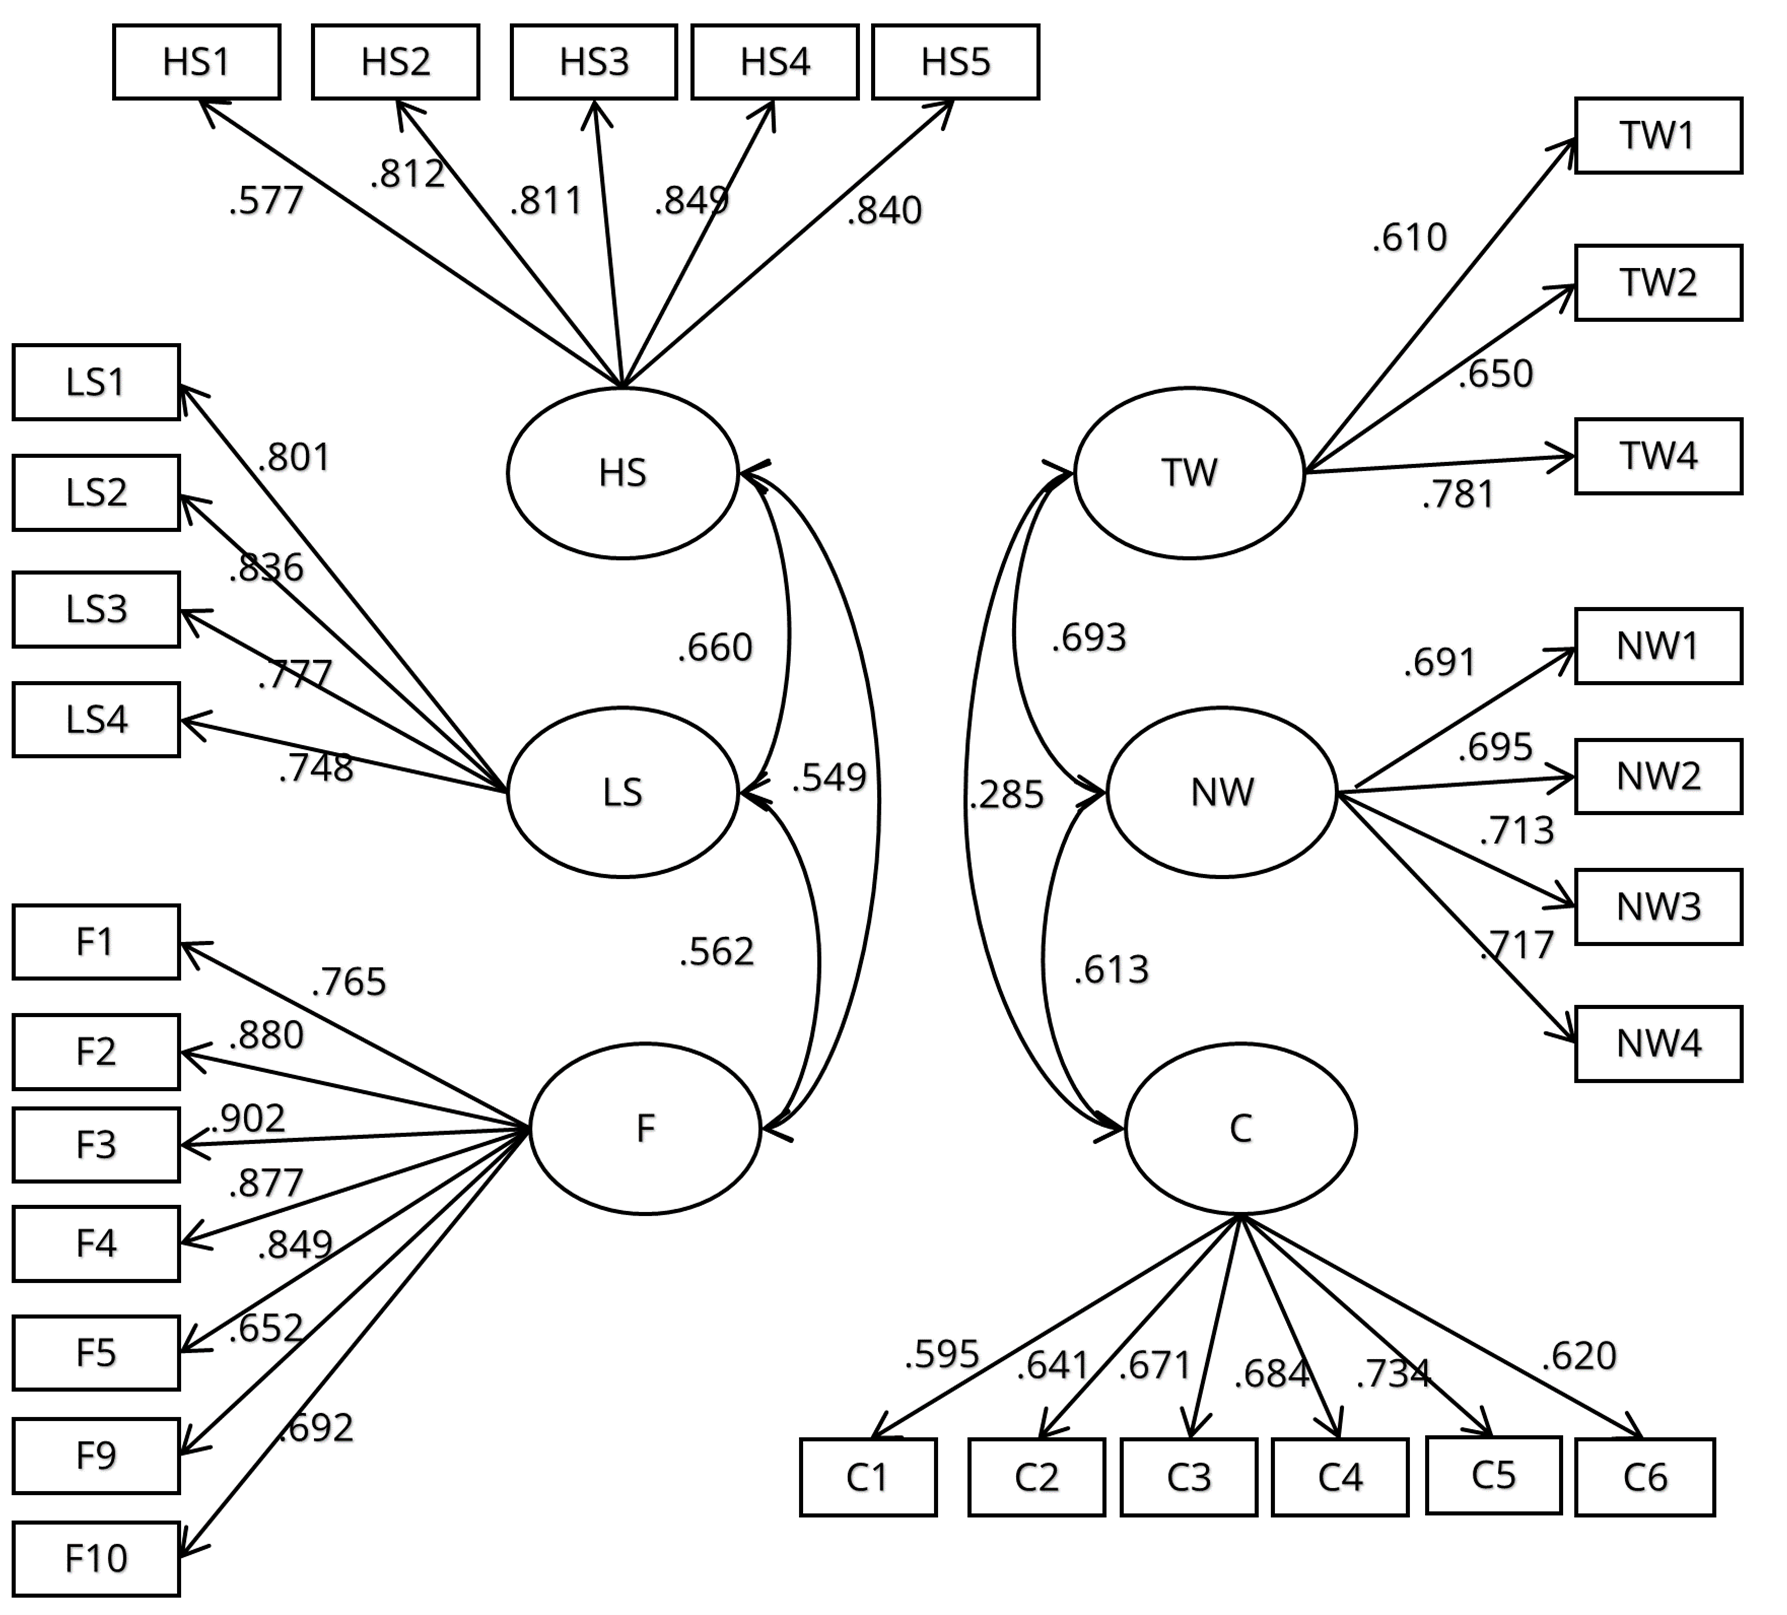
Note. The figure displays standardized factor loadings. To maintain clarity, the associations between the three dimensions of passive use (HS, LS, F) and the three dimensions of active use (TW, NW, C) have been omitted. TW = targeted-warm use; NW = non-targeted-warm use, C = cold use, HS = browsing high self-relevance success stories, LS = browsing low self-relevance success stories, F = browsing failure stories.
Finally, we validated the identified factor structure using an independent Sample 3 (N3 = 3,524) with the 29-item scale. The examination of stability for the E-APUS structure revealed satisfactory fit indices (CFI = .917, TLI = .907, RMSEA = .054, SRMR = .055). These results affirm the acceptability of the six-factor latent variable structure, adding to the validity of this configuration.
Measurement Invariance
Table 4 demonstrates that the configural invariance models across gender and education exhibited satisfactory model fit. These outcomes suggest the suitability of the six-factor model for comparisons across diverse groups characterized by gender and/or educational stage. Metric invariance models were then performed to examine group invariances of factor loadings across gender and education. The results indicated that fit indices across gender and education met the measurement invariance requirements, suggesting that there are no significant changes between the metric and configural invariance models for gender (ΔRMSEA = .000, ΔCFI = .002,
ΔSRMR = −.003) and education groups (ΔRMSEA = .000, ΔCFI = .004, ΔSRMR = −.004). To examine the equality of factor loadings and intercepts, we investigated scalar invariance. The results indicated that the fit of the scalar invariance model did not change substantially for gender (ΔRMSEA = −.001, ΔCFI = .006, ΔSRMR = −.001). This indicated that the intercepts and factor loadings were invariant across gender groups. For education, however, although overall CFA model changes were slightly more accentuated than for gender, considering all model fit indices altogether, we concluded that scalar invariance could also be established for education.
Table 4. Fit Indexes for the Measurement Invariance of the E-APUS Across Genders and Educational Stage (N3 = 3,524).
|
Model type |
S-Bχ2 |
df |
p-value |
RMSEA [90% CI] |
CFI |
TLI |
SRMR |
ΔRMSEA |
ΔCFI |
ΔSRMR |
|
Invariance testing: gender |
|
|
|
|
|
|
|
|
|
|
|
Configural |
4605.35 |
724 |
< .001 |
.055 [.054; .057] |
.915 |
.904 |
.057 |
|
|
|
|
Metric/weak |
4695.74 |
747 |
< .001 |
.055 [.053; .056] |
.913 |
.906 |
.060 |
.000 |
.002 |
−.003 |
|
Scalar/strong |
5015.75 |
770 |
< .001 |
.056 [.054; .057] |
.907 |
.902 |
.061 |
−.001 |
.006 |
−.001 |
|
Invariance testing: educational stage |
|
|
|
|
|
|
|
|
|
|
|
Configural |
4248.20 |
724 |
< .001 |
.053 [.051; .054] |
.913 |
.903 |
.056 |
|
|
|
|
Metric/weak |
4457.68 |
747 |
< .001 |
.053 [.052; .055] |
.909 |
.901 |
.060 |
.000 |
.004 |
−.004 |
|
Scalar/strong |
5152.87 |
770 |
< .001 |
.057 [.055; .058] |
.892 |
.886 |
.064 |
−.004 |
.017 |
−.004 |
Criterion-Related Validity, Convergent Validity, and Discriminant Validity
The validity of the latent factors in the final best-fitting model was tested by examining their bivariate correlations with external criteria. In this study, we used the total score of subjective well-being and its three indicators as external criterion measures for validating the E-APUS. Pearson correlations between all E-APUS sub-dimensions and additional assessments are presented in Table 5. As expected, targeted-warm use, non-targeted-warm use, and browsing low self-relevance success stories showed significant positive correlations with positive affect, life satisfaction, and subjective well-being, respectively. Cold use and browsing failure stories demonstrated significant positive correlations with negative affect, and negative correlations with life satisfaction, and subjective well-being. Importantly, browsing high self-relevance success stories demonstrated significant positive correlations with both positive and negative affect, but not with life satisfaction and subjective well-being. In general, these results indicated that the E-APUS showed fair criterion validity.
Table 5. Correlations Among the Factors and the Validity of the E-APUS.
|
|
TW |
NW |
C |
HS |
LS |
F |
P |
N |
LiS |
WB |
AU |
PU |
|
TW |
.76 |
.78 [.74; .78] |
.28 [.25; .32] |
.60 [.57; .63] |
.51 [.46; .52] |
.30 [.27; .34] |
|
|
|
|
|
|
|
NW |
.63** [.61; .65] |
.82 |
.47 [.45; .52] |
.68 [.66; .71] |
.57 [.52; .58] |
.42 [.40; .46] |
|
|
|
|
|
|
|
C |
.25** [.22; .28] |
.40** [.38; .43] |
.66 |
.47 [.44; .50] |
.11 [.07; .15] |
.66 [.62; .67] |
|
|
|
|
|
|
|
HS |
.50** [.48; .53] |
.57** [.55; .59] |
.42** [.39; .44] |
.74 |
.56 [.53; .58] |
.69 [.66; .70] |
|
|
|
|
|
|
|
LS |
.43** [.41; .46] |
.48** [.46; .51] |
.11** [.08; .14] |
.51** [.48; .53] |
.66 |
.32 [.26; .33] |
|
|
|
|
|
|
|
F |
.26** [.23; .29] |
.37** [.34; .40] |
.58** [.55; .60] |
.62** [.60; .64] |
.30** [.27; .33] |
.63 |
|
|
|
|
|
|
|
P |
.34** [.31; .37] |
.35** [.32; .38] |
−.04* |
.19** [.15; .22] |
.41** [.38; .44] |
−.02 [−.05; .01] |
1 |
|
|
|
|
|
|
N |
.02 [−.02; .05] |
.06** [.03; .09] |
.38** [.35; −.46] |
.21** [.17;.24] |
-.04* [−.07; −.003] |
.39** [.36; .42] |
−.21** [−.24; −.18] |
1 |
|
|
|
|
|
LiS |
.19** [.15; .22] |
.19** [.15; .22] |
−.16** [−.19; −.12] |
.02 [−.01; .06] |
.24** [.21; .27] |
−.16** [−.19; −.13] |
.54** [.52; .56] |
-.39** [−.42; −.37] |
1 |
|
|
|
|
WB |
.23** [.19; .26] |
.21** [.18; .25] |
−.23** [−.27; −.20] |
.01 [−.02; .04] |
.30** [.27; .33] |
−.24** [−.27; −.20] |
.75** [.73; .76] |
−.65** [−.67; −.63] |
.89** [.88; .90] |
1 |
|
|
|
AU |
.48** [.46; .51] |
.55** [.53; .57] |
.41** [.38; .43] |
.50** [.47; .52] |
.27** [.24; .30] |
.38** [.35; .41] |
.19** [.15; .22] |
.12** [.09; .15] |
.07** [.04; .10] |
.07** [.03; .10] |
1 |
|
|
PU |
−.01 [−.04; .02] |
.07** [.04; .10] |
.23** [.20; .26] |
.21** [.18; .25] |
.06** [ .03; .09] |
.30** [.27; .33] |
−.01 [-.04; .03] |
.14** [.11; .18] |
−.06** [−.09; −.03] |
−.09** [−.12; −.06] |
.09** [.06; .12] |
1 |
|
Ne |
.23** [.11; .34] |
.15* [.03; .27] |
.19** [.06; .30] |
.25** [.13; .36] |
.12 [-.00; .24] |
.26** [.15; .37] |
|
|
|
|
|
|
|
Co |
.30** [.18; .41] |
.22** [.10; .34] |
.04 [-.09; .16] |
.23** [.11; .34] |
.26** [.15; .37] |
.14* [.18; .26] |
|
|
|
|
|
|
|
A |
.28** [.16; .39] |
.21** [.08; .32] |
-.03 [-.15; .10] |
.30** [.18; .41] |
.21** [.09; .33] |
.16** [.04; .28] |
|
|
|
|
|
|
|
O |
.34** [.22; .44] |
.33** [.21; .43] |
.19** [.08; .31] |
.26** [.14; .37] |
.29** [.17; .39] |
.21** [.09; .33] |
|
|
|
|
|
|
|
E |
.22** [.10; .33] |
.24** [.12; .36] |
.11 [-.02; .23] |
.18** [.05; .29] |
.14* [.02; .26] |
.09 [-.04; .21] |
|
|
|
|
|
|
|
Note. The sample sizes above (N3 = 3,524) and below (N4 = 254) of the middle bold horizontal line differ; Heterotrait-Monotrait (HTMT), Fornell-Larcker’s criteria = Bold values on the diagonal are the square root of AVE; values above the diagonal are HTMT values and its confidence intervals, while those below are the correlations between dimensions. TW = targeted-warm use; NW = non-targeted-warm use; TC = targeted-cold use; NC = non-targeted-cold use; HS = browsing high self-relevance success stories; LS = browsing low self-relevance success stories; HF = browsing high self-relevance failure stories; LF = browsing low self-relevance failure stories; P = positive affect; N = negative affect; LiS = life satisfaction; WB = subjective well-being; AU = active use; PU = passive use; Ne = neuroticism; Co = conscientiousness; A = agreeableness; O = Openness; E = Extraversion. * p < .05, **p < 0.01. |
||||||||||||
In addition, correlations were estimated between the E-APUS sub-dimension and the Surveillance Use Scale that includes both active and passive SM use (see Table 5). All six sub-dimensions of the E-APUS were positively correlated with active use, r = [.27, .55]. Similarly, there were positive correlations observed between the scores on the five sub-dimensions of the E-APUS and passive SM use, r = [.06, .30]. One exception was that targeted-warm use was not significantly correlated with passive SM use (r = −.01, p = .546). These findings provided important evidence for the convergent validity of the E-APUS.
Finally, the five dimensions of the Big Five personality inventory were used to test the discriminant validity of the E-APUS. The results of a correlation analysis indicated that the six sub-dimensions of E-APUS were only weakly to moderately correlated with conscientiousness (r = .04 ~ .30), neuroticism (r = .12 ~ .26), agreeableness (r = −.03 ~ .30), openness (r = .19 ~ .34), and extraversion (r = .09 ~ .24) as seen in Table 5. Furthermore, the discriminant validity using the Fornell-Larcker and HTMT criterion was used to estimate the discriminant validity. The results showed that the square root of the AVE values for each dimension exceeded the correlations between that specific dimension and other dimensions (range = .63 ~ .82). In addition, all HTMT values were below 0.85 (range = .28 ~ .78), and bootstrapped confidence is significantly below a threshold of 1 (see Table 5).
Reliability Analysis
The internal consistency of the six E-APUS sub-dimensions was explored using another independent large-scale Sample 3 from China (N3 = 3,524). Taking into account the limitations of the Cronbach’s α, this study also computed the complementary measure of composite reliability, McDonald’s ω (see Table 6). Cronbach’s α coefficients indicated good internal consistency for all subdimensions (M = .850, SD = .046, range = .800 ~ .914), and consistent results were also observed with McDonald’s ω (M =.852, SD = .045, range = .803 ~ .915). The Cronbach’s α coefficients and McDonald’s ω coefficients for the overall scale were .931 and .929, respectively. Similar to the investigation by Godfrey et al. (2023), we utilized mean inter-item correlations to examine the coherence and consistency of items within the same sub-dimension of the E-APUS. The results unveiled a moderate average correlation, indicating that items within a sub-dimension exhibited consistency and lessened the likelihood of item redundancy (M = .561, SD = .079, range = .456 ~ .676).
Table 6. Internal Consistency and Test–Retest Reliability Coefficients.
|
E-APUS sub-dimension |
ω |
α |
MIC |
Test-retest |
|
Targeted-warm Active Use |
.812 |
.809 |
.589 |
.836 |
|
Non-targeted-warm Active Use |
.803 |
.800 |
.499 |
.810 |
|
Cold Active Use |
.830 |
.828 |
.456 |
.842 |
|
Browsing High self-relevance Success Stories |
.858 |
.855 |
.541 |
.751 |
|
Browsing Low self-relevance Success Stories |
.895 |
.893 |
.676 |
.732 |
|
Browsing Failure Stories |
.915 |
.914 |
.603 |
.767 |
|
Total score |
.931 |
.929 |
|
.787 |
|
Note. ω = McDonald’s ω ; α = Cronbach’s coefficient alpha; MIC = mean interitem correlation. |
||||
In an additional, independent sample (N4 = 254), we invited individuals to complete the E-APUS twice, with an interval of approximately two weeks. This data was used to determine the test-retest reliability of the scale. The results of the test-retest reliability analysis indicated a strong correlation between the scores of each sub-dimension at both time points (range = .732 ~ .842).
Overall, we collected consistent empirical evidence indicating both good consistency and stability for the E-APUS (see Table 6).
Discussion
The E-APUS comprises 29 items and demonstrates satisfactory construct validity and measurement invariance. CFA indicated that the six-factor structure of E-APUS showed good fit to the data, with all factor loadings exceeding .577. Additionally, we assessed the fit of the six-factor model in independent high school and university samples (i.e., across educational stages) and consistently supported these findings. Notably, to the best of our knowledge, existing scales for the use of Social Networking Sites (SNSs) did not explore measurement invariance across gender and education. Establishing the measurement invariance of a scale is crucial for the identification of measurement tools that accurately capture the intended concepts and offer reliable and comparable results across diverse populations (Brown et al., 2022). The current study results indicate that the six-dimensional structure of the E-APUS demonstrated measurement invariance in terms of its configural structure, factor loadings, and factor intercepts across gender and educational stages. This finding suggests that the E-APUS maintains the same meaning and function for both males and females, as well as for middle school students and college students.
The E-APUS demonstrated satisfactory criterion-related validity (addressing RQ2). We used the overall score of subjective well-being and its three facets as the external validation questionnaire for the E-APUS. With the exception of the sub-dimension of browsing high self-relevance success stories, which shows seemingly contradictory results, the associations aligned with the theoretical expectations based on the extended active-passive model (Verduyn et al., 2022). Specifically, targeted-warm use and non-targeted-warm use were positively correlated with positive affect, life satisfaction, and subjective well-being, whereas cold use was negatively correlated with these variables and positively correlated with negative affect. This implies that targeted-warm use (e.g., directly interacting with friends, providing social support) can promote social connections, emotional support, and social capital, enhancing a sense of belonging and thereby improving positive emotions and well-being (Verduyn et al., 2017). Our finding aligns with social capital theory, which suggests that deep social interactions contribute to individual psychological well-being (Wenninger et al., 2019; Williams, 2006).
Non-targeted-warm use primarily involves self-expression and self-disclosure (e.g., posting status updates, sharing positive content), which helps individuals reinforce self-identity and gain indirect social recognition (Peter et al., 2005). Although this type of use is less interactive, it can still enhance well-being by boosting self-esteem and a sense of social connection. However, since cold use lacks effective social interaction, it typically fails to provide direct social rewards or emotional fulfillment. This may lead users to experience a sense of social disconnection and question their own social value, thereby reducing life satisfaction and increasing negative emotions. An interesting observation is that, although the extended active-passive model suggests that targeted-warm use would have a more positive impact on positive affect and well-being compared to non-targeted warm use, our results show that their correlation coefficients with positive affect and well-being are similar. This finding suggests that warm-cold may be more consequential than targeted and non-targeted, but their effects may vary across individuals. In summary, our results add important nuance to the ongoing debate on whether active social media use necessarily enhances subjective well-being. Additionally, we provide empirical evidence from a non-Western context, supporting the integration of the different conceptual viewpoints at an aggregate level.
Consistent with the theoretical hypothesis, browsing high self-relevance success stories was positively correlated with negative affect. This result supports social comparison theory (Festinger, 1954), which suggests that when individuals browse success-related content highly relevant to their self-concept, they are more likely to engage in upward social comparison (Verduyn et al., 2020). This comparison may evoke feelings of inferiority, leading to heightened negative emotions, reduced positive emotions, and lower levels of life satisfaction and subjective well-being (Meier & Krause, 2022). Unexpectedly, browsing high self-relevance success stories was also positively correlated with positive affect. This finding also reminds us to consider the positive outcomes of social comparison, as upward social comparison can sometimes be inspiring (Meier et al., 2020).
In addition, emotional contagion theory suggests that social information on SM can influence viewers’ emotions through emotional contagion. In other words, even if success-related content is highly relevant to an individual’s self-concept, viewing this content may still evoke feelings of admiration and encouragement (de Vries et al., 2018; Hatfield et al., 1993; Lin & Utz, 2015). These two competing theories explain why browsing high self-relevance success stories was positively correlated with both positive affect and negative affect. Equally important is the fact that individual differences play a crucial role in the outcomes of SM use (Verduyn et al., 2022). For instance, individuals with high social comparison tendencies are more likely to engage in upward social comparisons when browsing high self-relevance success stories, potentially decreasing positive affect and increasing negative affect. Additionally, the outcomes of browsing high self-relevance success stories may be strongly influenced by platform differences and the level of familiarity with the posters (Midgley et al., 2021).
As expected, browsing low self-relevance success stories was positively correlated with positive affect, life satisfaction and subjective well-being, possibly because these success stories have low personal relevance to the individual, thereby avoiding social comparison pressure or self-threat (Festinger, 1954). Instead, individuals may perceive them as a source of inspiration, experiencing a positive role model effect, which enhances their sense of hope and positive affect. On the other hand, browsing failure stories was positively correlated with negative affect, possibly because such stories evoke empathetic responses, leading individuals to experience feelings of sadness, disappointment, or helplessness (Hancock et al., 2008). Additionally, individuals may relate these failure experiences to their own situations, triggering uncertainty about the future or anxiety, which further intensifies negative emotions. This is consistent with the emotional contagion theory (Hatfield et al., 1993).
The E-APUS demonstrated robust convergent and discriminant validity (addressing RQ2). Consistent with the previously mentioned hypothesis, in terms of convergent validity, all E-APUS sub-dimensions, except for “targeted-warm use,” showed significant positive correlations with the sub-dimensions of commonly used questionnaires for active and passive SM use. Targeted-warm use is essentially an active social behavior, whereas the dimensions of existing passive use scales typically emphasize “non-interactive content browsing” (passive browsing) or “one-way information consumption” (Valkenburg, van Driel et al., 2022). Therefore, from a theoretical perspective, targeted-warm use does not align with the concept of passive use, which explains its lack of correlation with the passive use dimension. Furthermore, previous research has shown that social interaction behaviors can enhance feelings of social support and belonging (Burke et al., 2010), whereas one-way information consumption often does not produce similar psychological effects. Therefore, these two types of behaviors may have fundamental differences, leading to a low correlation between them.
Additionally, the correlations between E-APUS and personality traits provide evidence for discriminant validity. As expected, targeted-warm use and non-targeted-warm use were positively correlated with extraversion, openness, agreeableness, and conscientiousness. This may be because individuals with these personality traits tend to engage in active social interactions, express their opinions more readily, maintain friendly relationships, and participate in goal-oriented social interactions (Seidman, 2013). This aligns with the social enhancement hypothesis (Peter et al., 2005), which suggests that socially skilled and disciplined individuals gain more social support and capital through warm interactions. Cold use and browsing failure stories were positively correlated with neuroticism, possibly because neurotic individuals tend to cope with stress through avoidance, complaining, or emotional reactions and are more sensitive to negative information (e.g., failure stories on SM) and external stressors (Seidman, 2013). Browsing high self-relevance success stories correlated positively with all five personality traits, suggesting that individuals with different traits may gain motivation and positive feedback—extroverts use them as social topics, open individuals seek new insights, agreeable individuals feel resonance, conscientious individuals boost their drive, and neurotic individuals find comfort or hope (Cheng et al., 2019; Kim et al., 2013; Seidman, 2013). In addition to the expected positive correlations between browsing low self-relevance success stories and extraversion and openness, it is also positively correlated with conscientiousness and agreeableness. This may be because individuals high in conscientiousness are goal-oriented and tend to draw motivation from others’ successes to improve their own performance (Seidman, 2013). Those high in agreeableness, meanwhile, are more attuned to others’ feelings and needs, and may find resonance in these success stories, strengthening their interpersonal relationships and social identity (Seidman, 2013). In light of all these correlations, the Fornell-Larcker criterion and HTMT results still supported the discriminant validity of E-APUS.
Finally, the E-APUS demonstrated good internal consistency and test-retest reliability (addressing RQ3). Regarding reliability, both Cronbach’s α coefficients and McDonald’s ω indicate that the whole scale and its six sub-dimensions boast good internal consistency (>.800). Additionally, a test-retest reliability analysis conducted on another sample (N4 = 254) after a two-week interval demonstrates correlation coefficients between the initial and subsequent measurements ranging from .732 to .842. This underscores that the E-APUS maintains satisfactory test-retest reliability. In summary, all reliability indicators meet measurement requirements, affirming that the E-APUS possesses sufficient internal consistency and temporal stability for further use and exploration.
General Discussion
Although several validated scales exist in SM research (e.g., Ellison et al., 2007; Gerson et al., 2017; Ozimek et al., 2023; Tuck & Thompson, 2024; see Table 1 for more details), a comprehensive, cross-platform measurement remains lacking (H. Appel et al., 2016; Trifiro & Gerson, 2019; Valkenburg, van Driel et al., 2022). The present study is an important step in that direction and aimed to develop and validate the Extended Active-Passive Use Scale (E-APUS) for measuring individuals’ SM usage behavior. The two studies presented in this paper included a total of four samples and Ntotal = 4,372 individuals. The data confirmed the 29-item Extended Active-Passive Use Scale (E-APUS) as a psychometrically robust measurement tool with six sub-dimensions. Specifically, Study 1 established a six-factor structure, and the CFA in Study 2 demonstrated good fit with the data. Measurement invariance of the E-APUS was established across gender and educational stages and adds to the robustness of the scale. Furthermore, the studies presented in this paper show strong criterion and convergent validity of the scale, with Cronbach’s α coefficients and McDonald’s ω both exceeding .800, and good test-retest stability over time. The theoretical value, practical significance, and applicability of the E-APUS scale across different cultural contexts will be further discussed to provide a more comprehensive perspective.
The theoretical contribution of the E-APUS scale lies primarily in its refinement and expansion of the traditional active-passive model. Previous studies have generally classified SM use into active and passive categories; however, this binary distinction is overly simplistic and fails to account for the mixed findings observed in research. For example, prior studies have suggested that passive SM use (e.g., browsing) reduces well-being (Verduyn et al., 2015), but they did not distinguish between different types of browsing behaviors, making it unclear which content attributes contribute to negative effects on well-being. To address this issue, the E-APUS scale was designed to provide a more nuanced classification of SM use by incorporating two core dimensions: reciprocity/emotional quality of communion and relevance/achievement attributes. This refined approach allows for a more precise examination of how different types of SM engagement impact psychological well-being. For instance, with the E-APUS scale, we can distinguish between browsing behaviors that may decrease well-being and those that might serve as positive emotional regulation strategies. Similarly, prior research has found that active SM use is generally associated with higher well-being (e.g., Valkenburg, van Driel et al., 2022), but this conclusion may be limited by measurement constraints. Traditional measures of active use often overlook different subtypes of active use, such as cold use—a type of behavior that may not foster positive social interactions and could even have neutral or negative effects on well-being. The refined dimensions in the E-APUS scale allow researchers to identify and account for these variations, leading to a more accurate assessment of how active SM use influences psychological outcomes.
In addition, beyond being an improvement in measurement, this study also serves as an extension and validation of the active-passive model. As SM research continues to evolve, there is a need to continuously refine existing theories and test their applicability in different contexts. The development and validation of E-APUS provide new empirical support for the extended active-passive model and offers a more precise measurement tool for future research, contributing to the advancement in this field. Notably, the E-APUS scale focuses on the common features of SM rather than platform-specific functions. This design gives the scale strong cross-platform applicability, making it suitable for various SM environments. The ability to measure SM use across different platforms helps mitigate measurement inconsistencies caused by platform-specific functional changes, thereby enhancing the generalizability and external validity of SM research. In conclusion, the E-APUS scale not only addresses the measurement limitations of the traditional active-passive model but also enhances our understanding of SM usage patterns through more refined classifications. It provides a valuable tool for future research and contributes to the deeper exploration of SM psychology.
The development of E-APUS provides a reliable tool for assessing, intervening in, and managing SM use, offering a certain degree of practical value. In the field of mental health, E-APUS can help mental health professionals (such as clinical psychologists and counselors) identify individuals’ SM usage patterns, evaluate their relationship with mental health conditions (such as anxiety, depression, and social isolation), and design personalized intervention strategies. For example, users who tend to engage in “cold use” may be encouraged to increase “warm use” behaviors, such as engaging in supportive interactions with friends rather than merely posting content or passively browsing, thereby improving social satisfaction and mental well-being. In education and family guidance, E-APUS has demonstrated cross-group stability among adolescents and adults. Therefore, it is particularly useful for understanding adolescent SM usage patterns. Educators and parents can use this scale to identify potential risk behaviors, such as excessive attention to failure stories (browsing failure stories) or a tendency toward negative social comparison. Based on these insights, reasonable usage guidelines can be developed, such as encouraging adolescents to increase positive interactions (e.g., sharing valuable information and engaging in supportive conversations with peers) while reducing exposure to low-quality or negative content, thereby preventing the maladaptive use of SM and its potential negative consequences. Furthermore, E-APUS may provide data support for the design and optimization of SM platforms. Platforms can refine their content recommendation strategies based on users’ E-APUS scores—for instance, reducing the push of negative content or incorporating interface designs and prompt mechanisms that encourage positive interactions, ultimately enhancing user experience and platform engagement. In summary, E-APUS is not only a scientific measurement tool but also an important means of promoting adaptive SM use, holding certain practical significance.
Although the theoretical framework of the E-APUS scale has the potential for cross-cultural applicability, its cultural universality still requires further empirical validation. Specifically, the development of E-APUS focuses on the common characteristics of social media use rather than behavior patterns specific to particular cultural contexts. For example, the core dimensions of the scale (such as cold use and browsing failure stories) are based on universal psychological and behavioral characteristics of social media use rather than being confined to a specific culture. Therefore, in theory, the scale has the potential for cross-cultural applicability. However, despite the generalizability of the core structure of E-APUS, variations in social media usage patterns and psychological mechanisms may exist across different cultural backgrounds. For instance, individualistic and collectivistic cultures differ significantly in terms of social interaction patterns, social comparison tendencies, and information processing styles (Hofstede, 2001). These cultural variables may influence individuals’ scores on the dimensions of E-APUS. Additionally, meta-analyses on the relationship between social media use and mental health have also identified cultural background as a moderating factor (Meier & Reinecke, 2021; Yin et al., 2019), further indicating that the psychological effects of social media use may vary across cultures.
From an empirical perspective, the development of the E-APUS scale was based on an extended active-passive model, where four dimensions fully aligned with this model, while the other four dimensions were integrated into cold use and browsing failure stories. This finding suggests that social media usage patterns may exhibit both commonalities and cultural-specific characteristics across different cultural settings. Therefore, to ensure the cross-cultural applicability of E-APUS, future research should conduct measurement invariance tests to assess the structural consistency of the scale across different cultural groups. Additionally, cross-cultural comparative studies could explore how E-APUS dimensions manifest in various cultural contexts, for example:
Is cold use more prevalent in individualistic cultures?
Do browsing failure stories elicit similar emotional responses across different cultural backgrounds?
In conclusion, further research is needed to validate the applicability of the E-APUS scale across diverse cultural contexts and to explore cultural differences in social media usage patterns, ensuring the scale’s effectiveness and generalizability on a global scale.
Limitations
This study is subject to several limitations that warrant acknowledgment. First, although the aim is to develop a universal, concise, and highly accurate instrument for understanding the behaviors of teenagers and young adults using Social Media (SM), certain expressions of the underlying constructs may differ across people. For example, specific content that is relevant for certain people may not be relevant for others. However, the items were based on qualitative interviews, and the topics also reflect comparison dimensions that have been typically identified in prior research on social comparison (e.g., appearance, career, travelling; Krasnova et al., 2013). Therefore, the attribute of “high self-relevance” in the dimension of “browsing high self-relevance success stories” is particularly intricate to define due to significant variations among individuals and groups. This may require future research to expand or validate these attributes. Second, we observed less satisfactory model fit for scalar measurement invariance during the educational stage. Therefore, further research is necessary to further investigate which items of the scale are particularly robust to capture active and passive SM use across different populations. Finally, the data collection in this study was limited to China, which may restrict the generalizability of the findings. For example, Chinese users do not have access to platforms such as Facebook, Twitter, and Instagram. Therefore, the social media examined in this study primarily includes popular Chinese platforms such as WeChat, QQ, Douyin, Xiaohongshu, and Kuaishou. To enhance the generalizability of the results, future research should consider replicating these findings using cross-national samples with greater diversity in age and gender.
Conclusion
Although some tools have been developed to measure active and passive social media use, research in this field still emphasizes the lack of sufficiently effective, granular, and comprehensive measurement instruments (e.g., Trifiro & Gerson, 2019; Valkenburg, van Driel et al., 2022). Building upon this, the study aims to overcome the limitations of previous questionnaires, addressing their rudimentary nature, lack of specificity, and inadequate validation. This paper presents a new, more fine-grained and extensible scale that is guided by interaction and content types across social media. In summary, the 29-item Extended Active-Passive Use Scale (E-APUS) emerges as a valid and reliable questionnaire for measuring the SM use behaviors of adolescents and young adults.
Footnotes
1 Xiaohongshu combines user-generated content, primarily focusing on lifestyle, knowledge sharing, product reviews, and recommendations.
2 Kuaishou is a Chinese short-video platform that allows users to create, share, and discover videos, often featuring everyday life and creative content.
3 The educational stages were divided into two groups based on the age of 18: adolescents (18 years and younger) and young adults (over 18 years old).
4 The post-hoc power is .90, which is above the commonly recommended threshold of .80, indicating that the sample size is sufficient to effectively detect significant effects in the model.
5 The post-hoc power is .81, which is above the commonly recommended threshold of .80, indicating the validity of the sample size.
6 Removing these items reduced “targeted-warm active use” factors to only three items. While this is not ideal, it is permissible while internal consistency remains strong (Hair et al., 2010). The internal consistencies of the final factor configurations are provided in Table 5. No factor has internal consistency lower than .800, thus confirming our decisions.
Conflict of Interest
The authors have no conflicts of interest to declare.
Use of AI Services
Assistive AI tools were used solely for language polishing and editing purposes during the preparation of the manuscript. No AI tools were involved in the generation of content or data analysis.
Acknowledgement
Data availability: All data, analysis code, and research materials are available upon request from the first author. This study is funded by the program “The Research Innovation Program of Graduate Students in Chongqing (CYB240084).
Appendices
Appendix A. Interview Outline
- I will ask you some basic information, such as your age, grade, major, and hometown. Additionally, when did you first start using social networking sites? How long do you currently use them each day? And how long does each session typically last?
- What are the types of behaviors associated with the use of social networking sites? What active behaviors do you typically engage in on social networking sites? And what about passive behaviors?
- When using social media, what approach do you take in chat conversations? Why?
- When engaging in online chat with others, what behaviors and expressions do you exhibit to convey a warm and friendly attitude? How do you update your status to reflect warmth and friendliness?
- What are some ways in which indifference and hateful interactions occur on social networking sites? If you have a conflict or disagreement with someone, what behaviors and expressions do you exhibit during online chat? If you want to portray indifference or apathy, how would you behave and express yourself when posting updates?
- When using social networking sites, what types of content do you tend to browse or access frequently? Which content do you consider highly relevant or closely related to yourself? And which content do you consider less relevant or weakly related to yourself?
- If we categorize the nature of content posted on social networking sites into successful and failure, what are some examples of failure content that people often post? And what are some examples of successful content?
- Generally speaking, successful content may evoke envy, while unsuccessful content may elicit sympathy. How do you personally feel when you come across such content? Do you experience any emotional reactions?
- Do you think the words “success” and “failure” can fully encompass the nature of the content you see? If not, please express your opinion.
Appendix B. The Extended Passive-Active Use Scale (E-APUS)
How frequently do you perform the following activities when you are on social media (SM)? 1 = Never (0%); 2 = Rarely (25%); 3 = Sometimes (50%); 4 = Somewhat frequently (75%); 5 = Always (100%)
Table B1. The Extended Passive-Active Use Scale (E-APUS).
|
Items |
|
TW1: When others are facing difficulties, I reach out to them through text, voice, or video to support and comfort them. |
|
TW2: When someone posts about their success, I congratulate them via private chat, like, or comment. |
|
TW3: I support and care about others by text, voice, or video. |
|
NW1: I share content or links that I find interesting and enjoyable in group chats. |
|
NW2: I share articles or links that are helpful to my studies, life, and work to SM. |
|
NW3: I forward others’ requests for help or important updates to group chats. |
|
NW4: I share content or links that I find interesting and enjoyable on SM. |
|
C1: I express my dislike of others through text, voice, or video. |
|
C2: I get into disputes or conflicts with others via text, voice, or video. |
|
C3: I criticize or negate posts that I don’t approve of or dislike. |
|
C4: I post unconfirmed social events, gossip, or opinions. |
|
C5: I gossip or complain about others in the group, even if they’re not there. |
|
C6: I create and share some whining or sarcastic posts. |
|
HS1: I browse SM about others’ success in improving their appearance (e.g., weight loss or body shape). |
|
HS2: I browse others’ academic or work achievements on SM. |
|
HS3: I browse on SM for beautiful photos of other people’s adventures or travels. |
|
HS4: I browse other people’s posts and happy daily lives with their partners on SM. |
|
HS5: I browse on SM for others’ vibrant campus life or comfortable work situations. |
|
LS1:I browse on SM for news on breakthrough technology advancements. |
|
LS2: I browse SM for positive news on political or economic developments in other countries. |
|
LS3: I browse SM for the latest cultural and archeological excavations. |
|
LS4: I browse SM for updates on others’ outstanding performances in major competitions. |
|
F1: I browse posts on SM where others fail to improve their personal appearance. |
|
F2: I browse on SM for content on others’ academic or occupational struggles. |
|
F3: I browse posts on SM about other people’s setbacks in romantic relationships. |
|
F4: I browse the daily lives of others expressing depression and bad feelings on SM. |
|
F5: I browse posts on SM where other people are struggling with interpersonal relationships. |
|
F6: I browse on SM for negative news about a certain celebrity. |
|
F7: I browse SM for content that others have been eliminated in big competitions. |
|
Note. E-APUS = Extended Active-Passive Use Scale; TW = targeted-warm use; NW = non-targeted-warm use; C = cold use; HS = browsing high self-relevance success stories; LS = browsing low self-relevance success stories; F = browsing failure stories; SM = social media. |
Appendix C. Definitions of the E-APUS Sub-Dimension
Table C1. Definitions of the E-APUS sub-dimension.
|
E-APUS sub-dimension |
Definitions |
|
Targeted-warm Use |
Active engagement with SM, involving warm and positive interactions with specific targets or individuals (e.g., warm one-on-one interaction). |
|
Non-targeted-warm Use |
Active engagement with SM, involving warm and positive interactions without specific targets or individuals (e.g., posting content that is beneficial for learning, living, or working.). |
|
Cold Use |
Active engagement with SM, involving cold and negative interactions with(out) specific individuals or groups (e.g., online verbal attacks). |
|
Browsing High self-relevance Success Stories |
Passive engagement with SM, involving browsing or reading success stories that are highly relevant to personal interests or goals. |
|
Browsing Low self-relevance Success Stories |
Passive engagement with SM, involving browsing or reading success stories that are less relevant to personal interests or goals. |
|
Browsing Failure Stories |
Passive engagement with SM, involving browsing or reading failure stories. |
|
Note. E-APUS = Extended Active-Passive Use Scale; SM = social media use. |
|

This work is licensed under a Creative Commons Attribution-ShareAlike 4.0 International License.
Copyright © 2025 Xiang Niu, Philippe Verduyn, James Gaskin, Sebastian Scherr, Dean McDonnell, Jin-Liang Wang