
The anxiety spiral: Reciprocal reinforcement between uncertainty intolerance and social comparison on social networking sites
Vol.19,No.3(2025)
Qing Yang
 Xinhui Qiu
Yicheng Wang
Miao Lv
Xinhui Qiu
Yicheng Wang
Miao Lv
The widespread adoption of social networking sites (SNSs) has facilitated easy access to others’ shared content and life presentations, catalyzing upward social comparison. When faced with uncertainty, individuals tend to engage in upward social comparison as a self-evaluation tool, deriving ways for self-improvement and personal growth that may contribute to regained psychological stability. However, excessive indulgence in such comparisons may backfire, exacerbating intolerance of uncertainty (IU). Despite a theoretical link between IU and upward social comparison on SNS, no research has combined the two so far. Thoroughly exploring this issue holds significant practical importance, especially during emerging adulthood, because this period is characterized by an intricate transition from adolescence to full adulthood, marked by a variety of challenges and uncertainties. Therefore, we conducted a ten-month longitudinal study among emerging adults in China, with a mean age of 19.24 years (N = 460), to examine predictive relationships between IU and upward social comparison on SNS. We found such reciprocal associations using a three-wave cross-lagged panel model. Specifically, IU has a positive longitudinal predictive effect on the intensity of upward social comparisons on SNS. In contrast, upward social comparisons on SNS in the prior wave positively predicted IU in the subsequent wave, establishing a vicious cycle. Our findings may provide valuable insights for young social media users, helping them to cope more effectively with uncertainty and the pressures of social comparison, ultimately contributing to their emotional well-being.
intolerance of uncertainty; social comparison; social networking sites; cross-lagged panel model; emerging adults
Qing Yang
School of Psychology, Faculty of Education, Qufu Normal University, Qufu, China; Research Center for Personality Development and Education of Children and Adolescents, Qufu Normal University, Qufu, China
Dr. Qing Yang is an Associate Professor and the director of Research Center for Personality Development and Education of Children and Adolescents at Qufu Normal University. His research interests include social media, self-concept, social cognition, and social neuroscience. Dr. Yang's work has been published in Biological Psychology, International Journal of Intercultural Relations, Self and Identity, Personality and Individual Differences, and BMC Psychology. Additionally, he serves as a reviewer for numerous academic journals, including the Journal of Personality, Journal of Social and Personal Relationships, Self and Identity, Cyberpsychology: Journal of Psychosocial Research on Cyberspace, Behavioural Brain Research, Personality and Individual Differences, Current Psychology, and Scientific Reports. He also serves as an Academic Editor for PLOS One.
Xinhui Qiu
School of Psychology, Faculty of Education, Qufu Normal University, Qufu, China
Xinhui Qiu is a MA candidate in the School of Psychology, Qufu Normal University. Her research interest focus on social media and personality.
Yicheng Wang
School of Psychology, Faculty of Education, Qufu Normal University, Qufu, China
Yicheng Wang is a MA candidate in the School of Psychology, Qufu Normal University. Her research interest focus on social media and personality.
Miao Lv
School of Psychology, Faculty of Education, Qufu Normal University, Qufu, China; Research Center for Personality Development and Education of Children and Adolescents, Qufu Normal University, Qufu, China
Dr. Miao Lv is an Associate Professor at the School of Psychology and the Research Center for Personality Development and Education of Children and Adolescents, Qufu Normal University. Her research interests include personality, social cognition, and mental health.
Arnett, J. J. (2000). Emerging adulthood: A theory of development from the late teens through the twenties. American Psychologist, 55(5), 469–480. https://doi.org/10.1037/0003-066X.55.5.469
Arnett, J. J. (2004). Emerging adulthood: The winding road from the late teens through the twenties. Oxford University Press.
Arroyo, A. (2014). Connecting theory to fat talk: Body dissatisfaction mediates the relationships between weight discrepancy, upward comparison, body surveillance, and fat talk. Body Image, 11(3), 303–306. https://doi.org/10.1016/j.bodyim.2014.04.006
Bai, X., Liu, X., & Liu, Z. (2013). 初中生社会比较在成就目标与学业自我效能感之间的中介效应 [The mediating effects of social comparison on the relationship between achievement goal and academic self-efficacy: Evidence from the junior high school students]. Journal of Psychological Science, 36(6), 1413–1420. https://doi.org/10.16719/j.cnki.1671-6981.2013.06.004
Becht, A. I., Nelemans, S. A., Branje, S. J. T., Vollebergh, W. A. M., & Meeus, W. H. J. (2021). Daily identity dynamics in adolescence shaping identity in emerging adulthood: An 11-year longitudinal study on continuity in development. Journal of Youth and Adolescence, 50(8), 1616–1633. https://doi.org/10.1007/s10964-020-01370-3
Butzer, B., & Kuiper, N. A. (2006). Relationships between the frequency of social comparisons and self-concept clarity, intolerance of uncertainty, anxiety, and depression. Personality and Individual Differences, 41(1), 167–176. https://doi.org/10.1016/j.paid.2005.12.017
Buunk, B. P., Schaufeli, W. B., & Ybema, J. F. (1994). Burnout, uncertainty, and the desire for social comparison among nurses. Journal of Applied Social Psychology, 24(19), 1701–1718. https://doi.org/10.1111/j.1559-1816.1994.tb01570.x
Buunk, B. P., Ybema, J. F., Gibbons, F. X., & Ipenburg, M. (2001). The affective consequences of social comparison as related to professional burnout and social comparison orientation. European Journal of Social Psychology, 31(4), 337–351. https://doi.org/10.1002/ejsp.41
Campbell, E. M., Liao, H., Chuang, A., Zhou, J., & Dong, Y. (2017). Hot shots and cool reception? An expanded view of social consequences for high performers. Journal of Applied Psychology, 102(5), 845–866. https://doi.org/10.1037/apl0000183
Carleton, R. N. (2012). The intolerance of uncertainty construct in the context of anxiety disorders: Theoretical and practical perspectives. Expert Review of Neurotherapeutics, 12(8), 937–947. https://doi.org/10.1586/ern.12.82
Carleton, R. N. (2016). Into the unknown: A review and synthesis of contemporary models involving uncertainty. Journal of Anxiety Disorders, 39, 30–43. https://doi.org/10.1016/j.janxdis.2016.02.007
Carleton, R. N., Norton, M. P. J., & Asmundson, G. J. (2007). Fearing the unknown: A short version of the Intolerance of Uncertainty Scale. Journal of Anxiety Disorders, 21(1), 105–117. https://doi.org/10.1016/j.janxdis.2006.03.014
Chen, F. F. (2007). Sensitivity of goodness of fit indexes to lack of measurement invariance. Structural Equation Modeling: A Multidisciplinary Journal, 14(3), 464–504. https://doi.org/10.1080/10705510701301834
Chen, J. T., & Lovibond, P. F. (2015). Intolerance of uncertainty is associated with increased threat appraisal and negative affect under ambiguity but not uncertainty. Behavior Therapy, 47(1), 42–53. https://doi.org/10.1016/j.beth.2015.09.004
Chou, H. T. G., & Edge, N. (2012). “They are happier and having better lives than I am”: The impact of using Facebook on perceptions of others’ lives. Cyberpsychology, Behavior, and Social Networking, 15(2), 117–121. https://doi.org/10.1089/cyber.2011.0324
Collins, R. L. (1996). For better or worse: The impact of upward social comparison on self-evaluations. Psychological Bulletin, 119(1), 51–69. https://doi.org/10.1037/0033-2909.119.1.51
Dijkstra, P., Kuyper, H., Van der Werf, G., Buunk, A. P., & van der Zee, Y. G. (2008). Social comparison in the classroom: A review. Review of Educational Research, 78(4), 828–879. https://doi.org/10.3102/0034654308321210
Elembilassery, V., Jain, N. K., & Aggarwal, D. (2023). What influences individuals’ tolerance for ambiguity? Exploring the role of social comparison orientation, tendency to maximize and feel regret. Personality and Individual Differences, 217, Article 112436. https://doi.org/10.1016/j.paid.2023.112436
Erikson, E. H. (1959). Identity and the life cycle: Selected papers. Psychological Issues, 1, 1–171.
Faul, F., Erdfelder, E., Lang, A. G., & Buchner, A. (2007). G*Power 3: A flexible statistical power analysis program for the social, behavioral, and biomedical sciences. Behavior Research Methods, 39(2), 175–191. https://doi.org/10.3758/BF03193146
Festinger, L. (1954). A theory of social comparison processes. Human Relations, 7(2), 117–140. https://doi.org/10.1177/001872675400700202
Freeston, M., Tiplady, A., Mawn, L., Bottesi, G., & Thwaites, S. (2020). Towards a model of uncertainty distress in the context of Coronavirus (COVID-19). The Cognitive Behaviour Therapist, 13, Article e31. https://doi.org/10.1017/s1754470x2000029x
Fuller, C. M., Simmering, M. J., Atinc, G., Atinc, Y., & Babin, B. J. (2016). Common methods variance detection in business research. Journal of Business Research, 69(8), 3192–3198. https://doi.org/10.1016/j.jbusres.2015.12.008
Fusar-Poli, P. (2019). Integrated mental health services for the developmental period (0 to 25 years): A critical review of the evidence. Frontiers in Psychiatry, 10, Article 355. https://doi.org/10.3389/fpsyt.2019.00355
Gerber, J. P., Wheeler, L., & Suls, J. (2018). A social comparison theory meta-analysis 60+ years on. Psychological Bulletin, 144(2), 177–197. https://doi.org/10.1037/bul0000127
Gibbons, F. X., & Buunk, B. P. (1999). Individual differences in social comparison: Development of a scale of social comparison orientation. Journal of Personality and Social Psychology, 76(1), 129–142. https://doi.org/10.1037/0022-3514.76.1.129
Guimond, S., Branscombe, N. R., Brunot, S., Buunk, A. P., Chatard, A., Désert, M., Garcia, D. M., Haque, S., Martinot, D., & Yzerbyt, V. (2007). Culture, gender, and the self: Variations and impact of social comparison processes. Journal of Personality and Social Psychology, 92(6), 1118–1134. https://doi.org/10.1037/0022-3514.92.6.1118
Heckhausen, J., & Krueger, J. (1993). Developmental expectations for the self and most other people: Age grading in three functions of social comparison. Developmental Psychology, 29(3), 539–548. https://doi.org/10.1037/0012-1649.29.3.539
Ho, H., & Ito, K. (2019). Consumption-oriented engagement in social network sites. European Journal of Marketing, 53(7), 1355–1377. https://doi.org/10.1108/ejm-11-2017-0809
Iannattone, S., Spaggiari, S., Di Riso, D., & Bottesi, G. (2024). Profiles of intolerance of uncertainty, separation anxiety, and negative affectivity in emerging adulthood: A person-centered approach. Journal of Affective Disorders, 345, 51–58. https://doi.org/10.1016/j.jad.2023.10.108
Insel, T. R., & Fenton, W. S. (2005). Psychiatric epidemiology. Archives of General Psychiatry, 62(6), 590–592. https://doi.org/10.1001/archpsyc.62.6.590
Kilic, Z., McKone, K. M. P., Stout, C. D., Grad-Freilich, M. J., Ladouceur, C. D., Choukas-Bradley, S., & Silk, J. S. (2024). Overthinking over screens: Girls ruminate more after negative social media interactions with peers compared to in-person interactions. Affective Science, 5(4), 427–435. https://doi.org/10.1007/s42761-024-00258-w
Kwok, C. Y. N. (2018). Managing uncertainty in the career development of emerging adults: Implications for undergraduate students. Australian Journal of Career Development, 27(3), 137–149. https://doi.org/10.1177/1038416217744216
Lee, S. Y. (2014). How do people compare themselves with others on social network sites? The case of Facebook. Computers in Human Behavior, 32, 253–260. https://doi.org/10.1016/j.chb.2013.12.009
Leite, C., & Kuiper, N. A. (2008). Client uncertainty and the process of change in psychotherapy: The impact of individual differences in self-concept clarity and intolerance of uncertainty. Journal of Contemporary Psychotherapy, 38(2), 55–64. https://doi.org/10.1007/s10879-007-9068-7
Li, T., & Xu, H. (2022). 大学生自我概念清晰性与社交焦虑的关系:多重中介效应分析 [Self-concept clarity and social anxiety: Analysis of the multiple mediating effects]. Studies of Psychology and Behavior, 20(5), 700–706. https://doi.org/10.12139/j.1672-0628.2022.05.018
Little, R. J. A. (1988). A test of missing completely at random for multivariate data with missing values. Journal of the American Statistical Association, 83(404), 1198–1202. https://doi.org/10.1080/01621459.1988.10478722
Little, R. J. A., & Rubin, D. B. (2002). Statistical analysis with missing data. Wiley. https://doi.org/10.1002/9781119013563
Liu, Q., Niu, G., Fan, C., & Zhou, Z. (2017). 被动性社交网站使用与自尊和自我概念清晰性:有调节的中介模型 [Passive use of social network site and its relationships with self-esteem and self-concept clarity: A moderated mediation analysis]. Acta Psychologica Sinica, 49(1), 60–71. https://doi.org/10.3724/SP.J.1041.2017.00060
McGregor, I., Prentice, M., & Nash, K. (2009). Personal uncertainty management by reactive approach motivation. Psychological Inquiry, 20(4), 225–229. https://doi.org/10.1080/10478400903333460
McGregor, I., Zanna, M. P., Holmes, J. G., & Spencer, S. J. (2001). Compensatory conviction in the face of personal uncertainty: Going to extremes and being oneself. Journal of Personality and Social Psychology, 80(3), 472–488. https://doi.org/10.1037/0022-3514.80.3.472
Michikyan, M., & Subrahmanyam, K. (2012). Social networking sites: Implications for youth. In Encyclopedia of cyber behavior (pp. 132–147). IGI Global. https://doi.org/10.4018/978-1-4666-0315-8.ch011
Nekić, M. (2023). How anxious and stressed are emerging adults? The role of mindfulness and intolerance of uncertainty. Psych, 5(4), 1019–1029. https://doi.org/10.3390/psych5040068
Nesi, J., & Prinstein, M. J. (2015). Using social media for social comparison and feedback-seeking: Gender and popularity moderate associations with depressive symptoms. Journal of Abnormal Child Psychology, 43(8), 1427–1438. https://doi.org/10.1007/s10802-015-0020-0
Niu, G. F., Sun, X. J., Zhou, Z. K., Kong, F. C., & Tian, Y. (2016). 基于QQ空间的社交网站使用对青少年抑郁的影响:上行社会比较和自尊的序列中介作用 [The impact of social network site (Qzone) on adolescents’ depression: The serial mediation of upward social comparison and self-esteem]. Acta Psychologica Sinica, 48(10), 1282–1291. https://doi.org/10.3724/SP.J.1041.2016.01282
Niu, G. F., Sun, X. J., Zhou, Z. K., Tian, Y., Liu, Q. Q., & Lian, S. L. (2016). 青少年社交网站使用对自我概念清晰性的影响:社会比较的中介作用 [The effect of adolescents’ social networking site use on self-concept clarity: The mediating role of social comparison]. Journal of Psychological Science, 39(1), 97–102. https://doi.org/10.16719/j.cnki.1671-6981.20160115
Noon, E. J., Vranken, I., & Schreurs, L. (2022). Age matters? The moderating effect of age on the longitudinal relationship between upward and downward comparisons on Instagram and identity processes during emerging adulthood. Emerging Adulthood, 11(2), 288–302. https://doi.org/10.1177/21676968221098293
Orth, U., Clark, D. A., Donnellan, M. B., & Robins, R. W. (2021). Testing prospective effects in longitudinal research: Comparing seven competing cross-lagged models. Journal of Personality and Social Psychology, 120(4), 1013–1034. https://doi.org/10.1037/pspp0000358
Orth, U., Meier, L. L., Bühler, J. L., Dapp, L. C., Krauss, S., Messerli, D., & Robins, R. W. (2024). Effect size guidelines for cross-lagged effects. Psychological Methods, 29(2), 421–433. https://doi.org/10.1037/met0000499
Pang, H. (2020). Unraveling the influence of passive and active WeChat interactions on upward social comparison and negative psychological consequences among university students. Telematics and Informatics, 57, Article 101510. https://doi.org/10.1016/j.tele.2020.101510
Perrino, T., Mason, C. A., Brown, S. C., & Szapocznik, J. (2010). The relationship between depressive symptoms and walking among Hispanic older adults: A longitudinal, cross-lagged panel analysis. Aging & Mental Health, 14(2), 211–219. https://doi.org/10.1080/13607860903191374
Putnick, D. L., & Bornstein, M. H. (2016). Measurement invariance conventions and reporting: The state of the art and future directions for psychological research. Developmental Review, 41, 71–90. https://doi.org/10.1016/j.dr.2016.06.004
Schmuck, D., Karsay, K., Matthes, J., & Stević, A. (2019). “Looking up and feeling down”. The influence of mobile social networking site use on upward social comparison, self-esteem, and well-being of adult smartphone users. Telematics and Informatics, 42, Article 101240. https://doi.org/10.1016/j.tele.2019.101240
Steiger, J. H. (1990). Structural model evaluation and modification: An interval estimation approach. Multivariate Behavioral Research, 25(2), 173–180. https://doi.org/10.1207/s15327906mbr2502_4
Stone, J. K., Shafer, L. A., Graff, L. A., Witges, K., Sexton, K., Lix, L. M., Haviva, C., Targownik, L. E., & Bernstein, C. N. (2022). The association of efficacy, optimism, uncertainty and health anxiety with inflammatory bowel disease activity. Journal of Psychosomatic Research, 154, Article 110719. https://doi.org/10.1016/j.jpsychores.2022.110719
Subrahmanyam, K., Reich, S. M., Waechter, N., & Espinoza, G. (2008). Online and offline social networks: Use of social networking sites by emerging adults. Journal of Applied Developmental Psychology, 29(6), 420–433. https://doi.org/10.1016/j.appdev.2008.07.003
Tencent (2024). 腾讯二零二四年第二季业绩报告 [Tencent’s 2024 First Quarter Performance Report]. https://www.tencent.com/en-us/investors/financial-news.html
Tiggemann, M., & Slater, A. (2013). NetGirls: The internet, Facebook, and body image concern in adolescent girls. International Journal of Eating Disorders, 46(6), 630–633. https://doi.org/10.1002/eat.22141
Vogel, E. A., Rose, J. P., Roberts, L. R., & Eckles, K. (2014). Social comparison, social media, and self-esteem. Psychology of Popular Media Culture, 3(4), 206–222. https://doi.org/10.1037/ppm0000047
Wheeler, L. (1966). Motivation as a determinant of upward comparison. Journal of Experimental Social Psychology, 1, 27–31. https://doi.org/10.1016/0022-1031(66)90062-X
Yang, Q., Bi, C., Li, L., & Huang, X. (2017). 自我不确定感:内涵、结构和理论 [Self-uncertainty: Concepts, structures, and theories]. Advances in Psychological Science, 25(6), 1012–1024. https://doi.org/10.3724/SP.J.1042.2017.01012
Yang, Q., Ybarra, O., Van Den Bos, K., Zhao, Y., Guan, L., Cao, Y., Li, F., & Huang, X. (2019). Neurophysiological and behavioral evidence that self-uncertainty salience increases self-esteem striving. Biological Psychology, 143, 62–73. https://doi.org/10.1016/j.biopsycho.2019.02.011
Yeler, Z., Berber, K., Özdoğan, H. K., & Çok, F. (2021). Quarter life crisis among emerging adults in Turkey and its relationship with intolerance of uncertainty. Turkish Psychological Counseling and Guidance Journal, 11(61), 245–262. https://dergipark.org.tr/en/pub/tpdrd/issue/63470/960767
Zhang, Y. J., Song, J. B., Gao, Y. T., Wu, S. J., Song, L., & Miao, D. M. (2017). 无法忍受不确定性量表(简版)在中国大学生中的信效度检验 [Reliability and validity of the intolerance of uncertainty scale-short form in university students]. Chinese Journal of Clinical Psychology, 25(2), 285–288. https://doi.org/10.16128/j.cnki.1005-3611.2017.02.020
Zhao, Q., Wichman, A. L., & Frishberg, E. (2019). Self-doubt effects depend on beliefs about ability: Experimental evidence. The Journal of General Psychology, 146(3), 299–324. https://doi.org/10.1080/00221309.2019.1585320
Authors’ Contribution
Qing Yang: conceptualization, writing—original draft, writing—review & editing, project administration, funding acquisition. Xinhui Qiu: conceptualization, investigation, formal analysis, writing—original draft, writing—review & editing. Yicheng Wang: writing—review & editing. Miao Lv: writing—review & editing.
Editorial Record
First submission received:
June 20, 2024
Revision received:
April 28, 2025
Accepted for publication:
June 4, 2025
Editor in charge:
Alexander P. Schouten
Introduction
The contemporary world undergoes constant change, engendering pervasive uncertainty in individuals’ daily existence. When faced with uncertain situations, individuals display consistent differences in cognition, emotions, and behavioral tendencies, denoted as intolerance of uncertainty (IU; Carleton, 2016). While uncertainty can occur at various life stages, emerging adulthood (around 18–26 years) may be uniquely characterized by such experiences (Iannattone et al., 2024). During this transitional phase, individuals face multifaceted sources of uncertainty, such as the instability of self-identity, the unpredictable ebb and flow of career progression, and the ongoing development of social networks (Arnett, 2004; Becht et al., 2021; Kwok, 2018). The complex interplay of these challenges heightens their vulnerability to distress when navigating ambiguous or uncertain circumstances. Previous research found that emerging adults exhibit higher levels of IU, which decline progressively with age (Yeler et al., 2021). Individuals with higher IU often experience distress when confronted with uncertainty. They tend to perceive ambiguous situations as threats and exhibit increased physiological arousal (Carleton, 2012), thereby predisposing them to anxiety-related mental disorders. Concerningly, young people are at heightened risk of developing mental disorders, with approximately 75% of such conditions emerging by age 24, and prodromal symptoms often appearing even earlier (Fusar-Poli, 2019). Consequently, mental disorders have often been called “the chronic diseases of the young”, and adolescence and emerging adulthood are pivotal periods for the onset and development of mental health problems (Insel & Fenton, 2005; Nekić, 2023). Compared to extensive research on IU during adolescence, studies focusing on emerging adults remain relatively scarce, presenting comparatively greater scope for exploration (Iannattone et al., 2024).
IU reflects a dispositional tendency to perceive uncertainty as inherently stressful and threatening (Carleton, 2012). To alleviate feelings of uncertainty, individuals often compare themselves with others to gain a sense of stability and clarity (Campbell et al., 2017; Festinger, 1954). Social Comparison Theory (SCT; Festinger, 1954) posits that individuals rely on objective standards to achieve a precise and comprehensive understanding and evaluation of themselves. Yet, in contexts where objective criteria are absent, individuals tend to evaluate their situation by comparing it to others. Social comparisons can be classified into three categories based on comparison targets (Dijkstra et al., 2008): upward social comparison (i.e., comparing oneself with others perceived as superior or more influential), downward social comparison (i.e., comparing oneself with others perceived as worse off or less influential), and lateral social comparison (i.e., comparing oneself with others in similar situations or statuses). Individuals with high IU exhibit heightened sensitivity to informational ambiguity (J. T. Chen & Lovibond, 2015), leading to increased engagement in social comparisons as a compensatory coping mechanism (Elembilassery et al., 2023). This aligns with the perspective of Buunk et al. (2001), who posited that uncertain or ambiguous situations, as well as those generating stress, tend to enhance the need for social comparison. At pivotal transitions within their life journey, emerging adults frequently experience a diminished sense of perceived control over their lives and ambiguity about their future direction (Arnett, 2004). Driven by this uncertainty, they may increasingly rely on social comparisons to assess their social standing and gauge their value (Lee, 2014).
With the widespread adoption of smartphones and the internet, social networking sites (SNSs) have become an integral part of people’s daily lives (Subrahmanyam et al., 2008). Taking WeChat as an example, as one of China’s most popular SNS platforms, it had a staggering 1.359 billion monthly active users, with 30% aged 18–26 (Tencent, 2024). Extensive research shows that individuals in this age group dedicate significant time to SNSs, engaging in activities such as browsing content, interacting with peers, and sharing personal updates (Michikyan & Subrahmanyam, 2012). Recent research in digital environments highlights that SNSs amplify social comparison by three key mechanisms absent in non-SNS contexts, evolving into significant arenas where individuals engage in social comparison (Lee, 2014). First, most users tend to share positive content, which is carefully curated and embellished on SNS, while selectively concealing negative aspects about themselves, which often contrasts sharply with the more authentic but fragmented interactions in face-to-face settings (Vogel et al., 2014). Second, SNSs enhance the salience of peers’ successes via interactive mechanisms such as “likes” and real-time content sharing (Lee, 2014). Third, unlike real-time offline interactions, SNS users can repeatedly revisit and ruminate on others’ posts (Kilic et al., 2024). These features make others’ curated achievements obvious and systematically reinforced, amplifying the psychological impact of social comparison processes. Hence, individuals are inclined to engage in more upward social comparisons when they encounter positive content others share on SNS (Vogel et al., 2014).
Buunk et al. (1994) introduced the self-improvement hypothesis to explore the relationship between uncertainty and upward social comparison. This hypothesis posits that competitive or uncertain environments generate heightened psychological stress, which prompts individuals’ desire to learn from others, and motivating self-improvement endeavors, thereby fostering a greater inclination toward engaging in upward social comparison. In particular, during the challenging and uncertain period of emerging adulthood, individuals tend to rely on upward social comparison to gauge their differences against others. This process enables them to clarify themselves and motivate self-growth and progress accordingly (Heckhausen & Krueger, 1993). Empirical evidence in non-SNS contexts supports this relationship, demonstrating a positive correlation between IU and upward social comparison (Butzer & Kuiper, 2006). However, this research remains limited to general upward social comparison, relying on a cross-sectional design, which does not offer insights into the temporal sequence of predictive relationships between IU and upward social comparison in the SNS context.
To further explore the predictive role of IU in upward social comparison on SNS among emerging adults, and to establish a more robust theoretical foundation based on the existing evidence, we formulate the first hypothesis:
H1: IU may positively predict upward social comparison on SNS among emerging adults.
Despite people’s natural tendency to rely on social comparison for certainty in the face of uncertainty, upward social comparisons on SNS may potentially backfire, exacerbating intolerance of uncertainty. When individuals frequently browse positive personal information presented by others on SNS to uphold a positive self-image, they may develop a misleading perception that others have superior and happier lives (Vogel et al., 2014). This illusion can lead individuals to feel dissatisfied with their living conditions, body shape, and more, perceiving themselves as inferior compared to others (Arroyo, 2014; Chou & Edge, 2012). Consequently, frequently upward social comparisons on SNS may inadvertently cause individuals to fixate excessively on their perceived shortcomings. Such a focus may hinder identity development (Noon et al., 2022), a central developmental task during emerging adulthood (Arnett, 2000; Erikson, 1959). Particularly in this developmental stage, an excessive focus on the differences between themselves and their peers, coupled with a belief that they cannot match the achievements of others, can lead to significantly negative self-perceptions (Ho & Ito, 2019). For example, studies have found that the inclination for upward social comparison was negatively associated with individuals’ self-evaluation (Collins, 1996; Gerber et al., 2018), self-esteem (Vogel et al., 2014), self-efficacy (Tiggemann & Slater, 2013), and self-concept clarity (e.g., Butzer & Kuiper, 2006; Liu et al., 2017; Niu, Sun, Zhou, Tian, et al., 2016).
Importantly, these self-related factors were found to be closely associated with IU. Previous research has suggested that self-esteem can serve as a protective factor, enabling individuals to cope effectively with uncertainty. In this context, higher self-esteem promotes greater tolerance for uncertain information and facilitates effective uncertainty management (Yang et al., 2019). Similarly, individuals with high self-efficacy maintain positive attitudes about their abilities, enabling them to tackle challenges and uncertainties in the future (Stone et al., 2022). Moreover, high self-concept clarity allows for a clear self-understanding, fostering confidence and adaptability in uncertain situations (e.g., Leite & Kuiper, 2008; Li & Xu, 2022). Based on this, one can infer that upward social comparison may significantly influence individuals’ core self-evaluation, subsequently impacting their tolerance of uncertainty. However, there is currently insufficient direct evidence to support the predictive effect of upward social comparison on IU. We then propose our second hypothesis:
H2: Upward social comparison on SNS may positively predict IU among emerging adults.
In light of the multifaceted stressors and uncertainties inherent in emerging adulthood, coupled with the widespread phenomenon of social comparison on SNS, it is necessary to explore the relationship between IU and upward social comparison on SNS among emerging adults. However, existing studies have predominantly relied on cross-sectional designs, leaving the association between the variables not fully elucidated. Hence, this study aims to unveil their reciprocal relationship and directionality using a three-wave longitudinal dataset. The findings of this study may hold practical implications for young social media users, aiding them in reducing unhealthy social comparison behaviors within digital social environments. Additionally, it may enhance the comprehension and management of uncertainty, thereby reducing anxiety and stress and promoting emotional stability and health.
Methods
Participants and Procedure
We utilized convenience sampling to conduct a three-wave, ten-month longitudinal study among university students from eastern China. Given the mobile nature of university undergraduate students (e.g., engaged in internships or exchange programs), this study employed the online survey platform (https://www.wjx.cn/) for data collection. We conducted a priori power analysis using G*Power to determine the minimum required sample size was estimated to be 255 (α = .05, power = .90; Faul et al., 2007), with a conservative bivariate correlation (r = .20). Considering the potential for data loss due to multiple tracking surveys, a larger sample size was targeted. In the initial time (T1; May–June 2022), 1,017 students participated, with 90 cases excluded due to excessively short response times, resulting in 927 valid responses. For the second time (T2; October–November 2022), 609 students participated, yielding an effective response rate of 62%. After excluding participants who failed attention tests, we retained 572 valid responses. The third time (T3; February–March 2023) included 488 students, with 460 participants retained after eliminating data with failed attention tests, achieving an effective response rate of 78%. Participants received a cash reward of 5–7 yuan for each completed survey. At T1, the participants’ ages ranged from 17 to 23 years (M = 19.24, SD = 1.05), with 41 male and 419 female participants. With regard to grade composition, the participants are comprised of 343 freshmen, 91 sophomores, 6 juniors, and 20 seniors. This study received approval from the University’s Ethics Committee, and all participants provided informed consent. This survey was part of a larger project, with only measures relevant to the present research topic reported.
Measures
Intolerance of Uncertainty
The Intolerance of Uncertainty Scale (IUS-12), originally developed by Carleton et al. (2007) and later translated into Chinese by Zhang et al. (2017), was utilized in this study. The scale consists of 12 items measuring two dimensions: prospective anxiety (e.g., Unforeseen events upset me greatly) and inhibitory anxiety (e.g., Uncertainty keeps me from living a full life). Participants rated their responses on a 5-point Likert scale ranging from 1 (not at all characteristic of me) to 5 (entirely characteristic of me). The mean score is derived by summing all item scores and dividing by the number of items, with higher mean scores denoting increased intolerance of uncertainty. Reliability was estimated as internal consistency (McDonald’s ω) and was adequate in the present study: ωT1 = .81, ωT2 = .85, and ωT3 = .90. Moreover, confirmatory factor analyses (CFA) of the revised model, which incorporated theoretically justified modifications (e.g., allowing correlated residuals), demonstrated acceptable fit across three time points. The fit indices were as follows: χ2/df = 3.579–4.196, CFI = .900–.920, TLI = .866–.898, RMSEA = .075–.083, SRMR = .051–.065.
Upward Social Comparison on SNS
The Upward Comparison Subscale was derived from the Iowa-Netherlands Comparison Orientation Measure (INCOM), initially adapted by Gibbons and Buunk (1999) and subsequently translated into Chinese by Bai et al. (2013). Building on revisions by Niu, Sun, Zhou, Kong, & Tian (2016), the response options were specifically tailored to focus on social comparison within the domain of social networking sites (such as QQ Space or WeChat Moments) for this study. This scale has 6 items (e.g., On social networking sites, I often compare myself to people who are more successful than me), scored on a 5-point Likert scale ranging from 1 (strongly disagree) to 5 (strongly agree). A higher mean score indicates a stronger inclination for upward social comparison on SNS. Throughout this study, the scale showed good reliability (ωT1 = .91, ωT2 = .91, and ωT3 = .92). Furthermore, CFA revealed that the revised model fitted the data across three time points (χ2/df = 1.615–3.910, CFI = .976–.998, TLI = .955–.995, RMSEA = .037–.080, SRMR = .014–.027).
Statistical Analysis
We used SPSS 25.0 for data organization, common method bias analysis, descriptive statistics, and correlation analysis. During data processing, we used Little’s Missing Completely at Random (MCAR) test to evaluate all variables across the three measured time points (Little, 1988). The results indicated that the missing data were characterized by a completely random distribution, χ2 = 43.17, df = 42, p = .421. Then, we applied the maximum likelihood estimation method (EM algorithm) to appropriately impute missing values and effectively utilize the available data (Little & Rubin, 2002). Next, we employed MPLUS 7.4.0 to assess longitudinal measurement invariance for IU and upward social comparison on SNS across points, ensuring that these variables maintained the same meaning at different time points (Putnick & Bornstein, 2016). We sequentially tested and compared three nested invariance models: configural invariance, metric invariance, and scalar invariance. The nested longitudinal invariance models were evaluated based on the recommendations of F. F. Chen (2007), which suggest that a change in CFI (ΔCFI) of less than .01, a change in RMSEA (ΔRMSEA) of less than .015, or a change in SRMR (ΔSRMR) of less than .030 would indicate invariance across time.
Finally, to explore the between-person variance, we utilized MPLUS to construct a cross-lagged panel model (CLPM), which assesses the predictive influence of individual differences in one trait on the alterations in individual differences of another trait (Orth et al., 2021). Specifically, we employed this model to investigate the bidirectional relationship between IU and upward social comparison on SNS (see Figure 1). Our study employed this model to test the prospective impact of individual differences in IU on changes in individual differences in upward social comparison (or the reverse). To address our research questions, we constructed five models as follows. Model 1 (with autoregression effects and correlations between IU and upward social comparison at the same time point) was established to test the stability of the variables at three time points. In addition to examining lag-one autocorrelation effects between IU and upward social comparison, we incorporated lag-two autocorrelation effects to capture potential cyclical patterns in these relationships better and distinguish between short-term versus prolonged temporal dynamics (cf. Perrino et al., 2010). This consisted of a path from T1 IU to T3 IU and from T1 upward social comparison to T3 upward social comparison. Model 2 (only cross-lagged effect of IU on upward social comparison with autoregression effects and correlations between factors at the same time point), Model 3 (only cross-lagged effect of upward social comparison on IU with autoregression effects and correlations between factors at the same time point), and Model 4 (with all cross-lagged effects, autoregression effects and correlations between factors at the same time point) were created to test whether there were reciprocal relationships between the variables. Model 5 (with all cross-lagged effects, autoregression effects, and correlations between factors at the same time point for female participants only) was designed to reduce the confounding effect of gender on the relationships between variables. To enhance the reliability and robustness of our research findings, this study included age, gender, and socioeconomic status (SES) at T1 as covariates in each model (except that gender was not included as a covariate in Model 5). To interpret the size of cross-lagged effects for the CLPM, we used the standardized cross-lagged path coefficients of .03 (small effect), .07 (medium effect), and .12 (large effect) as benchmark values (Orth et al., 2024).
Figure 1. The Conceptual Model of Intolerance of Uncertainty and
Upward Social Comparison on SNS.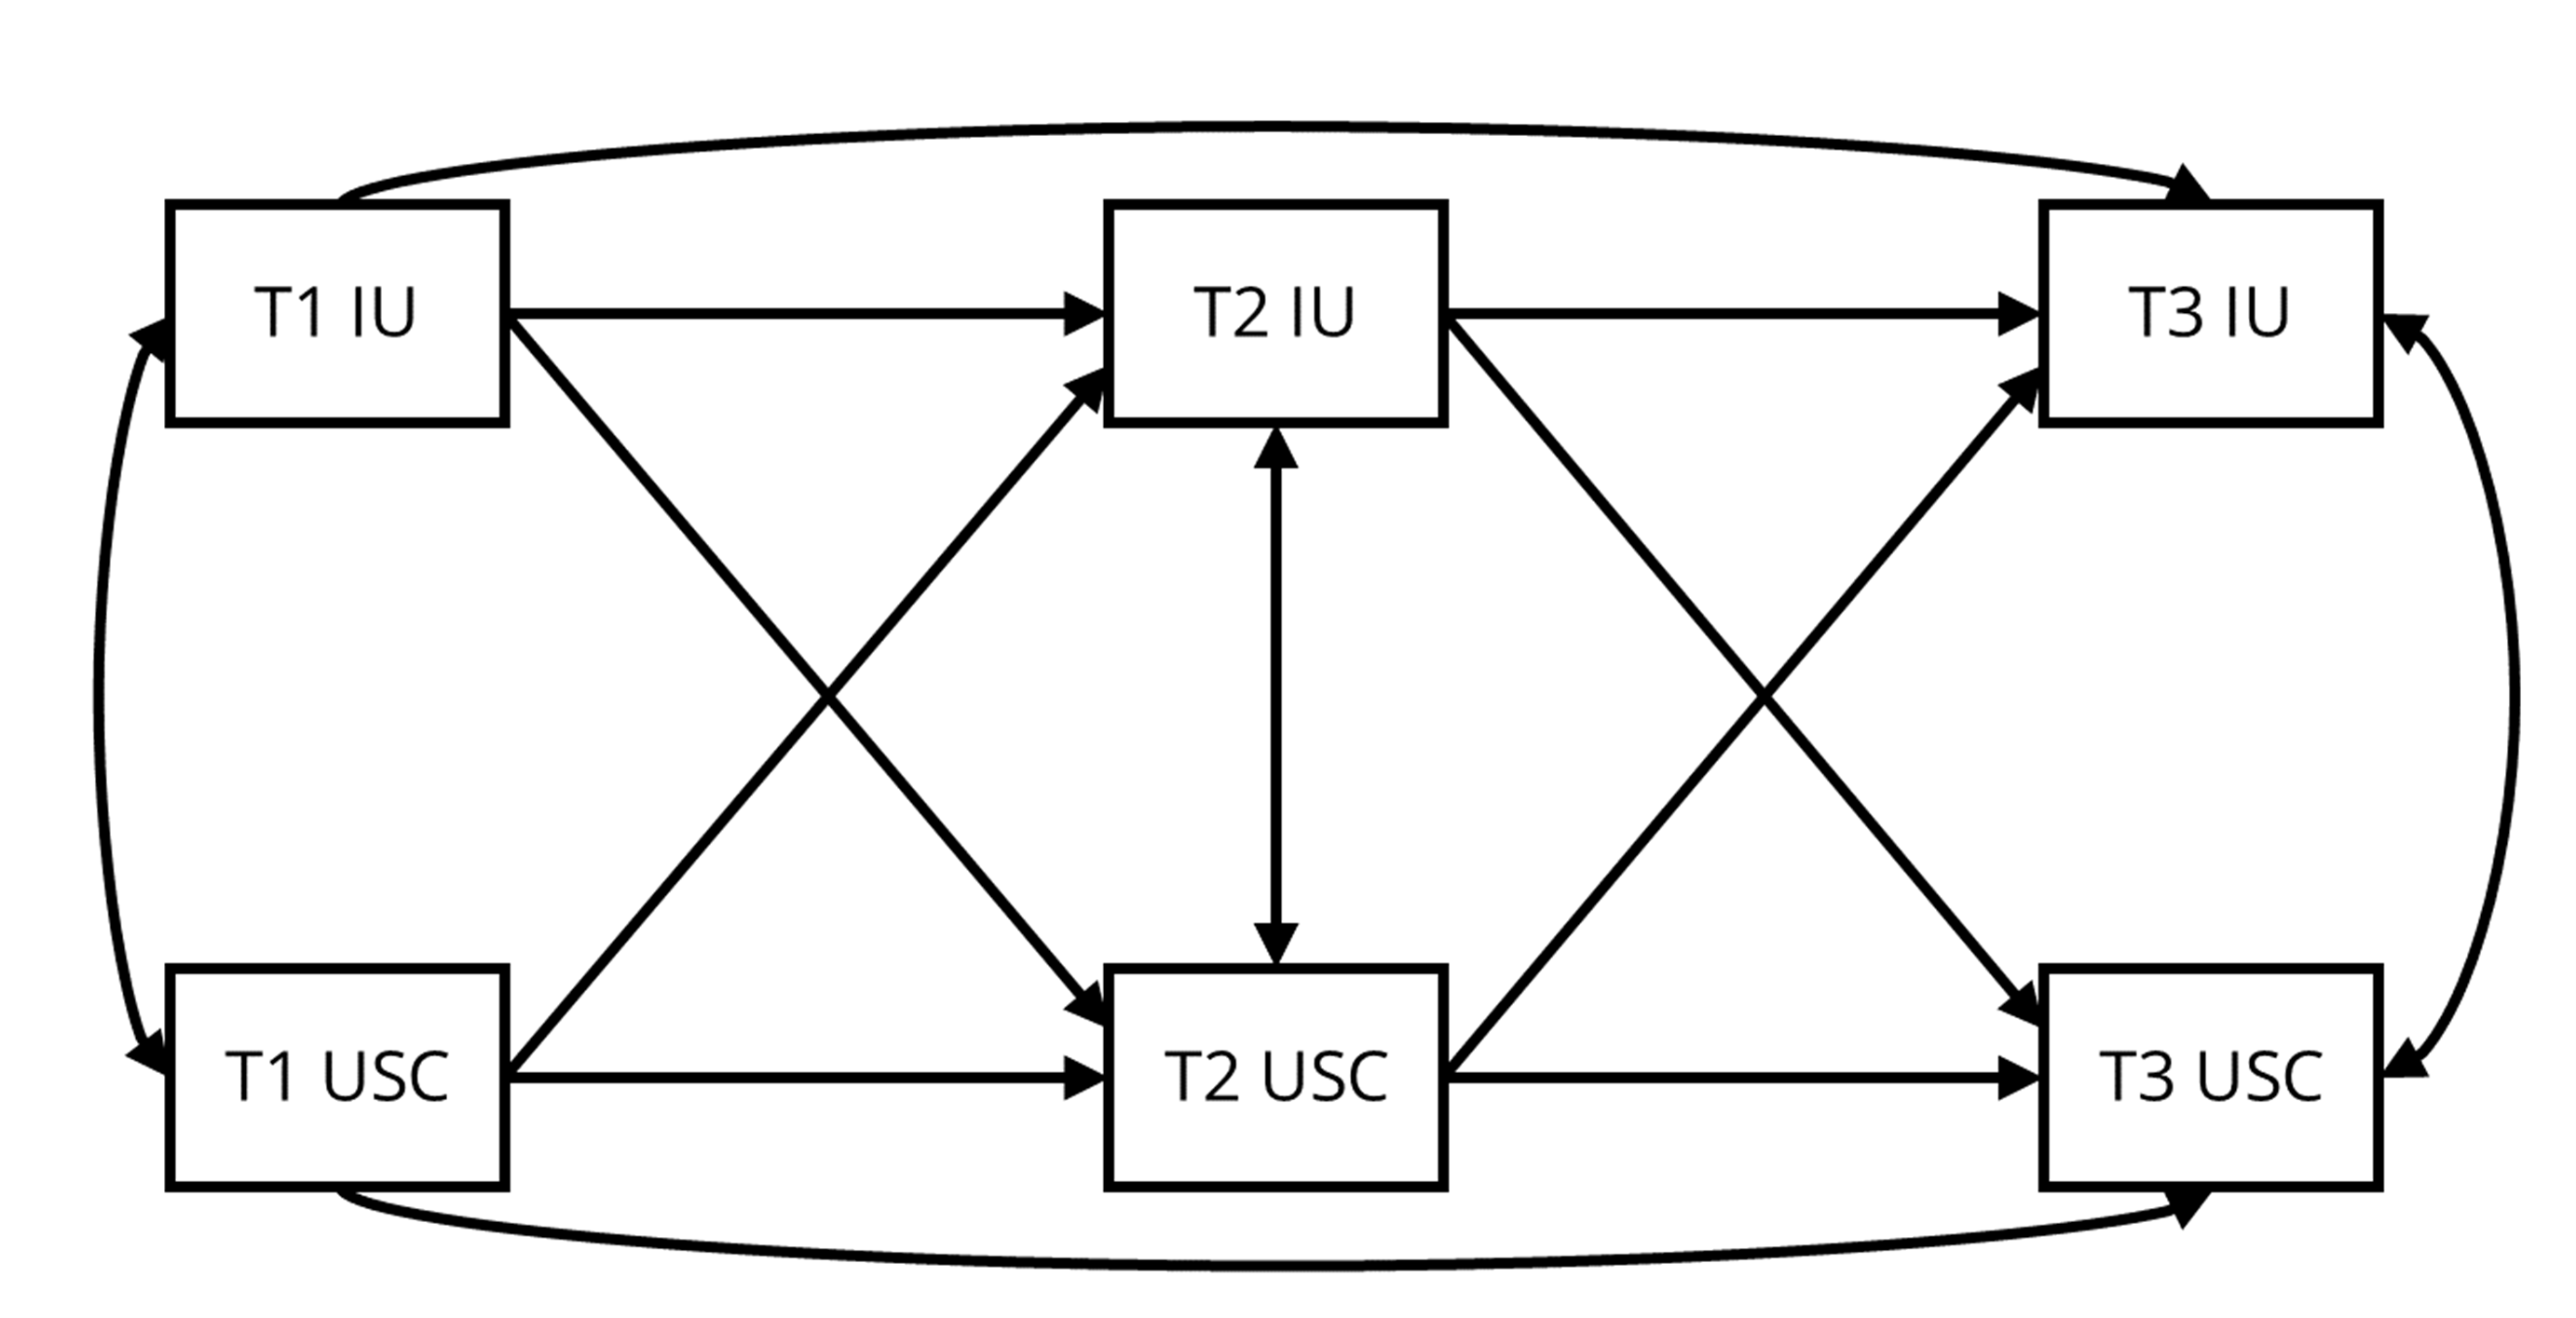
Note. IU = intolerance of uncertainty. USC = upward social comparison on SNS.
T1: Time 1, T2: Time 2, T3: Time 3. The same after.
Results
Common Method Bias Test
Harman’s single-factor test was utilized to examine common method bias in the data at three different times (Fuller et al., 2016). The results indicated that, at T1, T2, and T3, there were 4, 3, and 3 factors with eigenvalues > 1. Additionally, the first factor accounted for 29.36%, 31.32%, and 38.23% of the variance, respectively (below the 40% threshold). These results suggest an absence of significant common method bias within the data.
Common Method Bias Test
Table 1 shows the means, standard deviations, and correlation coefficients of IU, upward social comparison on SNS, and demographic variables (age, gender and SES) across T1 to T3. We found significant positive correlations among the three time points regarding IU and upward social comparison on SNS (rs = .14 ~ .36, ps < .01). Additionally, gender exhibited a significant correlation with upward social comparison at T3 (r = .10, p = .036).
Table 1. Descriptive Statistics and Correlations Between Variables (N = 460).
|
Variables |
M (SD) |
1 |
2 |
3 |
4 |
5 |
6 |
7 |
8 |
9 |
|
1 Age |
19.24 (1.05) |
— |
|
|
|
|
|
|
|
|
|
2 Gender |
1.91 (0.29) |
−.02 |
— |
|
|
|
|
|
|
|
|
3 SES |
0.00 (1.72) |
−.09 |
−.01 |
— |
|
|
|
|
|
|
|
4 T1 IU |
3.12 (0.55) |
−.02 |
−.07 |
−.00 |
— |
|
|
|
|
|
|
5 T2 IU |
3.19 (0.53) |
−.02 |
−.00 |
−.02 |
.57*** |
— |
|
|
|
|
|
6 T3 IU |
3.25 (0.65) |
.01 |
−.06 |
−.02 |
.58*** |
.70*** |
— |
|
|
|
|
7 T1 USC |
2.73 (0.92) |
−.03 |
.07 |
−.03 |
.22*** |
.28*** |
.22*** |
— |
|
|
|
8 T2 USC |
3.02 (0.87) |
.02 |
.08 |
.02 |
.14** |
.28*** |
.28*** |
.46*** |
— |
|
|
9 T3 USC |
3.06 (0.87) |
.03 |
.10* |
.02 |
.24*** |
.31*** |
.36*** |
.45*** |
.57** |
— |
|
Note. *p < .05, **p < .01, ***p < .001. M = mean; SD = standard deviation. Gender was coded as 1 = man, 2 = woman. Age, gender, and SES were measured at T1. The same after. |
||||||||||
Measurement Invariance Analysis
The model fit results for configural, metric and scalar invariance of the IU and upward social comparison are presented in Table 2. These findings demonstrated longitudinal measurement invariance across all assessments, indicating a consistent measurement of variables over time.
Table 2. Model Fit Indices for Alignment Measurement Invariance (N = 460).
|
Model specification |
Model fit measures |
Model differences |
|||||||
|
χ2(df) |
CFI |
TLI |
RMSEA |
SRMR |
Model comparison |
ΔCFI |
ΔRMSEA |
ΔSRMR |
|
|
IU |
|
|
|
|
|
|
|
|
|
|
Configural invariance |
1430.455 (555) |
.869 |
.852 |
.059 |
.069 |
|
|
|
|
|
Metric invariance |
1467.744 (577) |
.867 |
.855 |
.058 |
.074 |
Configural vs. Metric |
.002 |
.001 |
.005 |
|
Scalar invariance |
1535.696 (599) |
.860 |
.853 |
.058 |
.075 |
Metric vs. Scalar |
.007 |
<.001 |
.001 |
|
USC |
|
|
|
|
|
|
|
|
|
|
Configural invariance |
575.573 (114) |
.892 |
.855 |
.094 |
.049 |
|
|
|
|
|
Metric invariance |
599.544 (124) |
.888 |
.862 |
.091 |
.053 |
Configural vs. Metric |
.004 |
.003 |
.004 |
|
Scalar invariance |
627.569 (134) |
.884 |
.868 |
.089 |
.052 |
Metric vs. Scalar |
.004 |
.002 |
.001 |
Cross-Lagged Analysis of Intolerance of Uncertainty and Upward Social Comparison in the SNS Context
The autoregressive model (Model 1) demonstrates an acceptable fit (Steiger, 1990), with its parameter estimates detailed in Table 3. The outcomes of the autoregressive path analysis spanning from T1 to T2 and from T2 to T3 (see Figure 2 and Table 4) revealed standardized regression coefficients. These coefficients are between .257 and .570 for IU and between .243 and .437 for upward social comparison on SNS, signifying stability in both constructs.
Table 3. Cross-Lagged Panel Model Fit Index and Comparison for Different Models (N = 460).
|
Model |
Model fit measures |
Model differences |
|||||||
|
χ2(df) |
CFI |
TLI |
RMSEA |
SRMR |
Model comparison |
Δχ2(df) |
ΔCFI |
ΔRMSEA |
|
|
Model 1 |
45.328 (6) |
.958 |
.767 |
.119 |
.058 |
|
|
|
|
|
Model 2 |
30.838 (4) |
.971 |
.761 |
.121 |
.037 |
Model 4 vs. Model 2 |
25.939 (2)*** |
.026 |
.065 |
|
Model 3 |
18.005 (4) |
.985 |
.875 |
.087 |
.034 |
Model 4 vs. Model 3 |
13.106 (2)** |
.012 |
.031 |
|
Model 4 |
4.899 (2) |
.997 |
.948 |
.056 |
.009 |
|
|
|
|
|
Model 5 |
3.880 (2) |
.998 |
.969 |
.047 |
.010 |
|
|
|
|
|
Note. **p < .01, ***p < .001. |
|||||||||
Figure 2. The Cross-Lagged Analysis of Intolerance of Uncertainty and Upward Social Comparison on SNS: Model 1.

Note. Statistics are standardized regression coefficients. Covariate paths are omitted for model simplification.
The same after. **p < .01, ***p < .001.
Next, Table 3 presents the results of model comparisons among the three competing models (Models 2–4). Model 4 demonstrated better model fit compared to Models 2 and 3, indicating the optimal fit. The cross-lagged path analysis findings of Model 4 were consistent with Model 2 and Model 3 (see Figures 3–5 and Table 4), revealing the reciprocal relationships between variables. Specifically, the level of T2 IU significantly and positively predicted the level of T3 upward social comparison (β = .134, p = .001). However, the predictive effect of T1 IU on T2 upward social comparison was not statistically significant (β = .048, p = .255). In contrast, T1 upward social comparison on SNS positively predicted T2 IU (β = .156, p < .001). Correspondingly, T2 upward social comparison was also a positive predictor of T3 IU (β = .104, p = .002).
Figure 3. The Cross-Lagged Analysis of Intolerance of Uncertainty and Upward Social Comparison on SNS: Model 2.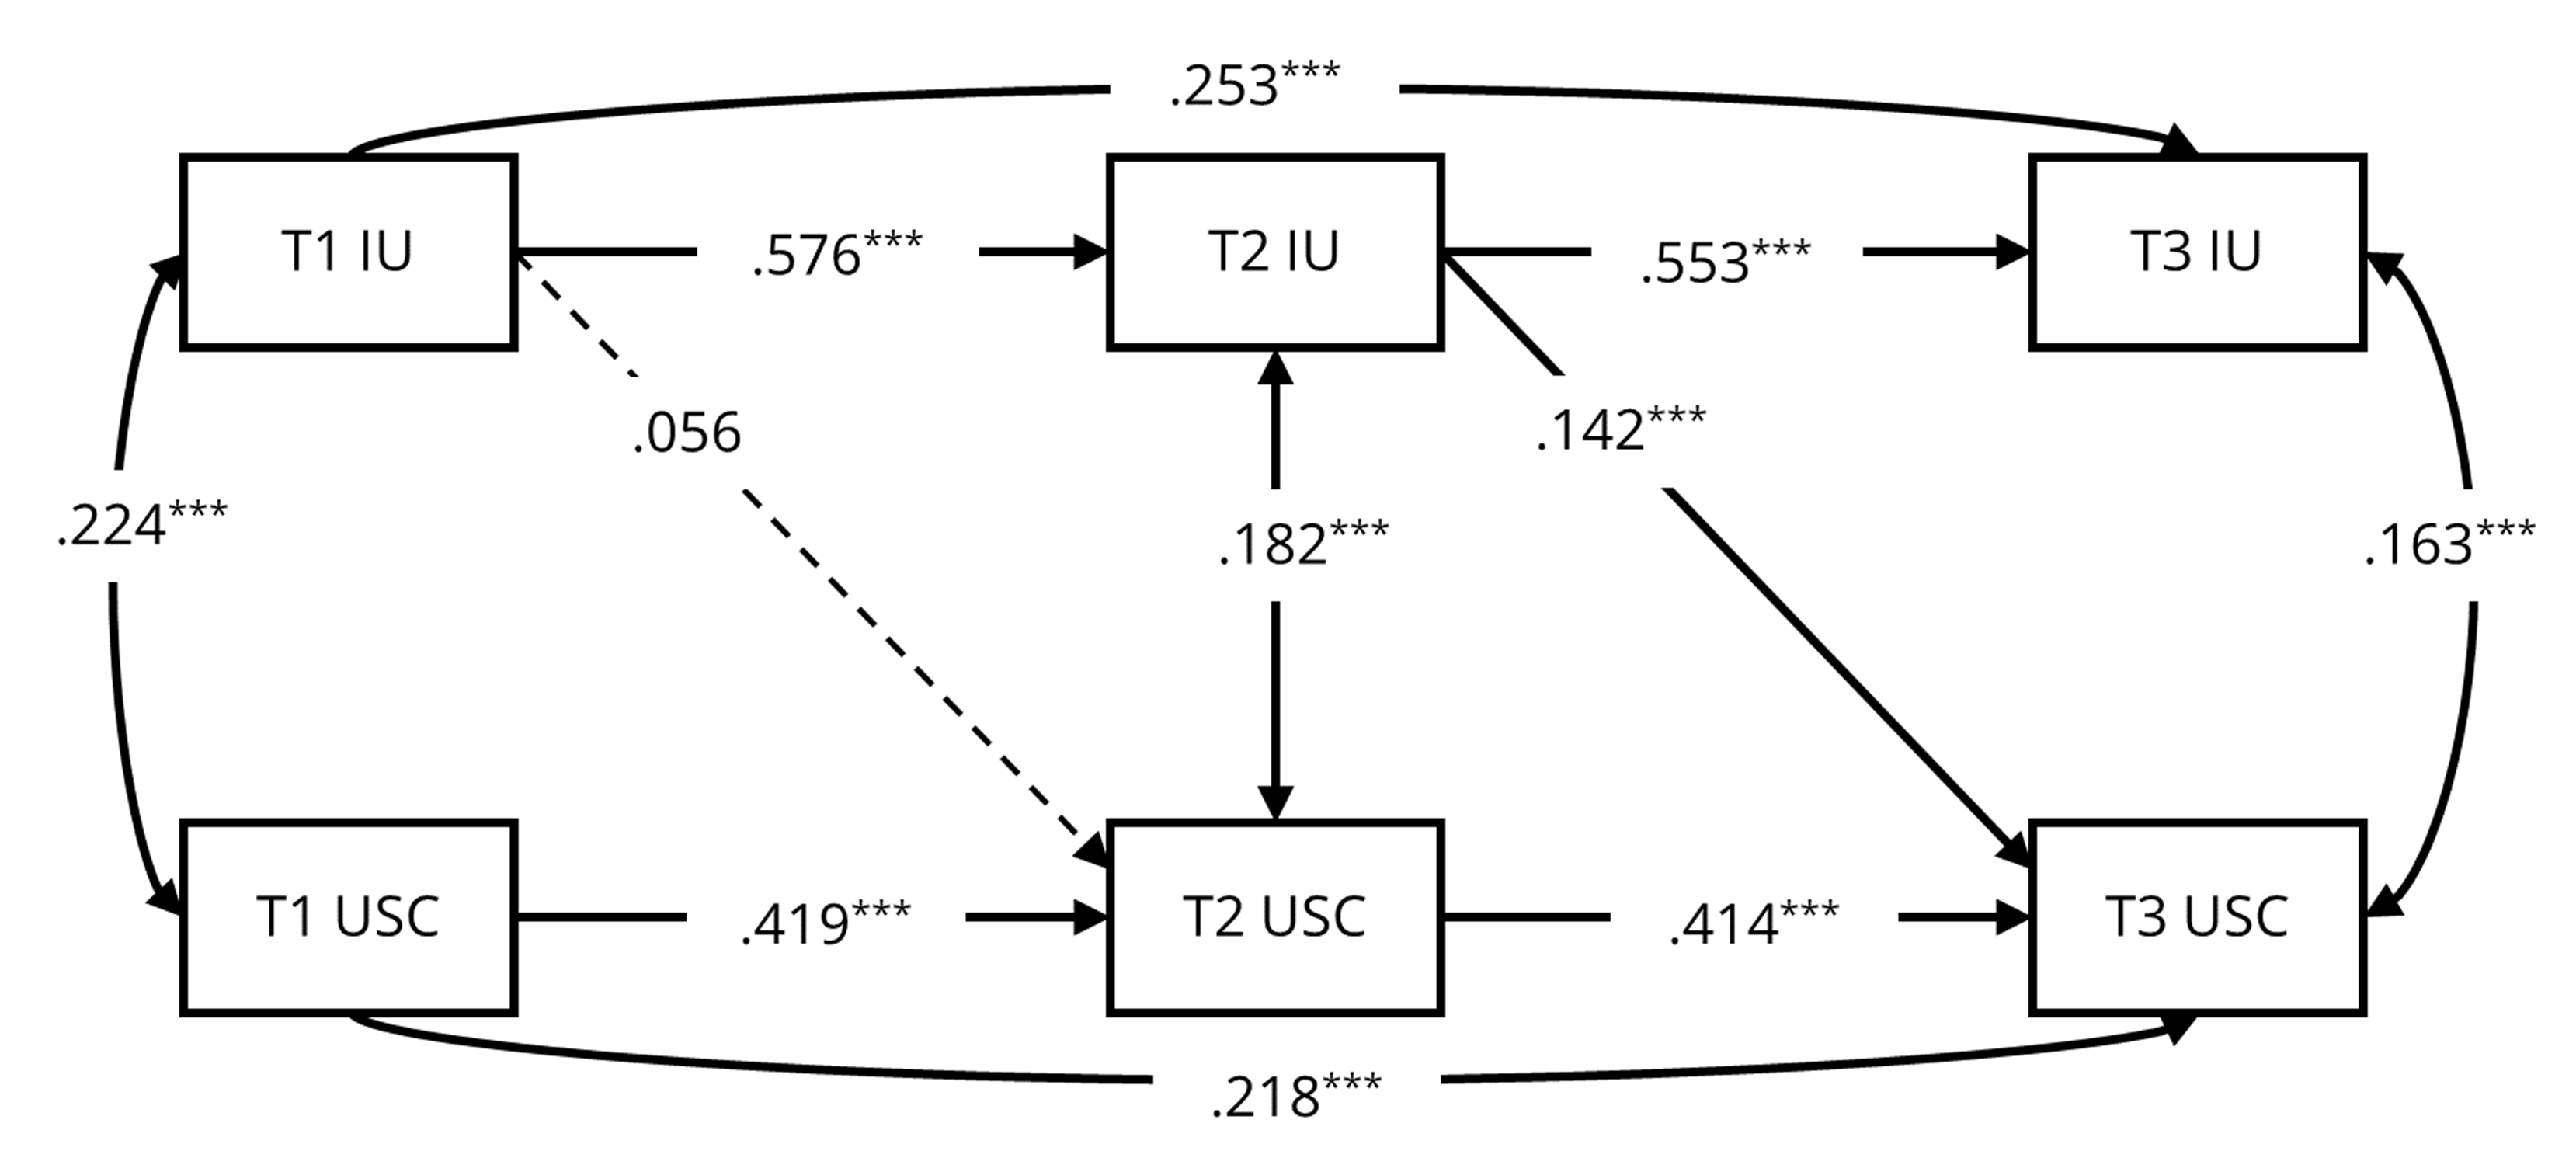
Note. Statistics are standardized regression coefficients. Covariate paths are omitted for model simplification.
The same after. ***p < .001.
Figure 4. The Cross-Lagged Analysis of Intolerance of Uncertainty and Upward Social Comparison on SNS: Model 3.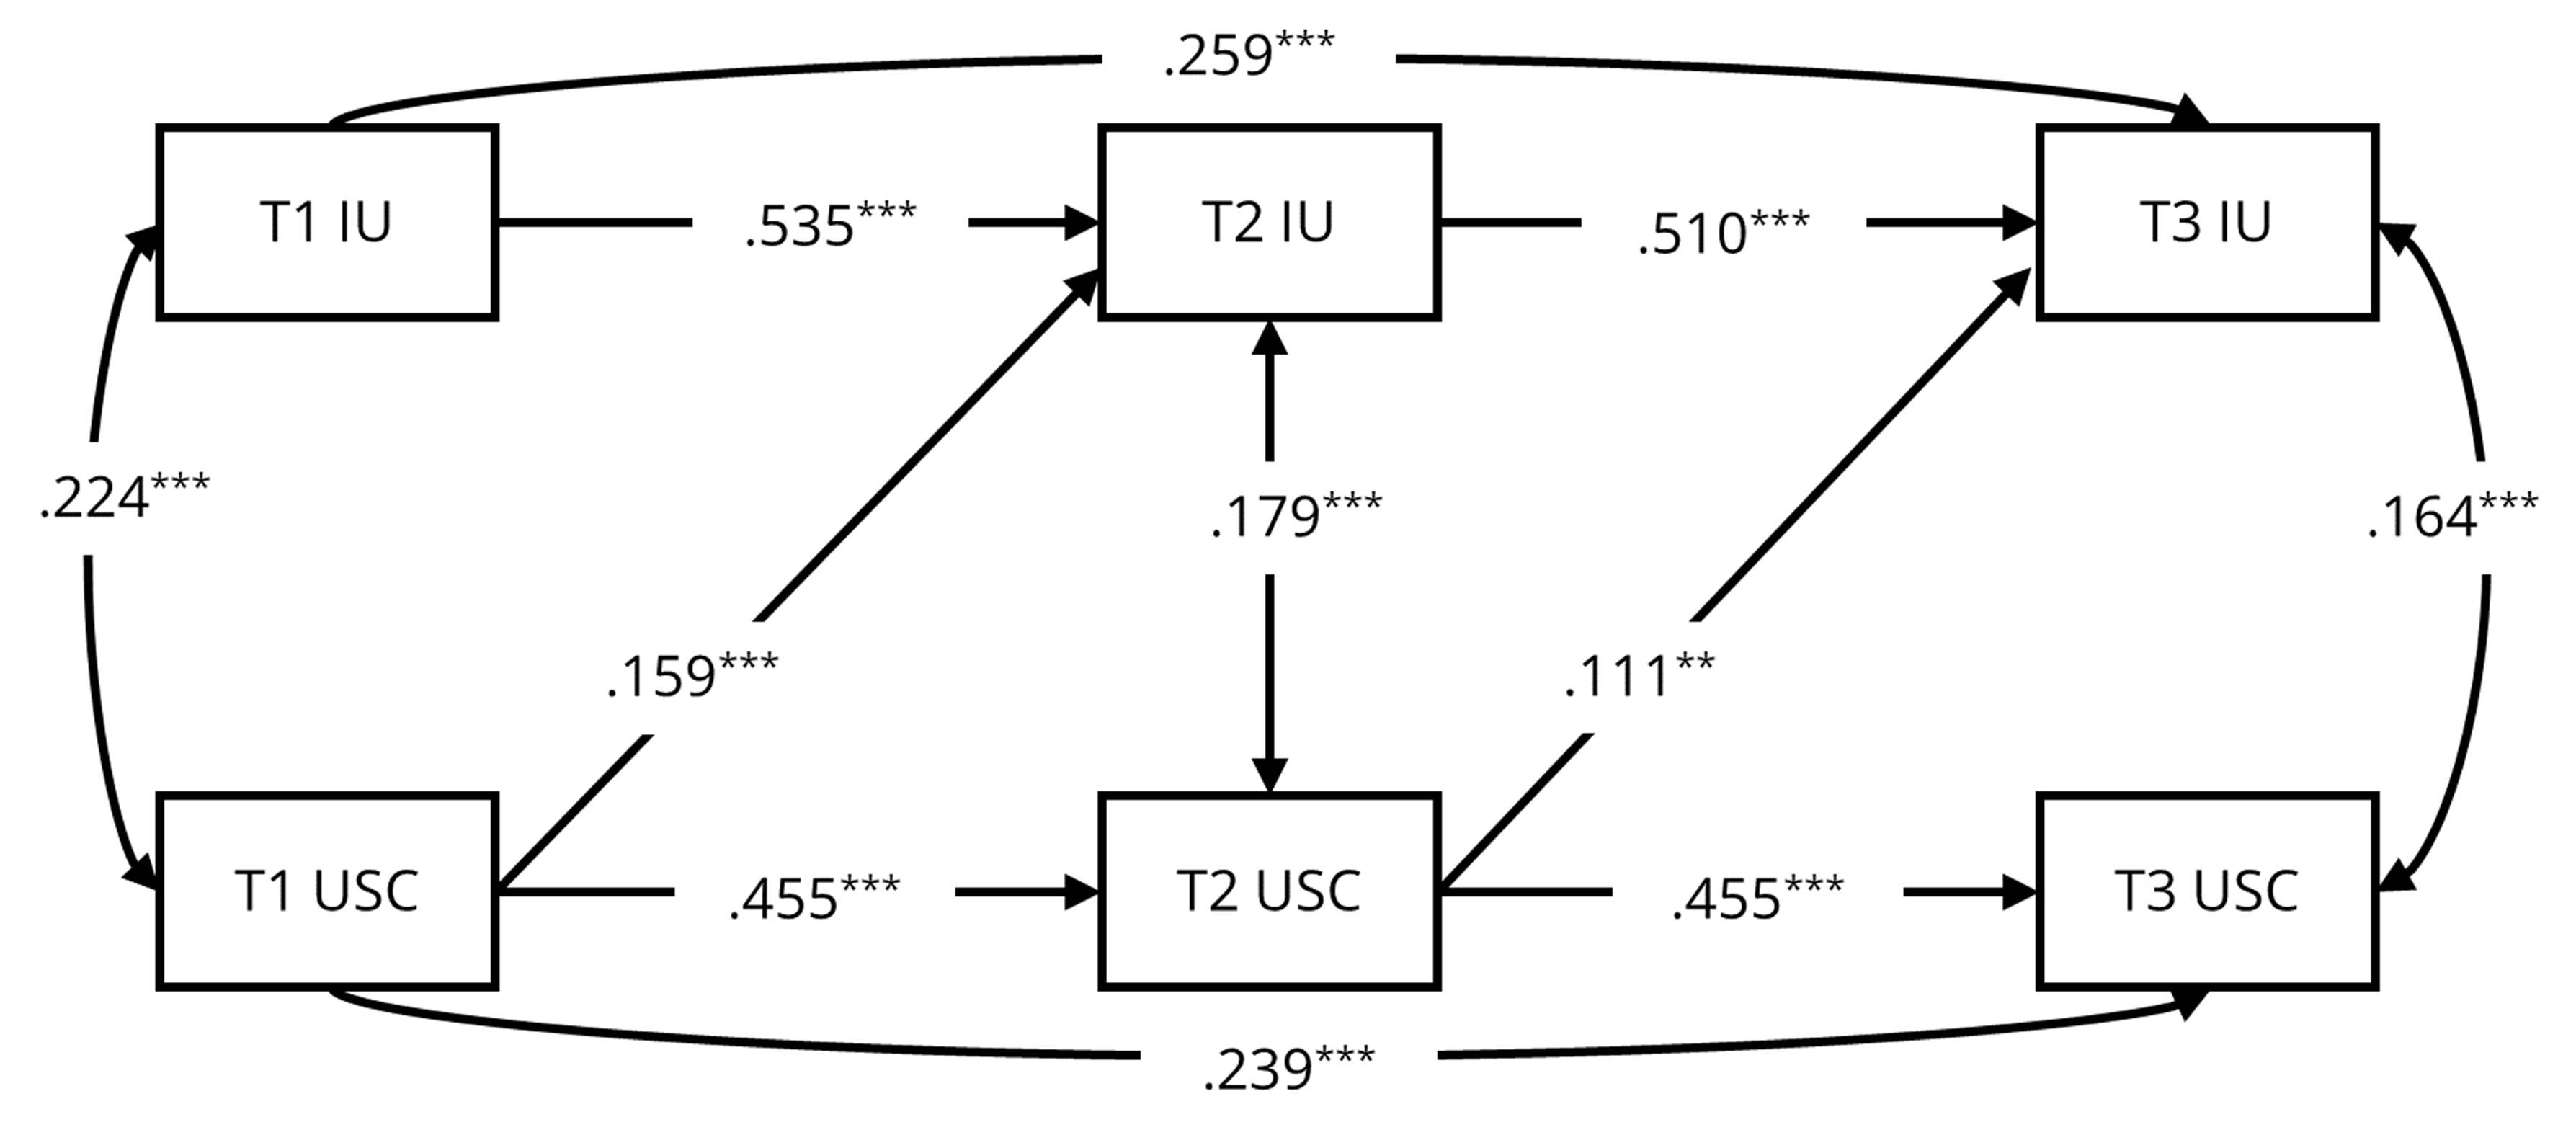
Note. Statistics are standardized regression coefficients. Covariate paths are omitted for model simplification.
The same after. **p < .01, ***p < .001.
Figure 5. The Cross-Lagged Analysis of Intolerance of Uncertainty and Upward Social Comparison on SNS: Model 4.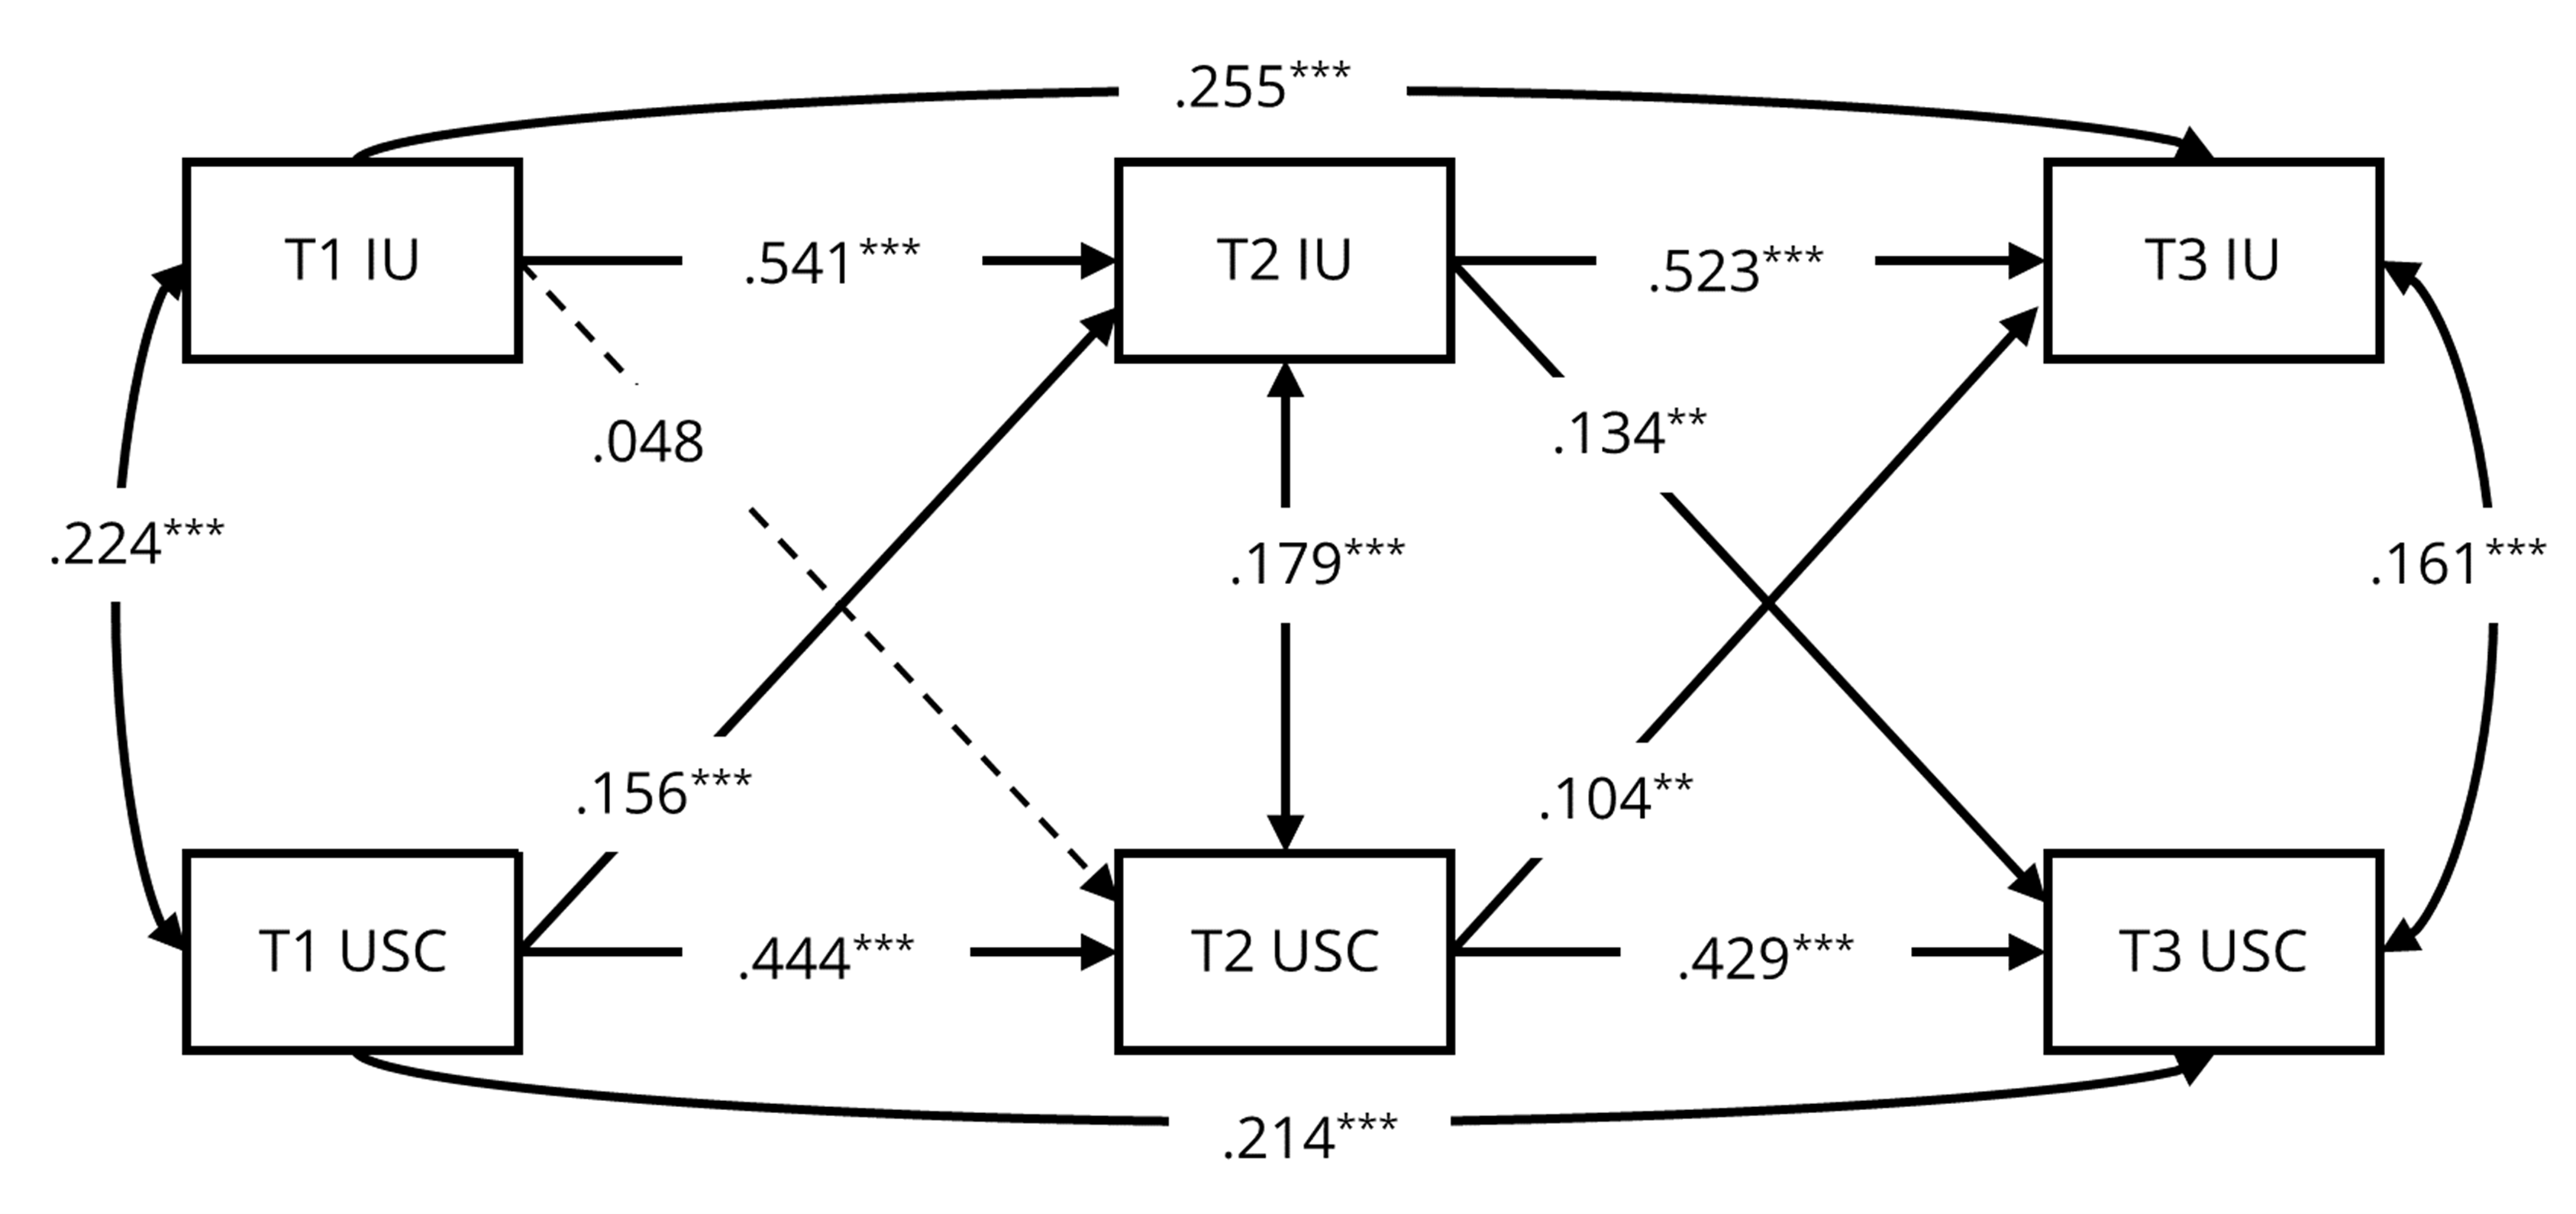
Note. Statistics are standardized regression coefficients. Covariate paths are omitted for model simplification.
The same after. **p < .01, ***p < .001.
Table 4. Overview of the Standardized Stability and Cross-Lagged Coefficients (N = 460).
|
Models |
Autoregressive paths |
β |
p |
Association paths |
β |
p |
Cross-lagged paths |
β |
p |
|
Model 1 |
IU (T1) → IU (T2) |
.570 |
< .001 |
IU (T1) <−> USC (T1) |
.224 |
< .001 |
|
|
|
|
|
IU (T1) → IU (T3) |
.257 |
< .001 |
IU (T2) <−> USC (T2) |
.180 |
< .001 |
|
|
|
|
|
IU (T2) → IU (T3) |
.540 |
< .001 |
IU (T3) <−> USC (T3) |
.159 |
.001 |
|
|
|
|
|
USC (T1) → USC (T2) |
.431 |
< .001 |
|
|
|
|
|
|
|
|
USC (T1) → USC (T3) |
.243 |
< .001 |
|
|
|
|
|
|
|
|
USC (T2) → USC (T3) |
.437 |
< .001 |
|
|
|
|
|
|
|
Model 2 |
IU (T1) → IU (T2) |
.576 |
< .001 |
IU (T1) <−> USC (T1) |
.224 |
< .001 |
IU (T1) → USC (T2) |
.056 |
.193 |
|
|
IU (T1) → IU (T3) |
.253 |
< .001 |
IU (T2) <−> USC (T2) |
.182 |
< .001 |
IU (T2) → USC (T3) |
.142 |
< .001 |
|
|
IU (T2) → IU (T3) |
.553 |
< .001 |
IU (T3) <−> USC (T3) |
.163 |
< .001 |
|
|
|
|
|
USC (T1) → USC (T2) |
.419 |
< .001 |
|
|
|
|
|
|
|
|
USC (T1) → USC (T3) |
.218 |
< .001 |
|
|
|
|
|
|
|
|
USC (T2) → USC (T3) |
.414 |
< .001 |
|
|
|
|
|
|
|
Model 3 |
IU (T1) → IU (T2) |
.535 |
< .001 |
IU (T1) <−> USC (T1) |
.224 |
< .001 |
USC (T1) → IU (T2) |
.159 |
< .001 |
|
|
IU (T1) → IU (T3) |
.259 |
< .001 |
IU (T2) <−> USC (T2) |
.179 |
< .001 |
USC (T2) → IU (T3) |
.111 |
.001 |
|
|
IU (T2) → IU (T3) |
.510 |
< .001 |
IU (T3) <−> USC (T3) |
.164 |
< .001 |
|
|
|
|
|
USC (T1) → USC (T2) |
.455 |
< .001 |
|
|
|
|
|
|
|
|
USC (T1) → USC (T3) |
.239 |
< .001 |
|
|
|
|
|
|
|
|
USC (T2) → USC (T3) |
.455 |
< .001 |
|
|
|
|
|
|
|
Model 4 |
IU (T1) → IU (T2) |
.541 |
< .001 |
IU (T1) <−> USC (T1) |
.224 |
< .001 |
IU (T1) → USC (T2) |
.048 |
.255 |
|
|
IU (T1) → IU (T3) |
.255 |
< .001 |
IU (T2) <−> USC (T2) |
.179 |
< .001 |
IU (T2) → USC (T3) |
.134 |
.001 |
|
|
IU (T2) → IU (T3) |
.523 |
< .001 |
IU (T3) <−> USC (T3) |
.161 |
< .001 |
USC (T1) → IU (T2) |
.156 |
< .001 |
|
|
USC (T1) → USC (T2) |
.444 |
< .001 |
|
|
|
USC (T2) → IU (T3) |
.104 |
.002 |
|
|
USC (T1) → USC (T3) |
.214 |
< .001 |
|
|
|
|
|
|
|
|
USC (T2) → USC (T3) |
.429 |
< .001 |
|
|
|
|
|
|
|
Model 5 |
IU (T1) → IU (T2) |
.535 |
< .001 |
IU (T1) <−> USC (T1) |
.223 |
< .001 |
IU (T1) → USC (T2) |
.058 |
.195 |
|
|
IU (T1) → IU (T3) |
.255 |
< .001 |
IU (T2) <−> USC (T2) |
.203 |
< .001 |
IU (T2) → USC (T3) |
.131 |
.001 |
|
|
IU (T2) → IU (T3) |
.530 |
< .001 |
IU (T3) <−> USC (T3) |
.165 |
.001 |
USC (T1) → IU (T2) |
.149 |
< .001 |
|
|
USC (T1) → USC (T2) |
.437 |
< .001 |
|
|
|
USC (T2) → IU (T3) |
.093 |
.007 |
|
|
USC (T1) → USC (T3) |
.208 |
< .001 |
|
|
|
|
|
|
|
|
USC (T2) → USC (T3) |
.417 |
< .001 |
|
|
|
|
|
|
Given the significant association between gender and upward social comparison at T3, and previous research suggesting potential gender differences in this domain (Nesi & Prinstein, 2015), we conducted supplementary analyses to examine these effects further. Recognizing the female predominance in our sample, we developed Model 5 as a gender-specific analysis focusing exclusively on female participants. This approach allows us to assess whether the observed patterns hold within the majority subgroup to enhance the reliability of our findings. This model fits well, with parameter estimates presented in Table 3. The results of the cross-lagged path analysis in Model 5 (see Figure 6 and Table 4) are consistent with those of Model 4, confirming the robustness of the main findings regarding the relationship between IU and upward social comparison on SNS across the three time points.
Figure 6. Model 5: The Cross-Lagged Analysis of Intolerance of Uncertainty and
Upward Social Comparison on SNS (Only Female Participants).
Note. Statistics are standardized regression coefficients. Covariate paths are omitted for model simplification. **p < .01, ***p < .001.
Additional Analysis
In this study, the interval of three follow-up surveys is relatively short, and individuals’ IU levels at different times may be influenced by external factors (Freeston et al., 2020), potentially leading to instability in the prediction paths between variables. To explore this possibility, we developed a CLPM spanning a longer interval, focusing on T1 and T3. The analysis yielded a saturated model (χ2 = 0, df = 0, CFI = 1, TLI = 1, RMSEA = 0, SRMR = 0). Standardized coefficients of the cross-lagged regression paths revealed that T1 IU significantly and positively predicted T3 upward social comparison frequency (β = .150, p < .001), and T1 upward social comparison also positively predicted T3 IU
(β = .100, p = .01). These results confirmed a positive and bidirectional relationship between IU and upward social comparison on SNS, which may be particularly salient across a longer time frame.
Discussion
The present study utilized a cross-lagged panel model to investigate the longitudinal relationship between intolerance of uncertainty (IU) and upward social comparison on SNS in emerging adulthood. The key findings revealed a bidirectional relationship: IU positively predicted upward social comparison on SNS at later stages (T2→T3), providing partial support for H1. Moreover, upward social comparison on SNS at a previous time point positively predicted IU at a subsequent time point, supporting H2.
Theoretically, the finding that IU predicts upward social comparison on SNS aligns with Social Comparison Theory (Festinger, 1954) and the self-improvement hypothesis. In the multifaceted and unpredictable phase of emerging adulthood, individuals with high levels of IU typically exhibit a pronounced aversion to ambiguous and uncertain situations (Iannattone et al., 2024). To alleviate internal distress, they tend to find the gap between themselves and those who outperform them through upward social comparison, aiming to accurately assess their place within the social framework (Wheeler, 1966). This process is instrumental in providing them with a psychological sense of security amidst challenges and uncertainty. However, the reverse effect—where online frequent upward comparisons exacerbate IU—may be explained by the Uncertainty-Reactive Approach Motivation Theory (McGregor et al., 2001, 2009). According to this theory, individuals reduce uncertainty by adopting compensatory beliefs associated with cultural worldviews and various aspects of the self (e.g., identity, goals, and values). In other words, through self-esteem enhancement, self-goal clarification, and self-affirmation, individuals could establish relatively stable indicators of the self, thereby effectively reducing current uncertainty and coping better with various uncertain situations (Yang et al., 2017). Emerging adults, at a pivotal point in their lives, confront numerous uncertainties, such as career choices and interpersonal dynamics. Throughout this period, they continuously explore self-identity and social roles to navigate and comprehend the uncertainty surrounding them (Arnett, 2000). However, it is worth noting that the inclination towards social comparison may potentially have detrimental effects throughout this process. For instance, engaging in upward social comparison on SNS could reduce individuals’ self-efficacy (Tiggemann & Slater, 2013), leading to negative beliefs about their ability to respond to threatening challenges and further amplifying fear about uncertainty (Stone et al., 2022), ultimately heightening intolerance of uncertainty.
These findings indicate a vicious cycle: while individuals may initially turn to social comparison to reduce uncertainty, persistent upward social comparison on SNS might evoke self-doubt (Schmuck et al., 2019), leading to confusion and insecurity, and even a sense of powerlessness in uncertain situations (Zhao et al., 2019). Practically, these findings highlight the need for targeted interventions to reduce maladaptive social comparison on SNS, particularly among emerging adults. Cognitive-behavioral strategies may buffer against heightened IU by reducing excessive comparison tendencies. For instance, individuals can reframe comparison tendencies (e.g., fostering self-affirmation; Yang et al., 2017) or reduce SNS engagement during periods of heightened stress.
Notably, while IU is commonly viewed as a stable personality trait (Carleton, 2016), it may exhibit short-term fluctuations in response to sudden events, stress, and negative emotions (Freeston et al., 2020). Therefore, we conducted additional analysis by constructing a cross-lagged panel model using data from T1 and T3. This analysis revealed that IU at T1 significantly predicted the frequency of upward social comparison at T3. It implies that the relationship between the two variables may be particularly significant over longer time intervals. Future research could consider extending tracking periods to ensure the stability and reliability of results, thereby deepening our understanding of the predictive relationship between IU and upward social comparison on SNS and refining related theoretical models accordingly.
While this study has provided valuable findings, there are inevitably some limitations. First, within this study, the gender imbalance may have limited our ability to detect potential gender differences in upward social comparison on SNS as found in previous research (Guimond et al., 2007; Nesi & Prinstein, 2015). Additionally, the impact of sampling bias could have potentially limited the generalizability of the research findings. Second, this study focuses on upward social comparison on SNS and does not test the potential interplay with lateral and downward social comparison concerning IU. Future research may integrate lateral and downward social comparisons to gain a more holistic comprehension of the relationship between IU and social comparison. Third, when exploring the association between IU and upward social comparison, we assumed that individuals’ core self-evaluations may be a mechanism underlying these variables. Future studies could explore this potential mechanism to understand how individuals form their self-evaluations during social comparisons and the subsequent impact on IU (or reverse paths). Additionally, this study lacks baseline statistics regarding participants’ SNS use patterns (e.g., frequency, duration, or type of platforms used). Although the primary focus of this research was on the longitudinal relationship between IU and upward social comparison on SNS, the absence of SNS usage data may constrain the interpretability of the findings. For instance, variability in SNS engagement (e.g., passive vs. active use) could potentially moderate the observed relationships (Pang, 2020). Future studies should incorporate detailed SNS use metrics to better account for these behavioral differences and strengthen the validity of the results.
Despite these limitations, the current study utilized longitudinal data to examine the reciprocal relationship between IU and upward social comparison on SNS. These findings can provide useful guidance for young social media users, equipping them with the skills to use social media reasonably and mitigate excessive comparison tendencies. Furthermore, it also helps to improve their resilience to uncertainty and enables them to cope better with the stress associated with social comparison, promoting their well-being in the digital age.
Conflict of Interest
The authors have no conflicts of interest to declare.
Use of AI Services
The authors declare that they used AI services, specifically Grammarly, to assist with grammar correction and minor style refinements. All suggestions provided by the service were carefully reviewed to ensure that the original meaning and factual accuracy were fully preserved.
Acknowledgement
This study was supported by the Youth Innovation Team Development Plan in Shandong Province (2022RW038), the National Natural Science Foundation of China (32100872), and the Major Project of the Key Research Institute of Humanities and Social Sciences of Ministry of Education (25JJD880001).

This work is licensed under a Creative Commons Attribution-ShareAlike 4.0 International License.
Copyright © 2025 Qing Yang , Xinhui Qiu, Yicheng Wang, Miao Lv