
Convergent and divergent predictors of extensive use time and problematic TikTok use
Vol.19,No.4(2025)
Ágnes Zsila
 Mara S. Aruguete
Reza Shabahang
Ágnes Buvár
Gábor Orosz
Mara S. Aruguete
Reza Shabahang
Ágnes Buvár
Gábor Orosz
Short videos on TikTok provided an entertaining pastime for 1.5 billion users worldwide in 2023. The increasing popularity of TikTok has generated considerable research interest in the psychological and social predictors of problematic use. However, recent empirical studies on Internet-based activities have found evidence that extensive time spent on TikTok is not necessarily problematic. This study explores convergent and divergent predictors of extensive and problematic TikTok use including demographics, psychological distress, and TikTok activities. A total of 618 Hungarian TikTok users (80.1% women, 18.8% men; Mage = 22.1 years, SD = 4.2) completed an online questionnaire. The unidimensional, six-item Problematic TikTok Use Questionnaire was developed, demonstrating good psychometric properties in terms of factor structure, reliability, and validity. Based on latent profile analysis, 3.07% of TikTok users were found to be at risk of problematic TikTok use. Using a structural equation model, it was found that symptoms of depression, anxiety, and stress had stronger associations with problematic use than with extensive time spent on TikTok. Exploring the Discover page and viewing content creators’ videos predicted only problematic use severity. Exploring the For You page and reading comments posted to others’ videos were the strongest predictors of both extensive use time and problematic use. These factors collectively explained a notable proportion of the variance of problematic use severity (45%). The findings provide a detailed picture of risky use patterns and extend knowledge of the differences between extensive use time and problematic TikTok use.
leisure activity; problematic use; psychological distress; extensive use; TikTok
Ágnes Zsila
Institute of Psychology, Pázmány Péter Catholic University, Budapest
Ágnes Zsila, Ph.D., is an associate professor at the Institute of Psychology, ELTE Eötvös Loránd University, Hungary. Her research interest encompasses a broad range of technology-related behavioral addictions and aggressive behaviors in the online sphere. Her recent articles focus on the problematic use of social media and video games, toxic behaviors, and celebrity worship.
Mara S. Aruguete
Lincoln University, Jefferson City, Missouri
Mara S. Aruguete is a Professor Emeritus at Lincoln University of Missouri (USA). She received her Ph.D. in Comparative Psychology at the University of California in 1994. Her published work focuses on educational psychology and media-related topics. She serves as an Associate Editor for the North American Journal of Psychology.
Reza Shabahang
College of Education, Psychology and Social Work, Flinders University, Adelaide
Reza Shabahang, Ph.D., is a Research Fellow in Cybersecurity at Monash University, Melbourne, Australia. His research interests broadly encompass media effects, media–user interactions, the culture of media use, and media-based interventions. His recent publications address topics such as the mindful use of social media, doomscrolling, sadfishing, perceived media threats and support, and media conspiracy beliefs.
Ágnes Buvár
Institute of People-Environment Transaction, ELTE Eötvös Loránd University, Budapest
Ágnes Buvár, Ph.D., is Research Fellow at the Institute of People-Environment Transactions, ELTE Eötvös Loránd University, Budapest, Hungary. She owns a master’s degree in psychology and applied marketing, and a PhD in communication sciences. Her research interests include social media and influencer communication, the psychology of persuasion and sustainable consumption.
Gábor Orosz
Unité de Recherche Pluridisciplinaire Sport Santé Société, Laboratoire Sherpas, Université d’Artois, Liévin
Gábor Orosz is a psychologist at Artois University, France, working at the intersection of social psychology, educational psychology, and individual differences. His specialty is designing brief online social psychological interventions in various fields.
Altman, D. G., & Bland, J. M. (1994a). Statistics notes: Diagnostic tests 1: Sensitivity and specificity. BMJ, 308(6943), 1552. https://doi.org/10.1136/bmj.308.6943.1552
Altman, D. G., & Bland, J. M. (1994b). Statistics notes: Diagnostic tests 2: Predictive values. BMJ, 309(6947), 102. https://doi.org/10.1136/bmj.309.6947.102
Andreassen, C. S., Torsheim, T., Brunborg, G. S., & Pallesen, S. (2012). Development of a Facebook addiction scale. Psychological Reports, 110(2), 501–517. https://doi.org/10.2466/02.09.18.PR0.110.2.501-517
Bányai, F., Zsila, Á., Király, O., Maraz, A., Elekes, Z., Griffiths, M. D., Andreassen, C. S., & Demetrovics, Z. (2017). Problematic social media use: Results from a large-scale nationally representative adolescent sample. PLoS ONE, 12(1), Article e0169839. https://doi.org/10.1371/journal.pone.0169839
Barnes, S. J., Pressey, A. D., & Scornavacca, E. (2019). Mobile ubiquity: Understanding the relationship between cognitive absorption, smartphone addiction and social network services. Computers in Human Behavior, 90, 246–258. https://doi.org/10.1016/j.chb.2018.09.013
Bentler, P. M. (1990). Comparative fit indexes in structural models. Psychological Bulletin, 107(2), 238–246. https://doi.org/10.1037/0033-2909.107.2.238
Bhandari, A., & Bimo, S. (2022). Why’s everyone on TikTok now? The algorithmized self and the future of self-making on social media. Social Media + Society, 8(1). https://doi.org/10.1177/20563051221086241
Billieux, J., Schimmenti, A., Khazaal, Y., Maurage, P., & Heeren, A. (2015). Are we overpathologizing everyday life? A tenable blueprint for behavioral addiction research. Journal of Behavioral Addictions, 4(3), 119–123. https://doi.org/10.1556/2006.4.2015.009
Boer, M., Stevens, G. W. J. M., Finkenauer, C., de Looze, M. E., & van den Eijnden, R. J. J. (2021). Social media use intensity, social media use problems, and mental health among adolescents: Investigating directionality and mediating processes. Computers in Human Behavior, 116, Article 106645. https://doi.org/10.1016/j.chb.2020.106645
Bőthe, B., Tóth-Király, I., Potenza, M. N., Orosz, G., & Demetrovics, Z. (2020). High-frequency pornography use may not always be problematic. The Journal of Sexual Medicine, 17(4), 793–811. https://doi.org/10.1016/j.jsxm.2020.01.007
Brand, M., Wegmann, E., Stark, R., Müller, A., Wölfling, K., Robbins, T. W., & Potenza, M. N. (2019). The interaction of person-affect-cognition-execution (I-PACE) model for addictive behaviors: Update, generalization to addictive behaviors beyond internet-use disorders, and specification of the process character of addictive behaviors. Neuroscience & Biobehavioral Reviews, 104, 1–10. https://doi.org/10.1016/j.neubiorev.2019.06.032
Brown, T. A. (2015). Confirmatory factor analysis for applied research. The Guilford Press.
Cash, T. F., Fleming, E. C., Alindogan, J., Steadman, L., & Whitehead, A. (2002). Beyond body image as a trait: The development and validation of the Body Image States Scale. Eating Disorders, 10(2), 103–113. https://doi.org/10.1080/10640260290081678
Chao, M., Lei, J., He, R., Jiang, Y., & Yang, H. (2023). TikTok use and psychosocial factors among adolescents: Comparisons of non-users, moderate users, and addictive users. Psychiatry Research, 325, Article 115247. https://doi.org/10.1016/j.psychres.2023.115247
Chen, I.-H., Pakpour, A. H., Leung, H., Potenza, M. N., Su, J.-A., Lin, C.-Y., & Griffiths, M. D. (2020). Comparing generalized and specific problematic smartphone/internet use: Longitudinal relationships between smartphone application-based addiction and social media addiction and psychological distress. Journal of Behavioral Addictions, 9(2), 410–419. https://doi.org/10.1556/2006.2020.00023
Duarte, F. (2025). TikTok User Age, Gender & Demographics (2025). Exploding Topics. https://explodingtopics.com/blog/tiktok-demographics#
Fahy, A. E., Stansfeld, S. A., Smuk, M., Smith, N. R., Cummins, S., & Clark, C. (2016). Longitudinal associations between cyberbullying involvement and adolescent mental health. Journal of Adolescent Health, 59(5), 502–509. https://doi.org/10.1016/j.jadohealth.2016.06.006
Finney, S. J., & DiStefano, C. (2013). Non-normal and categorical data in structural equation modeling. In G. R. Hancock & R. O. Mueller (Eds.), Structural equation modeling: A second course (2nd ed., pp. 439–492). Information Age Publishing.
Gentzler, A. L., Hughes, J. L., Johnston, M., & Alderson, J. E. (2023). Which social media platforms matter and for whom? Examining moderators of links between adolescents' social media use and depressive symptoms. Journal of Adolescence, 95(8), 1725–1748. https://doi.org/10.1002/jad.12243
Glaros, A. G., & Kline, R. B. (1988). Understanding the accuracy of tests with cutting scores: The sensitivity, specificity, and predictive value model. Journal of Clinical Psychology, 44(6), 1013–1023. https://doi.org/10.1002/1097-4679(198811)44:6<1013::AID-JCLP2270440627>3.0.CO;2-Z
Griffiths, M. (2005). A ‘components’ model of addiction within a biopsychosocial framework. Journal of Substance Use, 10(4), 191–197. https://doi.org/10.1080/14659890500114359
Griffiths, M. D. (2010). The role of context in online gaming excess and addiction: Some case study evidence. International Journal of Mental Health and Addiction, 8(1), 119–125. https://doi.org/10.1007/s11469-009-9229-x
Günlü, A., Oral, T., Yoo, S., & Chung, S. (2023). Reliability and validity of the Problematic TikTok Use Scale among the general population. Frontiers in Psychiatry, 14, Article 1068431. https://doi.org/10.3389/fpsyt.2023.1068431
Hair, J. F., Black, W. C., Babin, B. J., Anderson, R. E. (2019). Multivariate data analysis (8th edition). Cengage Learning EMEA.
Harriger, J. A., Wick, M. R., Sherline, C. M., & Kunz, A. L. (2023). The body positivity movement is not all that positive on TikTok: A content analysis of body positive TikTok videos. Body Image, 46, 256–264. https://doi.org/10.1016/j.bodyim.2023.06.003
Hendrikse, C., & Limniou, M. (2024). The use of Instagram and TikTok in relation to problematic use and well-being. Journal of Technology in Behavioral Science, 9(4), 846–857. https://doi.org/10.1007/s41347-024-00399-6
Hu, S., Gan, J., Shi, V., & Krug, I. (2023). Chinese TikTok (Douyin) challenges and body image concerns: A pilot study. Journal of Eating Disorders, 11(1), Article 108. https://doi.org/10.1186/s40337-023-00829-5
Kahneman, D. (1973). Attention and effort. Prentice-Hall.
Katz, D., Horváth, Z., Pontes, H. M., Koncz, P., Demetrovics, Z., & Király, O. (2024). How much gaming is too much? An analysis based on psychological distress. Journal of Behavioral Addictions, 13(3), 716–728. https://doi.org/10.1556/2006.2024.00036
Király, O., Tóth, D., Urbán, R., Demetrovics, Z., & Maraz, A. (2017). Intense video gaming is not essentially problematic. Psychology of Addictive Behaviors, 31(7), 807–817. https://doi.org/10.1037/adb0000316
Kwon, M., Kim, D.-J., Cho, H., & Yang, S. (2013). The Smartphone Addiction Scale: Development and validation of a short version for adolescents. PloS ONE, 8(12), Article e83558. https://doi.org/10.1371/journal.pone.0083558
Laconi, S., Pirès, S., & Chabrol, H. (2017). Internet gaming disorder, motives, game genres and psychopathology. Computers in Human Behavior, 75, 652–659. https://doi.org/10.1016/j.chb.2017.06.012
Lovibond, P. F., & Lovibond, S. H. (1995). The structure of negative emotional states: Comparison of the Depression Anxiety Stress Scales (DASS) with the Beck depression and anxiety inventories. Behaviour Research and Therapy, 33(3), 335–343. https://doi.org/10.1016/0005-7967(94)00075-U
Marengo, D., Fabris, M. A., Longobardi, C., & Settanni, M. (2022). Smartphone and social media use contributed to individual tendencies towards social media addiction in Italian adolescents during the COVID-19 pandemic. Addictive Behaviors, 126, Article 107204. https://doi.org/10.1016/j.addbeh.2021.107204
McDonald, R. P. (1970). The theoretical foundations of principal factor analysis, canonical factor analysis, and alpha factor analysis. British Journal of Mathematical and Statistical Psychology, 23(1), 1–21. https://doi.org/10.1111/j.2044-8317.1970.tb00432.x
Mink, D. B., & Szymanski, D. M. (2022). TikTok use and body dissatisfaction: Examining direct, indirect, and moderated relations. Body Image, 43, 205–216. https://doi.org/10.1016/j.bodyim.2022.09.006
Montag, C., Yang, H., & Elhai, J. D. (2021). On the psychology of TikTok use: A first glimpse from empirical findings. Frontiers in Public Health, 9, Article 641673. https://doi.org/10.3389/fpubh.2021.641673
Muthén, L. K., & Muthén, B. O. (2017). Mplus user’s guide (8th ed.). Muthén & Muthén. https://www.statmodel.com/html_ug.shtml
Nawaz, S. (2024). Distinguishing between effectual, ineffectual, and problematic smartphone use: A comprehensive review and conceptual pathways model for future research. Computers in Human Behavior Reports, 14, Article 100424. https://doi.org/10.1016/j.chbr.2024.100424
O'Connor, K., Karl, J., & Dunne, S. (2024). Picture perfect: Exploring the relationship between problematic TikTok use, physical appearance perfectionism, and upward physical appearance comparison on body appreciation. Current Research in Behavioral Sciences, 7, Article 100156. https://doi.org/10.1016/j.crbeha.2024.100156
Perales, J. C., King, D. L., Navas, J. F., Schimmenti, A., Sescousse, G., Starcevic, V., van Holst, R. J., & Billieux, J. (2020). Learning to lose control: A process-based account of behavioral addiction. Neuroscience & Biobehavioral Reviews, 108, 771–780. https://doi.org/10.1016/j.neubiorev.2019.12.025
Pryde, S., & Prichard, I. (2022). TikTok on the clock but the #fitspo don’t stop: The impact of TikTok fitspiration videos on women’s body image concerns. Body Image, 43, 244–252. https://doi.org/10.1016/j.bodyim.2022.09.004
Qin, Y., Omar, B., & Musetti, A. (2022). The addiction behavior of short-form video app TikTok: The information quality and system quality perspective. Frontiers in Psychology, 13, Article 932805. https://doi.org/10.3389/fpsyg.2022.932805
Raiter, N., Husnudinov, R., Mazza, K., & Lamarche, L. (2023). TikTok promotes diet culture and negative body image rhetoric: A content analysis. Journal of Nutrition Education and Behavior, 55(10), 755–760. https://doi.org/10.1016/j.jneb.2023.08.001
Ryan, T., Chester, A., Reece, J., & Xenos, S. (2014). The uses and abuses of Facebook: A review of Facebook addiction. Journal of Behavioral Addictions, 3(3), 133–148. https://doi.org/10.1556/jba.3.2014.016
Scherr, S., & Wang, K. (2021). Explaining the success of social media with gratification niches: Motivations behind daytime, nighttime, and active use of TikTok in China. Computers in Human Behavior, 124, Article 106893. https://doi.org/10.1016/j.chb.2021.106893
Sha, P., & Dong, X. (2021). Research on adolescents regarding the indirect effect of depression, anxiety, and stress between TikTok use disorder and memory loss. International Journal of Environmental Research and Public Health, 18(16), Article 8820. https://doi.org/10.3390/ijerph18168820
Shabahang, R., Zsila, Á., Aruguete, M. S., Huynh, H. P., & Orosz, G. (2024). Embrace the moment using social media: A cross-cultural study of mindful use of social media. Mindfulness, 15(1), 157–173. https://doi.org/10.1007/s12671-023-02271-9
Shannon, H., Bush, K., Villeneuve, P. J., Hellemans, K. G., & Guimond, S. (2022). Problematic social media use in adolescents and young adults: Systematic review and meta-analysis. JMIR Mental Health, 9(4), Article e33450. https://doi.org/10.2196/33450
Smith, T., & Short, A. (2022). Needs affordance as a key factor in likelihood of problematic social media use: Validation, latent profile analysis and comparison of TikTok and Facebook problematic use measures. Addictive Behaviors, 129, Article 107259. https://doi.org/10.1016/j.addbeh.2022.107259
Springer, N., Engelmann, I., & Pfaffinger, C. (2015). User comments: Motives and inhibitors to write and read. Information, Communication & Society, 18(7), 798–815. https://doi.org/10.1080/1369118X.2014.997268
Su, W., Han, X., Yu, H., Wu, Y., & Potenza, M. N. (2020). Do men become addicted to internet gaming and women to social media? A meta-analysis examining gender-related differences in specific internet addiction. Computers in Human Behavior, 113, Article 106480. https://doi.org/10.1016/j.chb.2020.106480
Su, C., Zhou, H., Gong, L., Teng, B., Geng, F., & Hu, Y. (2021). Viewing personalized video clips recommended by TikTok activates default mode network and ventral tegmental area. NeuroImage, 237, Article 118136. https://doi.org/10.1016/j.neuroimage.2021.118136
Tafradzhiyski, N. (2025). Tiktok revenue and usage statistics (2025). Business of Apps. https://www.businessofapps.com/data/tik-tok-statistics/
Vaterlaus, J. M., & Winter, M. (2021). TikTok: An exploratory study of young adults’ uses and gratifications. The Social Science Journal, 1–20. https://doi.org/10.1080/03623319.2021.1969882
Verduyn, P., Gugushvili, N., & Kross, E. (2022). Do social networking sites influence well-being? The extended active-passive model. Current Directions in Psychological Science, 31(1), 62–68. https://doi.org/10.1177/09637214211053637
Westenberg, J. M., & Oberle, C. D. (2023). The impact of body-positivity and body-checking TikTok videos on body image. The Journal of Social Media in Society, 12(1), 49–60. https://thejsms.org/index.php/JSMS/article/view/1153/617
Woodward, M. (2025). Tiktok user statistics 2025: Everything you need to know. SearchLogistics. https://searchlogistics.com/learn/statistics/tiktok-user-statistics/
Yan, Y., He, Y., & Li, L. (2023). Why time flies? The role of immersion in short video usage behavior. Frontiers in Psychology, 14, Article 1127210. https://doi.org/10.3389/fpsyg.2023.1127210
Yao, N., Chen, J., Huang, S., Montag, C., & Elhai, J. D. (2023). Depression and social anxiety in relation to problematic TikTok use severity: The mediating role of boredom proneness and distress intolerance. Computers in Human Behavior, 145, Article 107751. https://doi.org/10.1016/j.chb.2023.107751
Yusoff, M. S. B. (2013). Psychometric properties of the Depression Anxiety Stress Scale in a sample of medical degree applicants. International Medical Journal, 20(3), 295–300. https://psycnet.apa.org/record/2013-29693-003
Zsila, Á., Shabahang, R., Aruguete, M. S., Bőthe, B., Gregor-Tóth, P., & Orosz, G. (2024). Exploring the association between Twitch use and well-being. Psychology of Popular Media, 13(4), 620–632. https://doi.org/10.1037/ppm0000486
Authors' Contribution
Ágnes Zsila: conceptualization, methodology, formal analysis, writing—original draft. Mara S. Aruguete: conceptualization, writing—original draft. Reza Shabahang: conceptualization, writing—original draft. Ágnes Buvár: data curation, validation, writing—review & editing. Gábor Orosz: conceptualization, supervision, writing—review & editing.
Editorial Record
First submission received:
April 19, 2024
Revisions received:
February 2, 2025
May 31, 2025
June 15, 2021
July 22, 2025
August 12, 2025
Accepted for publication:
August 18, 2025
Editor in charge:
Maèva Flayelle
Introduction
The user base of TikTok has grown exponentially since its initial launch in 2016. Indeed, TikTok was the most downloaded application in 2024, with 1.7 billion active users globally (Tafradzhiyski, 2025). Today, about 21% of Internet users worldwide use TikTok (Woodward, 2025). TikTok and smartphone use are closely linked (Barnes et al., 2019), with 65% of visits to the platform in December 2024 occurring via mobile devices (Duarte, 2025). Due to its rapid rise in popularity, there are a growing number of studies examining the psychological correlations of TikTok use. Evidence suggests that TikTok use can be problematic for some users, who show addiction-like symptoms (Qin et al., 2022). Nonetheless, many users who invest considerable time in viewing and creating TikTok content, do not necessarily experience problems associated with problematic use (e.g., decreased school performance, psychological distress; Chao et al., 2023). Based on existing evidence on major demographic characteristics (e.g., Mink & Szymanski, 2022; Sha & Dong, 2021) and psychological problems (e.g., Sha & Dong, 2021; Yao et al., 2023) associated with TikTok use, this study further investigates the distinction between problematic and extensive (nonproblematic) TikTok use by (1) examining the possible convergent and divergent predictors of problematic and extensive TikTok use among demographic characteristics and psychological difficulties in a comprehensive model, and (2) expanding the scope of previous investigations to TikTok activities (e.g., exploring the For You page) specific to the platform to gain a more nuanced picture of possible predictors among specific use patterns. Examining the possible convergent and divergent predictors of problematic and nonproblematic TikTok use among popular TikTok activities can help identify potentially risky behavioral patterns in TikTok use, which can assist prevention efforts.
TikTok’s design features may have contributed to its rapid expansion. One competitive advantage TikTok has over other social media platforms is its unique algorithmic recommendation system. TikTok uses self-training artificial intelligence to capture users’ desires and moods, customizing content specifically to the user (Bhandari & Bimo, 2022; Qin et al., 2022). As a result, many users experience an immersive stream of personally relevant content (i.e., “For You page”) and an enjoyable “flow” state in which time perception may be distorted (Yan et al., 2023). Although much of the user experience appears to be positive and gratifying, prolonged use can elevate the risk of negative experiences such as cyberbullying (Vaterlaus & Winter, 2021), which have been associated with psychological and social problems (Chen et al., 2020; Fahy et al., 2016).
However, extensive use time is not always harmful. Extensive use refers to an elevated frequency of TikTok use, which is not necessarily associated with problems typically observed in relation to problematic use (e.g., interference with daily activities; Boer et al., 2021). Moreover, findings on other Internet-based activities (e.g., gaming and pornography consumption) show that extensive use time is only weakly related or unrelated to problematic use (see Bőthe et al., 2020; Király et al., 2017). Hendrikse and Limniou (2024) also found only a weak association between the time of use and problematic use of TikTok in a comprehensive model. Problematic TikTok use can be viewed as a subcategory of problematic social media use (Günlü et al., 2023), which may be characterized by addiction-related symptoms (e.g., tolerance, withdrawal; Griffiths, 2005). Although the terms “problematic use” and “addiction” are often used interchangeably in the literature, addictions are established by use of clinical diagnostic criteria. Problematic behaviors, often quantified by self-report measures, share similar features and symptoms to addictions, but problematic use may be less severe and more transient (Billieux et al., 2015). According to Perales et al. (2020), compulsivity (urge, craving, loss of control) is a core element of behavioral addiction, while problematic use may include performing a goal-driven behavior (to seek pleasure or relief) without a strong sense of compulsion.
Based on the Person-Affect-Cognition-Execution model (I-PACE; Brand et al., 2019), individual predisposing factors and vulnerabilities, such as psychological distress, can deteriorate behavioral control functions and foster maladaptive coping strategies, leading to inadequate affective and cognitive responses in psychologically challenging situations (e.g., cue-induced craving), which can ultimately contribute to the development of addictive use patterns in relation to rewarding activities. Psychological distress can also drive some individuals to seek gratification through online activities (Katz et al., 2024) and alleviate negative mood. While such gratification may provide short-term relief, it can gradually develop into a maladaptive strategy to cope with daily life challenges (e.g., engaging in online social interactions to forget about real-life social conflicts), potentially leading to excessive or problematic use over time (Brand et al., 2019). However, a recent study in relation to problematic gaming emphasized that even excessive amounts of time spent with an activity (e.g., 26 hours a week) can be associated with good mental health for most individuals (Katz et al., 2024), indicating that while extensive use time was found to be associated with problematic use in most studies (Laconi et al., 2017), prolonged use time should not be considered as a major contributing factor fueling the addictive process, and the two use patterns, although associated, should be distinguished in empirical investigations to draw a clearer picture of the divergent predictors (Katz et al., 2024). The role of possible predictors (e.g., indicators of psychological distress, such as symptoms of depression and anxiety) can also vary based on individual characteristics, such as personality traits or socioeconomic circumstances (Griffiths, 2010). Therefore, while there may be a considerable overlap between the predictors of extensive and problematic TikTok use (since the two use patterns are associated), the predictive power of possible explanatory factors may differ across extensive and problematic use.
Studies of problematic TikTok use have shown its relation to certain demographics (e.g., gender and age) and negative psychological and behavioral states (e.g., psychological distress and body image concerns). Regarding demographics, younger age was associated with a higher propensity of frequent (Montag et al., 2021) and problematic TikTok use (Yao et al., 2023). Additionally, recent studies have found a higher occurrence of extensive (Gentzler et al., 2023) and problematic TikTok use among female compared to male adolescents (Sha & Dong, 2021), which concurs with the results of a recent meta-analysis showing that women appear to be more susceptible to problematic social media use compared to men (W. Su et al., 2020). Therefore, it can be expected that female gender and younger age would be associated with both extensive use time and problematic use of TikTok.
Research on TikTok use has often lacked examination of extensive and problematic use in a comprehensive model. With regard to negative psychological states, problematic TikTok use has been associated with symptoms of depression, anxiety, and stress (Sha & Dong, 2021; Yao et al., 2023), loneliness (Smith & Short, 2022), attention problems, and poorer academic performance (Chao et al., 2023). Moreover, a recent study has found a negative association between problematic TikTok use and body appreciation, mediated by physical appearance perfectionism (O’Connor et al., 2024). Frequent TikTok use was also associated with depressive symptoms in adolescents (Gentzler et al., 2023), and body dissatisfaction, mediated by body surveillance and upward appearance comparison among young women (Mink & Szymanski, 2022). Content analyses of wellness/health videos and associated comments on TikTok show a strong focus on dieting, messages that promote thinness, appearance comparison (Hu et al., 2023), and body dissatisfaction (Raiter et al., 2023). Experimental studies have supported the influence of body-focused TikTok videos on body dissatisfaction (Pryde & Prichard, 2022; Westenberg & Oberle, 2023). However, these studies did not investigate extensive (nonproblematic) and problematic TikTok use in one comprehensive model. Previous studies have demonstrated that when the time of use was contrasted with problematic use in one complex model, the association of psychological problems with frequent use diminished or were considerably reduced (see Király et al., 2017; Zsila et al., 2024). Based on these findings, it can be expected that negative body image and symptoms of depression, anxiety, and stress will be more strongly associated with problematic TikTok use than with extensive time of use.
With regard to specific TikTok activities, Yao et al. (2023) found that the way users engage with TikTok (e.g., viewing short videos passively or interacting with others during live streaming) can be associated with nonproblematic or problematic TikTok use. Indeed, while certain use patterns can be viewed effectual with positive perceived consequences for the user (e.g., achieving personal goals via communication), other activities can be ineffectual (e.g., passive consumption of digital content without purpose) or problematic, which could be associated with psychological difficulties (Nawaz, 2024). Therefore, it is important to consider different use patterns and activities when estimating the risk of problematic engagement.
The Present Study
According to recent estimates, only 5–9% of TikTok users could be at risk of problematic use (Smith & Short, 2022; C. Su et al., 2021). This study aims to provide further estimations of users at risk of problematic use in a Hungarian context. For this purpose, a brief and psychometrically sound measurement instrument is constructed in the first step, which can identify individuals potentially at risk of problematic use. According to Ryan et al. (2014), platform-specific assessment instruments, such as measures designed to assess specifically problematic TikTok use, can facilitate a more accurate measurement of context-specific behaviors in the online sphere, offering deeper insights into platform-specific use patterns. This study also endeavors to clarify the distinction between extensive (non-problematic) use and problematic use of TikTok by exploring possible convergent and divergent associations of nonproblematic and problematic use patterns in the second step. Besides well-established correlates (i.e., demographics and negative psychological states), the present study extends the scope of previous investigations to the possible correlates of problematic and extensive use time among popular TikTok activities (e.g., exploring the Discover page, reading comments). Therefore, possible predictors of extensive and problematic TikTok use are explored in three steps (i.e., demographics, indicators of psychological distress, and TikTok activities). To date, no studies have investigated the role of TikTok activities in recreational and problematic use patterns, although the early identification of risky use patterns can possibly contribute to a more efficient prevention of problematic use. Overall, this study aims to enhance current understanding of potentially problematic TikTok use.
Methods
Participants and Procedure
Participants were recruited from thematic social media groups focusing on TikTok-related content, gossip, and social relationships (e.g., friendships and dating). Group members were invited to complete an online questionnaire on TikTok use habits via a public post. Data collection was conducted between November 2021 and December 2022. Participation was completely voluntary and anonymous. Informed consent was obtained from all participants. Underage respondents (those between 14 and 18 years of age) were asked to provide parental consent. Ethical approval was granted by the Institutional Review Board of the first author’s university. The research protocol adhered to the Declaration of Helsinki.
A total of 1,210 participants started to fill out the online questionnaire. Respondents who did not complete at least 50% of the questionnaire (n = 283) and reported not using TikTok (n = 309) were excluded from further analysis. Therefore, the final sample consisted of 618 TikTok users (80.10% women, 18.77% men, 1.13% other; Mage = 22.10 years, SD = 4.17, age range: 14–63 years). Detailed sociodemographic characteristics are presented in Table A1. Participants spent 1.64 hours (SD = 1.34) on TikTok on an average weekday and 1.97 hours on an average weekend day (SD = 1.56). The most popular activities on TikTok were exploring the For You page and reading comments to others’ videos (see a detailed overview in Table A2).
Measures
Extensive TikTok use time was measured by two questions: Approximately how much time do you spend on TikTok on an average weekend day/weekday? Response options were 0 = no time, 0.5 = less than half an hour a day, 1.5 = 1–2 hours a day, 3.5 = 3–4 hours a day, 5.5 = 5–6 hours a day, 6.5 = more than 6 hours a day. A comprehensive variable was created by averaging weekday (*5) and weekend day (*ˇ2) use time to gain an average time of use (/7) per day in hours.
TikTok activities were assessed by the question: How often do you engage in the activities below when you use TikTok? Activities are listed in Table A2. Response options were 1 = never or almost never, 2 = rarely, 3 = often, 4 = always or almost always.
Problematic TikTok use was measured using the Problematic TikTok Use Questionnaire (PTUQ) developed in this study. Originally, 12 items were constructed based on the six-component model of addiction by Griffiths (2005). Therefore, two items represented each component (i.e., salience, mood modification, relapse, tolerance, withdrawal, and conflict). Item content was created based on existing measurement instruments with similar conceptual framework and structure such as the Bergen Facebook Addiction Scale (BFAS; Andreassen et al., 2012), the Bergen Social Media Addiction Scale (BSMAS; Bányai et al., 2017), and the Problematic Use of Twitch Scale (PUTS; Zsila et al., 2024).The aim of this study was to construct a brief, unidimensional, 6-item assessment instrument of the initial item pool which comprises each component of the six-component model (Griffiths, 2005). Items were rated on a 5-point Likert-scale (1 = never, 2 = rarely, 3 = sometimes, 4 = often, 5 = always). Higher scores indicate more symptoms of problematic TikTok use.
Symptoms of smartphone addiction were assessed using the 10-item Smartphone Addiction Scale (SAS; Kwon et al., 2013). Items were rated using a 6-point Likert-scale (from 1 = strongly disagree to 6 = strongly agree). Higher scores indicate more symptoms of smartphone addiction (α = .84).
Body image state was assessed using the 6-item Body Image States Scale (BISS; Cash et al., 2002), which measures the extent to which a person has favorable body image at the moment in terms of overall physical appearance, body size and shape, weight, physical attractiveness, looks relative to others, and appearance relative to an average person. Items were rated on 9-point, bipolar scales (e.g., ranging from 1 = extremely dissatisfied to 9 = extremely satisfied). Higher scores indicate more favorable body image (α = .77).
Depression, anxiety, and stress levels were assessed using the three-factor, 21-item Depression, Anxiety, Stress Scales (DASS-21; Lovibond & Lovibond, 1995) with regard to the past two weeks. Participants rated each item on a 4-point scale (0 = did not apply to me at all, 3 = applied to me very much, or most of the time). A total score was computed of the 21 items (Yusoff, 2013). Higher scores reflect higher psychological distress composed of symptoms related to depression, anxiety, and stress (α = .95).
Forward and backward translation of measures from English to Hungarian were performed by four members of the research team who are experts in scale development and cross-cultural validation of self-report assessment instruments.
Statistical Analysis
Data analysis was conducted using SPSS v21.0 and Mplus 7.4 (Muthén & Muthén, 2017). Anonymous data underlying the present research is available from: https://osf.io/k4n5p/. The reported data and results in the current study have not been, nor will be, published in whole or in part by any other journal and is under consideration for publication elsewhere. The dataset is completely exclusive to this manuscript.
Psychometric properties of the PTUQ were investigated in terms of factor structure, reliability, and convergent validity. First, factor structure was examined using exploratory factor analysis (EFA) with geomin rotation, and confirmatory factor analysis (CFA) with mean and variance-adjusted weighted least squares estimator (WLSMV), which is commonly used for non-normally distributed and categorical data (Finney & DiStefano, 2013). For this investigation, the total sample was randomly split in half (n = 309 for both the EFA and the CFA) to gain two independent subsamples. General thresholds for model fit acceptance were applied (Bentler, 1990; Brown, 2015): the Comparative Fit Index (CFI ≥ .95 for excellent, ≥ .90 for acceptable), the Tucker-Lewis Index (TLI ≥ .95 for excellent, ≥ .90 for acceptable) and the Root-Mean-Square Error of Approximation (RMSEA ≤ .06 for excellent, ≤ .08 for acceptable) with its 90% confidence interval. For reliability, Cronbach’s alpha and McDonald’s omega values above .60 were acceptable (Hair et al., 2019; McDonald, 1970). The SAS was used to confirm convergent validity, considering that the overlap between the item content of the PTUQ and measures of problematic social media use (e.g., the BSMAS) would be high based on the development process of the PTUQ.
To estimate the proportion of individuals potentially at risk of problematic TikTok use, latent profile analysis (LPA) was conducted on the final, six items of the PTUQ, using the total sample (N = 618). Four possible models were tested (from two to five possible classes). Besides theoretical meaningfulness, the following indices were considered to select the final model: entropy values close to 1, and lower levels of the Akaike information criterion (AIC), bias-corrected Akaike information criterion (CAIC), Bayesian information criterion (BIC), and sample-size adjusted Bayesian information criterion (SSABIC). Moreover, a nonsignificant p-value (p < .05) of the Lo-Mendell-Rubin Adjusted Likelihood Ratio Test (LMR Test) indicated that the model with one fewer class should be retained (Muthén & Muthén, 2017). To determine an optimal cutoff-point on the six-item PTUQ, sensitivity, specificity, positive (PPV) and negative predictive value (NPV), and accuracy for PTUQ cut-off scores were estimated (Altman & Bland, 1994a, 1994b; Glaros & Kline, 1988).
Finally, a structural equation model (SEM) was conducted to explore convergent and divergent predictors of extensive and problematic TikTok use using indicators of psychological distress (i.e., body image state and symptoms of depression, anxiety, and stress) and activities on TikTok. Due to high inter-correlations among the DASS subscales (rs ranged from .63 to .75, mean r = .70), DASS-items were defined as components of one comprehensive latent factor (i.e., depression, anxiety, and stress). Similarly, two TikTok activities, (1) making videos or live-streaming with others or alone and (2) reading comments, viewing reactions to own videos, comments (rs = .58) were merged into one variable. Such SEM models allow estimations with multiple predictors and multiple outcome variables in one analysis. To examine the predictive power of these factors to problematic and extensive TikTok use patterns, potential predictors were entered in three separate blocks. Therefore, demographic variables (i.e., gender and age) were defined as observed predictor variables in the first step, indicators of psychological distress as latent variables were separately investigated in another model in the second step, and activities on TikTok as observed variables were included separately in the third model. Extensive TikTok use time (hours per day), as an observed variable, and problematic TikTok use, as a latent variable, were defined as outcome variables, entered simultaneously in each model. A hierarchical approach was also applied to estimate the cumulative explanatory power of significant predictors of each block, thereby sequentially retaining significant predictors of each domain under investigation in three steps (see Table A7). Significant associations in the hierarchical structure were identical to the original model (Table 2). Listwise deletion was applied for missing values on exogenous variables (i.e., gender). Therefore, as the variable ‘gender’ contained seven missing cases, the models containing this variable were conducted on a sample of 611 participants (98.87% of the total sample). Bias-corrected percentile confidence intervals (95% CI) were estimated using 1,000 bootstrap replication samples.
Results
Development of the Problematic TikTok Use Questionnaire (PTUQ)
To test whether the data supports the hypothesized single-factor structure of the 12-item PTUQ, a CFA was conducted on the total sample (N = 618; see in Table A3). The model fit was poor, even for the subsequent EFA (see Table A3). As the aim of the scale construction was to develop a brief, six-item measure based on the six-component model of Griffiths (2005), instead of achieving a fitting model by reducing the item number step by step, those six items (i.e., one item/component) were selected for further analysis which yielded the highest factor loadings based on the EFA. To explore whether further modification was needed before achieving the final structure, EFA was conducted on the six items, using the first subsample (n = 309). Only the single-factor structure yielded an eigenvalue above 1.00 (4.24, respectively), with acceptable fit: χ2 = 21.978, df = 9, p = .009, CFI = .992, TLI = .986, RMSEA = .068 [90% CI = .032–.105], which was confirmed in the subsequent CFA (n = 309; χ2 = 19.716, df = 9, p = .020, CFI = .992, TLI = .987, RMSEA = .062 [90% CI = .024–.100]; see Table 1). Inter-item correlations ranged from .35 to .58 (mean r = .44). Cronbach’s alpha was .83; McDonald’s omega was .82. Spearman-correlation showed a moderate, positive association between PTUQ scores and scores on a similar measure (i.e., the SAS) assessing symptoms of smartphone addiction (rs = .44, p < .001), supporting convergent validity.
Table 1. Item Content, Factor Structure, and Psychometric Properties of the Problematic TikTok Use Questionnaire (PTUQ).
|
Please think back to the past 12 months and indicate on the following scale how often you experienced these things in relation to your TikTok use. 1 – never, 2 – rarely, 3 – sometimes, 4 – often, 5 – always |
|||
|
Item content |
Symptom (Griffiths, 2005) |
EFA (n = 309) |
CFA (n = 309) |
|
1. How often have you felt that TikTok is one of the most important parts of your life? |
salience |
.857 |
.787 |
|
2. How often have you used TikTok to reduce feelings of depression and distress? |
mood modification |
.693 |
.744 |
|
3. How often have you tried to reduce the time spent using TikTok without success? |
relapse |
.728 |
.643 |
|
4. How often have you felt that you had to spend more and more time on TikTok to feel satisfied? |
tolerance |
.848 |
.856 |
|
5. How often have you become irritable when something prevented you from using TikTok? |
withdrawal |
.912 |
.874 |
|
6. How often have you neglected your family, partner, or friends because of TikTok? |
conflict |
.808 |
.742 |
|
Note. The total sample (N = 618) was randomly half-split to conduct the EFA (n = 309) and the subsequent CFA (n = 309) on independent subsamples. Scores on the six-item PTUQ can range from 6 to 30 after summing the items. Mean score was 10.45 (SD = 4.05, skewness = 1.56, kurtosis = 3.33) on the total sample (N = 618). |
|||
Subsequently, LPA was conducted on the final, six-item PTUQ (see Table A4). Based on the LMR Test, the three-class model was retained. In this model, individuals were classified to three classes: 1) high-risk users scoring high on all items (3.88%), 2) average risk users with slightly lower scores on all items than high-risk users (14.56%), and 3) low-risk users with relatively low item scores (81.55%; see Figure A1). The high-risk class was used as a gold standard for subsequent calculations of PPV, NPV, and accuracy of measurement using the possible cutoff-scores. Based on these indices, the score of 21 was selected as an optimal cutoff-point (see Table A5). Based on this cutoff-point, 3.07% of TikTok users (n = 19) in this sample could be at risk of problematic TikTok use, of which 84.2% were women.
Convergent and Divergent Predictors of Extensive and Problematic TikTok Use
Demographics were entered in the SEM model in the first step (see Table 2). Gender (i.e., being a woman) was a weak and inconsistent predictor of extensive and problematic TikTok use across the models (see Table 2 and Table 3). Symptoms of depression, anxiety, and stress were positively associated with both extensive use time and problematic use. However, these associations were significantly higher for problematic use, compared to extensive use time, based on the non-overlapping CIs. Body image did not predict either form of TikTok use. Indicators of psychological distress explained only 7% of the total variance of extensive TikTok use time, while the explanatory power of the predictors was somewhat greater for problematic use (25%). TikTok activities were investigated in the final model, in which exploring the For You page, reading comments to others’ videos, making own videos or reading reactions to these videos, and using the chat predicted both extensive and problematic TikTok use. No significant difference could be observed in the strength of these associations across extensive use time and problematic use. All types of activities positively predicted the occurrence of symptoms of problematic TikTok use. The strongest predictors of both extensive use time and problematic TikTok use were exploring the For You page and reading comments to others’ videos. TikTok-activities explained a smaller proportion of the total variance of extensive TikTok use time (19%), while the explanatory power of these factors was notable in problematic TikTok use (32%). The association between extensive use time and problematic TikTok use was moderate in Model I and II, and weak in Model III. The cumulative explanatory power of significant predictors in the hierarchical model (see Table 3) was 24% in the total variance of extensive TikTok use time, and 45% in problematic TikTok use. The associations across the original model with separate blocks (Table 2) and the final hierarchical model (Table 3) were similar, except for gender, which was not a significant predictor of either extensive or problematic TikTok use in the final hierarchical model. A graphical depiction of the SEM models is presented in Figure 1.
Table 2. Structural Equation Models Exploring the Predictors of Extensive Use Time and Problematic TikTok Use Separately by Domains
(i.e., Demographics, Psychological Distress and Body Image, and TikTok-Activities).
|
Predictor variables |
Outcome variables |
|||||||
|
|
Extensive TikTok use time (hours per day) |
Problematic TikTok use |
||||||
|
|
β |
SE |
95% CI |
R2 |
β |
SE |
95% CI |
R2 |
|
Model I |
|
|
|
.03 |
|
|
|
.03 |
|
Gender |
.14*** |
0.05 |
.07, .20 |
|
.16** |
0.05 |
.06, .26 |
|
|
Age |
−.11 |
0.07 |
−.22, .06 |
|
−.05 |
0.09 |
−.23, .11 |
|
|
Model II |
|
|
|
.07** |
|
|
|
.25*** |
|
Body image state |
−.02 |
0.05 |
−.12, .08 |
|
.11 |
0.06 |
−.01, .22 |
|
|
Depression, anxiety, and stress |
.25*** |
0.05 |
.15, .35 |
|
.54*** |
0.05 |
.44, .63 |
|
|
Model III |
|
|
|
.19*** |
|
|
|
.32*** |
|
Exploring the For You page |
.22*** |
0.03 |
.16, .28 |
|
.21*** |
0.05 |
.10, .31 |
|
|
Exploring the Discover page |
.05 |
0.04 |
−.03, .13 |
|
.15** |
0.04 |
.06, .23 |
|
|
Viewing content creators’ videos, live streaming, or profiles |
.07 |
0.04 |
−.02, .14 |
|
.13** |
0.04 |
.05, .20 |
|
|
Reading comments to others’ videos |
.21*** |
0.04 |
.14, .30 |
|
.28*** |
0.04 |
.20, .36 |
|
|
Making videos or live-streaming with others or alone, or reading comments, viewing reactions to own videos, comments |
.11* |
0.05 |
.02, .21 |
|
.17*** |
0.05 |
.08, .25 |
|
|
Sending message or chatting via the application’s chat function |
.14** |
0.04 |
.07, .22 |
|
.16*** |
0.04 |
.08, .25 |
|
|
Note. *** p < .001, ** p < .01, * p < .05. N = 611 for Model I, and N = 618 for Model II and Model III. Gender was coded as 1 = men, 2 = women. CI = confidence interval based on 1,000 bootstrapped samples. Correlations between extensive and problematic use were r = .48, p < .001 in Model I; r = .43, p < .001 in Model II, and r = .33, p < .001 in Model III. Model fit was acceptable across the models: χ2 = 116.150, df = 24, p < .001, CFI = .967, TLI = .951, RMSEA = .079 [90% CI = .065–.094] for Model I; χ2 = 1,951.717, df = 522, p < .001, CFI = .936, TLI = .931, RMSEA = .067 [90% CI = .063–.070] for Model II; and χ2 = 106.517, df = 44, p < .001, CFI = .970, TLI = .957, RMSEA = .048 [90% CI = .036–.060] for Model III. |
||||||||
Table 3. The Final Model of the Hierarchical SEM Model Exploring the Predictors of Extensive Use Time and Problematic TikTok Use.
|
Predictor variables |
Outcome variables |
|||||||
|
|
Extensive TikTok use time (hours per day) |
Problematic TikTok use |
||||||
|
|
β |
SE |
95% CI |
R2 |
β |
SE |
95% CI |
R2 |
|
|
|
|
|
.24*** |
|
|
|
.45*** |
|
Gender |
.06 |
0.04 |
.00, .11 |
|
.08 |
0.05 |
−.003, .17 |
|
|
Depression, anxiety, and stress |
.16*** |
0.04 |
.09, .21 |
|
.36*** |
0.04 |
.29, .41 |
|
|
Exploring the For You page |
.22*** |
0.03 |
.15, .27 |
|
.20*** |
0.05 |
.10, .28 |
|
|
Exploring the Discover page |
.06 |
0.04 |
−.01, .13 |
|
.14*** |
0.04 |
.07, .21 |
|
|
Viewing content creators’ videos, live streaming, or profiles |
.06 |
0.04 |
−.02, .13 |
|
.12** |
0.04 |
.04; .19 |
|
|
Reading comments to others’ videos |
.22*** |
0.04 |
.15, .29 |
|
.27*** |
0.05 |
.19, .34 |
|
|
Making videos or live-streaming with others or alone, or reading comments, viewing reactions to own videos, comments |
.11* |
0.05 |
.02, .19 |
|
.16*** |
0.04 |
.07, .24 |
|
|
Sending message or chatting via the application’s chat function |
.16*** |
0.04 |
.08, .22 |
|
.16*** |
0.04 |
.07, .23 |
|
|
Note. *** p < .001, ** p < .01, * p < .05. N = 611. Gender was coded as 1 = men, 2 = women. CI = confidence interval based on 1,000 bootstrapped samples. Correlation between extensive and problematic use was r = .29, p < .001. Model fit was acceptable: χ2 = 1,541.050, df = 530, p < .001, CFI = .953, TLI = .950, RMSEA = .056 [90% CI = .053–.059]. Only significant (p < .05) predictors were retained in this model based on the preceding models described in Table 2. The complete hierarchical SEM analysis is presented in Table A7. |
||||||||
Figure 1. Graphic Representation of the Structural Equation Models.
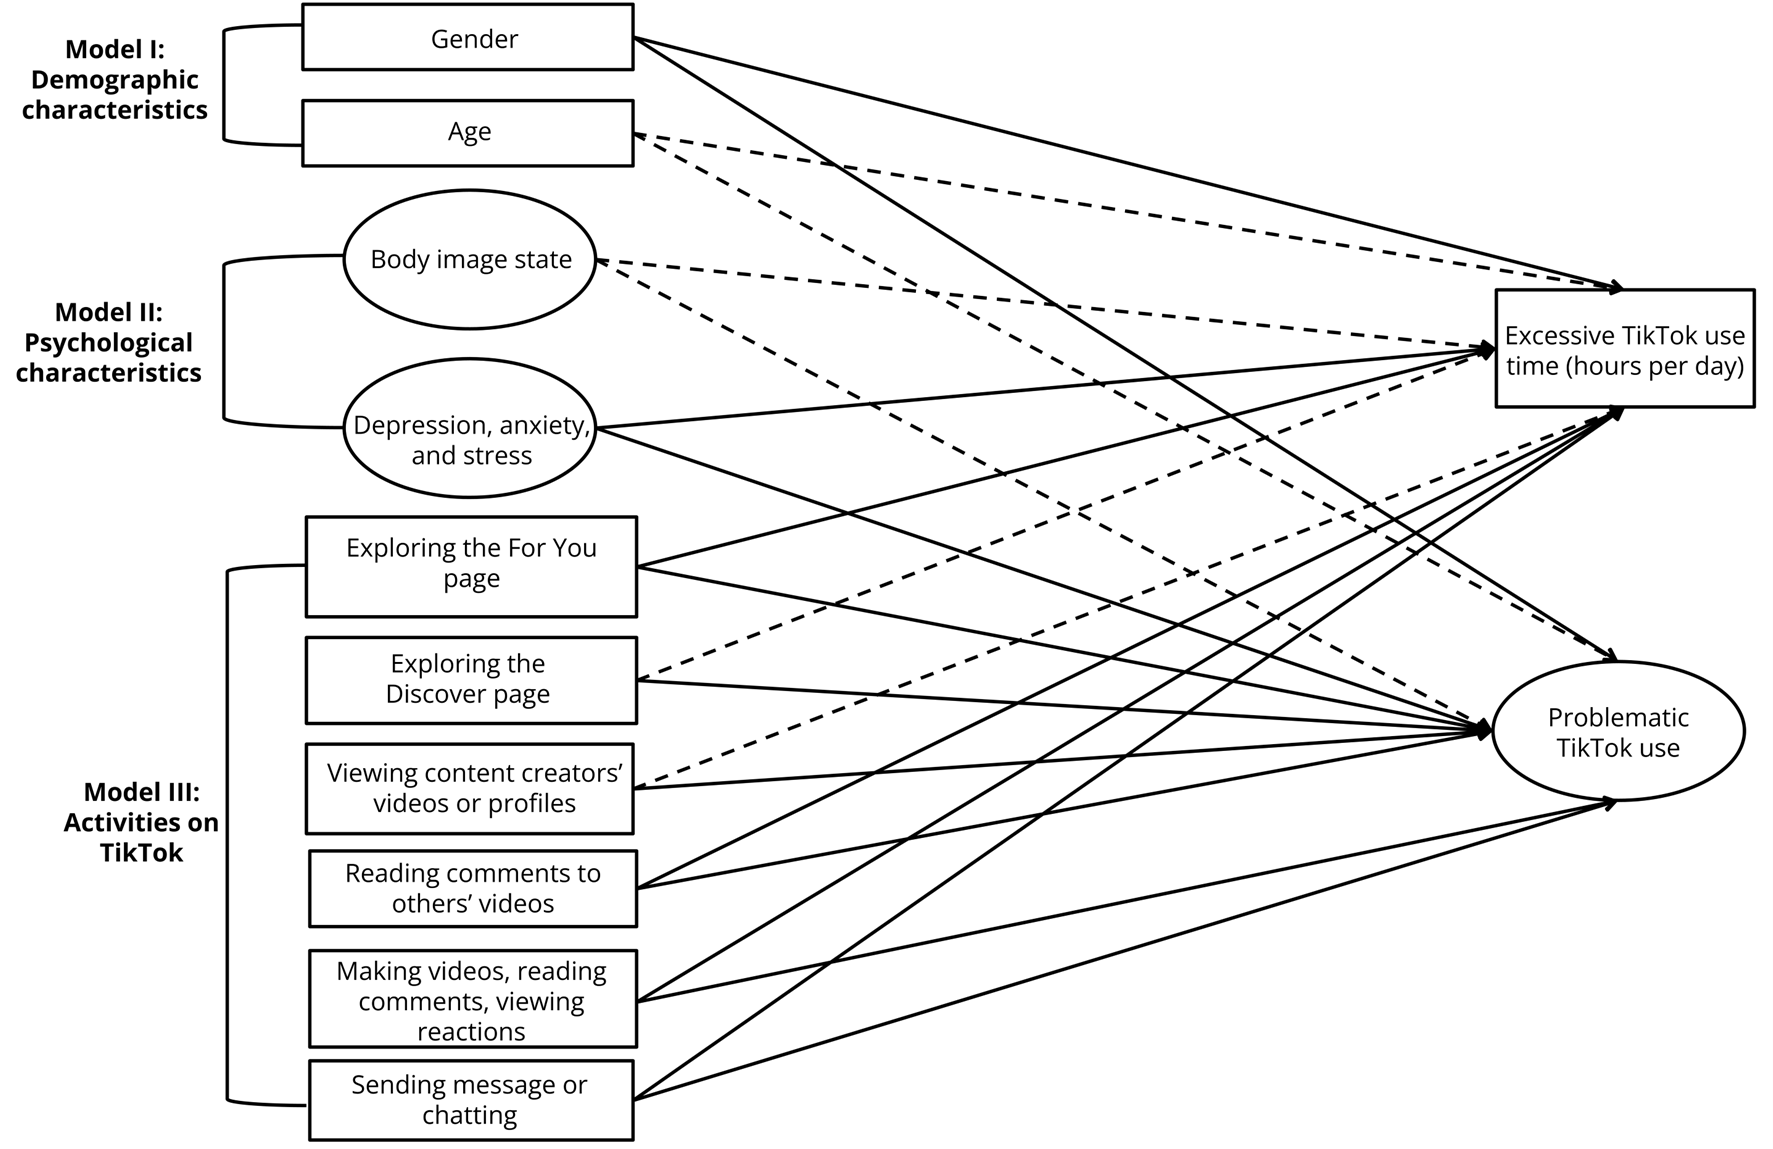
Note. Dashed arrows represent nonsignificant paths. Ovals represent latent variables, while rectangles represent observed variables.
Discussion
Compared to users of other social media applications (e.g., WhatsApp, YouTube), TikTok users report the highest levels of problematic use (Marengo et al., 2022). The novelty and entertainment value of viewing short videos on TikTok facilitate immersion in the activity and intention for reuse (Yan et al., 2023). According to the Capacity Theory of Attention (Kahneman, 1973), individuals have a limited focus of attention. Due to brevity, videos on TikTok can be easily processed, encouraging users to view these videos as a worthwhile investment for instant gratification. The huge popularity of TikTok has raised the question of whether there is a difference between extensive use time and problematic use, and what use patterns can predict problematic engagement. This study investigated the convergent and divergent predictors (i.e., demographics, indicators of psychological distress, and TikTok activities) of problematic and extensive TikTok use time. Symptoms of depression, anxiety, and stress predicted both extensive use time and problematic TikTok use; however, the association with problematic use was significantly higher than with extensive use time. Exploring the Discover page and viewing content creators’ videos, live-streaming, or profiles predicted problematic use but not extensive use time. Exploring the For You page and reading comments to others’ videos were the most powerful predictors for extensive use time and problematic TikTok use. These factors collectively explained a notable proportion of the variance of problematic TikTok use (45%), while the explanatory power was more modest for extensive use time (24%). These findings indicate that certain activities on TikTok have a stronger association with problematic use patterns than others, and the identification of these use patterns can facilitate an early screening, assisting prevention efforts.
The present study introduced a brief assessment instrument to assess problematic TikTok use, which reflects the structure of the six-component model of addiction by Griffiths (2005). Although there exist measures assessing this construct (e.g., the Problematic TikTok Use Scale, Günlü et al., 2023; the Problematic TikTok Use Scale, Smith & Short, 2022; Problematic TikTok use, Yao et al., 2023), these scales were not available at the time of the present research. Therefore, to increase measurement accuracy, a new instrument was constructed in this study. The findings supported the robust psychometric characteristics of the six-item Problematic TikTok Use Questionnaire (PTUQ). Based on the cutoff-score of 21, 3.07% of TikTok users in the present sample could be at risk of problematic use. The majority of these individuals were women (84.2%), consistent with the findings of Scherr and Wang (2021), who also reported higher addictive escapism among female TikTok users. Prevalence rates of previous studies on young adults were somewhat higher compared to the present occurrence of 3.07% (i.e., 8.7% in Smith & Short, 2022; 5.9% in C. Su et al., 2021). These studies used student samples, while the present study used a broader age range. However, the convenience sampling method still limits the generalization of these findings.
The association between extensive use time and problematic TikTok use was weak and moderate across the present models, which is in line with previous findings on the strength of association between extensive and problematic engagement in other online activities (e.g., Bőthe et al., 2020 in relation to pornography use; Király et al., 2017 in relation to gaming; Zsila et al., 2024 in relation to Twitch use). These results further support the notion that extensive use time should be differentiated from problematic use, and extensive use could be nonproblematic for several highly engaged users as suggested by Katz et al. (2024).
Convergent and divergent predictors of extensive use time and problematic TikTok use were explored. The contribution of demographics (i.e., gender and age) in explaining both forms of TikTok use was negligible (3%). These results are consistent with the findings by Smith and Short (2022), who found no age differences across problematic and nonproblematic TikTok user groups. The present findings also suggest that demographics may not be consistent correlates of extensive TikTok use time and problematic use. By contrast, symptoms of depression, anxiety, and stress were associated with both extensive use time and problematic TikTok use, although these associations were substantially stronger for problematic use. These results align with previous findings on the association of psychological distress with problematic TikTok use (Sha & Dong, 2021; Yao et al., 2023). Moreover, the present findings align with previous studies providing evidence on the robust association of depression, anxiety, and stress symptom severity with problematic social media use in general (see Shannon et al., 2022 for a review), highlighting the associations of problematic engagement with online social spheres with mental health problems. Interestingly, body image was unrelated to problematic TikTok use or extensive use time in this study. While some studies (e.g., Mink & Szymanski, 2022; Pryde & Prichard, 2022) suggested that regular use of TikTok may be harmful to body image, the proliferation of body positivity movement on TikTok could possibly contribute to the mitigation of this adverse effect (Harriger et al., 2023). Another possible explanation for the present results can be that body image states were assessed in the present investigation, which provides a picture of current body representations. Future studies measuring trait, rather than state body image may confirm previous findings on the inverse relationship between positive body image and TikTok use.
Most TikTok activities were associated with both extensive use time and problematic use in this study. However, exploring the Discover page (i.e., using a function of TikTok to search for new and popular content, hashtags, or challenges) and viewing others’ videos, profiles, or live-streaming were associated only with problematic use severity. These activities are related to passive use (e.g., viewing) rather than active use (e.g., creating content) since they lack reciprocity. According to the Extended Active-Passive Model of Social Networking Sites Use (Verduyn et al., 2022), reciprocal online activities are associated with greater psychological well-being, while self-relevant and success-focused passive content viewing can negatively impact well-being through social comparison. If the content offered by the algorithm is self-relevant (e.g., personalized preferences on the Discover page), it may lead to social comparison, which can decrease well-being. However, it is also possible that content about others’ failures leads to downward social comparisons, which may be gratifying for the user, contributing to a higher tolerance level, and thereby, problematic use in the longer run.
The strongest predictors of both extensive use time and problematic TikTok use were exploring the For You page and reading comments to others’ videos. Exploring the For You page was the most common activity in the present TikTok user sample. Notably, this exploration tends to be passive rather than goal-driven. Previous research also demonstrated that passive video viewing is associated with problematic use (Yao et al., 2023). In line with these studies, C. Su et al. (2021) investigated brain activity in an fMRI experiment while viewing personalized, algorithm-driven TikTok content compared to non-personalized content and found that the personalized content was more likely to activate the ventral tegmental area, which has been associated with addiction and reward learning. Therefore, the For You page, with its personalized feed of videos based on users’ preferences, can maintain users’ attention, which can lead to prolonged, and in some cases, compulsive use. Moreover, reading others’ opinions was described as a major source of entertainment (Springer et al., 2015), which can also explain why reading comments on TikTok is rewarding for users. Overall, these factors collectively explained a much larger proportion of the variance of problematic TikTok use severity (45%) than of extensive TikTok use time (24%).
A major limitation of this study is that, due to the convenience sample, the findings reflect only the characteristics of this sample and cannot be generalized to the whole population of Hungarian adults. Additionally, the high proportion of female TikTok users in the present sample further limits generalizability of the findings to the general population. As the sample consisted of mostly adolescents and young adults, age-related findings in this study should be interpreted with caution. Therefore, the estimation of individuals at risk of problematic TikTok use should be interpreted cautiously. Another limitation is that, due to the cross-sectional nature of the study design, conclusions regarding causal relationships cannot be drawn. Thus, it remains unclear whether indicators of psychological distress and certain activities on TikTok are antecedents or consequences of extensive use time and problematic use of TikTok. Furthermore, body image states were measured in this study, which limits the extension of current perceptions to long-term attitudes towards the body. This measurement can potentially explain the lack of association between body image and TikTok use in this study. Further evidence for the validity of the PTUQ is also needed (e.g., discriminant validity) in different cultural settings. Moreover, the proportion of explained variance for extensive TikTok use time was modest, suggesting that some important correlates of prolonged but nonproblematic use were not identified in this study. In relation to this concern, the selection of the focus of this study (i.e., demographics and psychological problems) was based on existing evidence in the literature (e.g., Mink & Szymanski, 2022; Sha & Dong, 2021; Yao et al., 2023) to provide an empirical basis for the current investigation. In addition to previous findings, the present study broadened the scope of investigation to platform-specific activities. However, it was not possible to cover all possible risk factors of problematic use in this study. Therefore, future studies should explore the role of other factors, such as personality characteristics, social cognition, and coping strategies in TikTok use patterns to provide a more comprehensive picture of possible predictors.
Overall, this study contributed to a broader overview of associated factors of extensive use time and problematic TikTok use by extending the scope of previous investigations to popular TikTok activities. Moreover, the present results provided further support for women’s increased vulnerability to problematic TikTok use, which underlines the importance of screening problematic use patterns at an early stage to prevent adverse effects in this population. The early identification of preferences towards certain TikTok activities could enable early screening of potentially risky use patterns, predictive of problematic use. This early recognition can facilitate mindful use of social media, which was found to be a protective factor against problematic use of social media and associated psychological distress (Shabahang et al., 2024). The present study also provided a brief, reliable and valid assessment instrument (PTUQ) to measure problematic TikTok use, which allows for a more accurate assessment of problems associated with TikTok use. Ryan et al. (2014) suggested that platform-specific assessment tools can enhance understanding of the context-specific characteristics of a computer-mediated behavior. Based on the suggested cutoff-point of 21, only 3.07% of TikTok users could be identified at risk of problematic use in this study, suggesting that extensive use time of TikTok remains a nonproblematic leisure activity for the vast majority of users. However, some use patterns (e.g., prolonged time using the Discover function, or viewing others’ videos, live-streaming, or profiles) can be predictive of potentially problematic use. Although the PTUQ is not appropriate for clinical use and diagnostic purposes, the early identification of potentially risky levels of engagement with TikTok can assist prevention efforts and inform users of the need to change their use habits to prevent problems associated with TikTok use in the future (e.g., interference with academic or work commitments, social relationships, or other leisure activities). Future longitudinal research investigating use patterns in more depth can draw a more nuanced picture of the role of TikTok use habits in the development of problematic behavior.
Conflict of Interest
The authors have no conflicts of interest to declare.
Use of AI Services
The authors declare they have not used any AI services to generate or edit any part of the manuscript or data.
Acknowledgement
We would like to thank Péter Marti and the Media Psychology Research Group for their valuable assistance and advice in this project.
Funding Details
GO was supported by the ANR grant of the Chaire Professeur Junior of Artois University and by the Strategic Dialogue and Management Scholarship (Phase 1 and 2).
Data Availability Statement
Anonymous data underlying this research is available at https://osf.io/k4n5p/.
Appendix
Table A1. Sociodemographic Characteristics
of the Sample (N = 618).
|
Gender |
N (%) |
|
Female |
495 (80.10%) |
|
Male |
116 (18.77%) |
|
Other |
7 (1.13%) |
|
Age (years) |
|
|
< 19 |
42 (6.80%) |
|
19 |
82 (13.27%) |
|
20 |
116 (18.77%) |
|
21 |
105 (16.99%) |
|
22 |
70 (11.33%) |
|
23 |
58 (9.39%) |
|
24 |
40 (6.47%) |
|
25 |
25 (4.05%) |
|
26 |
22 (3.56%) |
|
27 |
10 (1.62%) |
|
28 |
10 (1.62%) |
|
29 |
6 (0.97%) |
|
30 |
11 (1.78%) |
|
> 30 |
21 (3.40%) |
Table A2. Frequency of TikTok Activities in the Sample (N = 618).
|
|
Frequency of use n (%) |
|||
|
Activity when using TikTok |
Always or almost always |
Often |
Rarely |
Never or almost never |
|
Exploring the For You page |
419 (67.80%) |
111 (17.96%) |
48 (7.77%) |
40 (6.47%) |
|
Exploring the Discover page |
31 (5.02%) |
64 (10.36%) |
168 (27.18%) |
355 (57.44%) |
|
Viewing content creators’ videos, live-streaming, or profiles |
16 (2.59%) |
79 (12.78%) |
246 (39.81%) |
277 (44.82%) |
|
Reading comments to others’ videos |
72 (11.65%) |
234 (37.86%) |
184 (29.77%) |
128 (20.71%) |
|
Making videos or live-streaming with others or alone |
5 (0.81%) |
22 (3.56%) |
79 (12.78%) |
512 (82.85%) |
|
Reading comments, viewing reactions to own videos, comments |
8 (1.29%) |
34 (5.50%) |
42 (6.80%) |
534 (86.41%) |
|
Sending message or chatting via the application’s chat function |
35 (5.66%) |
97 (15.70%) |
157 (25.40%) |
329 (53.24%) |
Table A3. Items and Factor Loadings of the Initial, 12-Item Version of the Problematic TikTok Use Questionnaire (PTUQ).
|
Item content |
Component of addiction (Griffiths, 2005) |
EFA (n = 309) |
CFA (N = 618) |
|
1. How often have you thought about TikTok? |
salience |
.779 |
.771 |
|
2. How often have you felt that TikTok is one of the most important parts of your life? |
salience |
.854 |
.821 |
|
3. How often have you used TikTok to reduce feelings of depression and distress? |
mood modification |
.898 |
.918 |
|
4. Have often have you used TikTok to get rid of negative feelings? |
mood modification |
.874 |
.903 |
|
5. How often have you tried to reduce the time spent using TikTok without success? |
relapse |
.749 |
.714 |
|
6. How often have you tried to resist your urge to use TikTok? |
relapse |
.601 |
.567 |
|
7. How often have you spent more time on TikTok than initially intended? |
tolerance |
.660 |
.679 |
|
8. How often have you felt that you had to spend more and more time on TikTok to feel satisfied? |
tolerance |
.793 |
.788 |
|
9. How often have you felt that you missed TikTok greatly when you didn’t use it for a while? |
withdrawal |
.849 |
.829 |
|
10. How often have you become irritable when something prevented you from using TikTok? |
withdrawal |
.896 |
.866 |
|
11. How often have you given up on other hobbies or leisure activities in order to use TikTok? |
conflict |
.799 |
.727 |
|
12. How often have you neglected your family, partner, or friends because of TikTok? |
conflict |
.807 |
.760 |
|
Note. Items of the final, 6-item version of the PTUQ are marked in bold. The first CFA was conducted on the total sample (N = 618) to gain support for the appropriateness of the factor structure of the 12-item version PTUQ. As model fit indices did not support the 12-item, single-factor structure: χ2 = 887.938, df = 54, p < .001, CFI = .932, TLI = .916, RMSEA = .158 [90% CI = .149–.167], an EFA was conducted on the 12-item PTUQ on the first half of the randomly half-split sample (n = 309). Based on the eigenvalues of the EFA, only the single-factor structure had an eigenvalue above 1.00 (7.66, respectively). However, this factor structure did not fit the data, either: χ2 = 476.413, df = 54, p < .001, CFI = .928, TLI = .912, RMSEA = .159 [90% CI = .146–.172]. |
|||
Table A4. Fit Indices for the Latent Profile Analysis (LPA) on the Six-Item Problematic TikTok Use Questionnaire (PTUQ).
|
Classes (n) |
AIC |
CAIC |
BIC |
SSABIC |
Entropy |
LMR Test |
p |
|
2 |
8370.80 |
8470.91 |
8454.91 |
8394.58 |
0.96 |
1311.64 |
.004 |
|
3 |
7928.77 |
8065.86 |
8043.86 |
7961.32 |
0.97 |
446.11 |
.039 |
|
4 |
6768.34 |
6942.42 |
6914.42 |
6809.65 |
1.00 |
1100.79 |
.528 |
|
5 |
6630.22 |
6841.28 |
6807.28 |
6680.29 |
0.99 |
149.79 |
.465 |
|
Note. AIC = Akaike information criterion; CAIC = bias-corrected Akaike information criterion; BIC = Bayesian information criterion; SSABIC = sample-size adjusted Bayesian information criterion; LMR Test = Lo–Mendell–Rubin Adjusted Likelihood Ratio Test; p-value of the LMR Test. The final model, which was selected for further analysis based on the fit indices, is marked in bold. |
|||||||
Figure A1. Item Scores on the Six-Item Problematic TikTok Use Questionnaire (PTUQ)
in the Three Latent Classes (High-Risk, Average Risk, Low-Risk).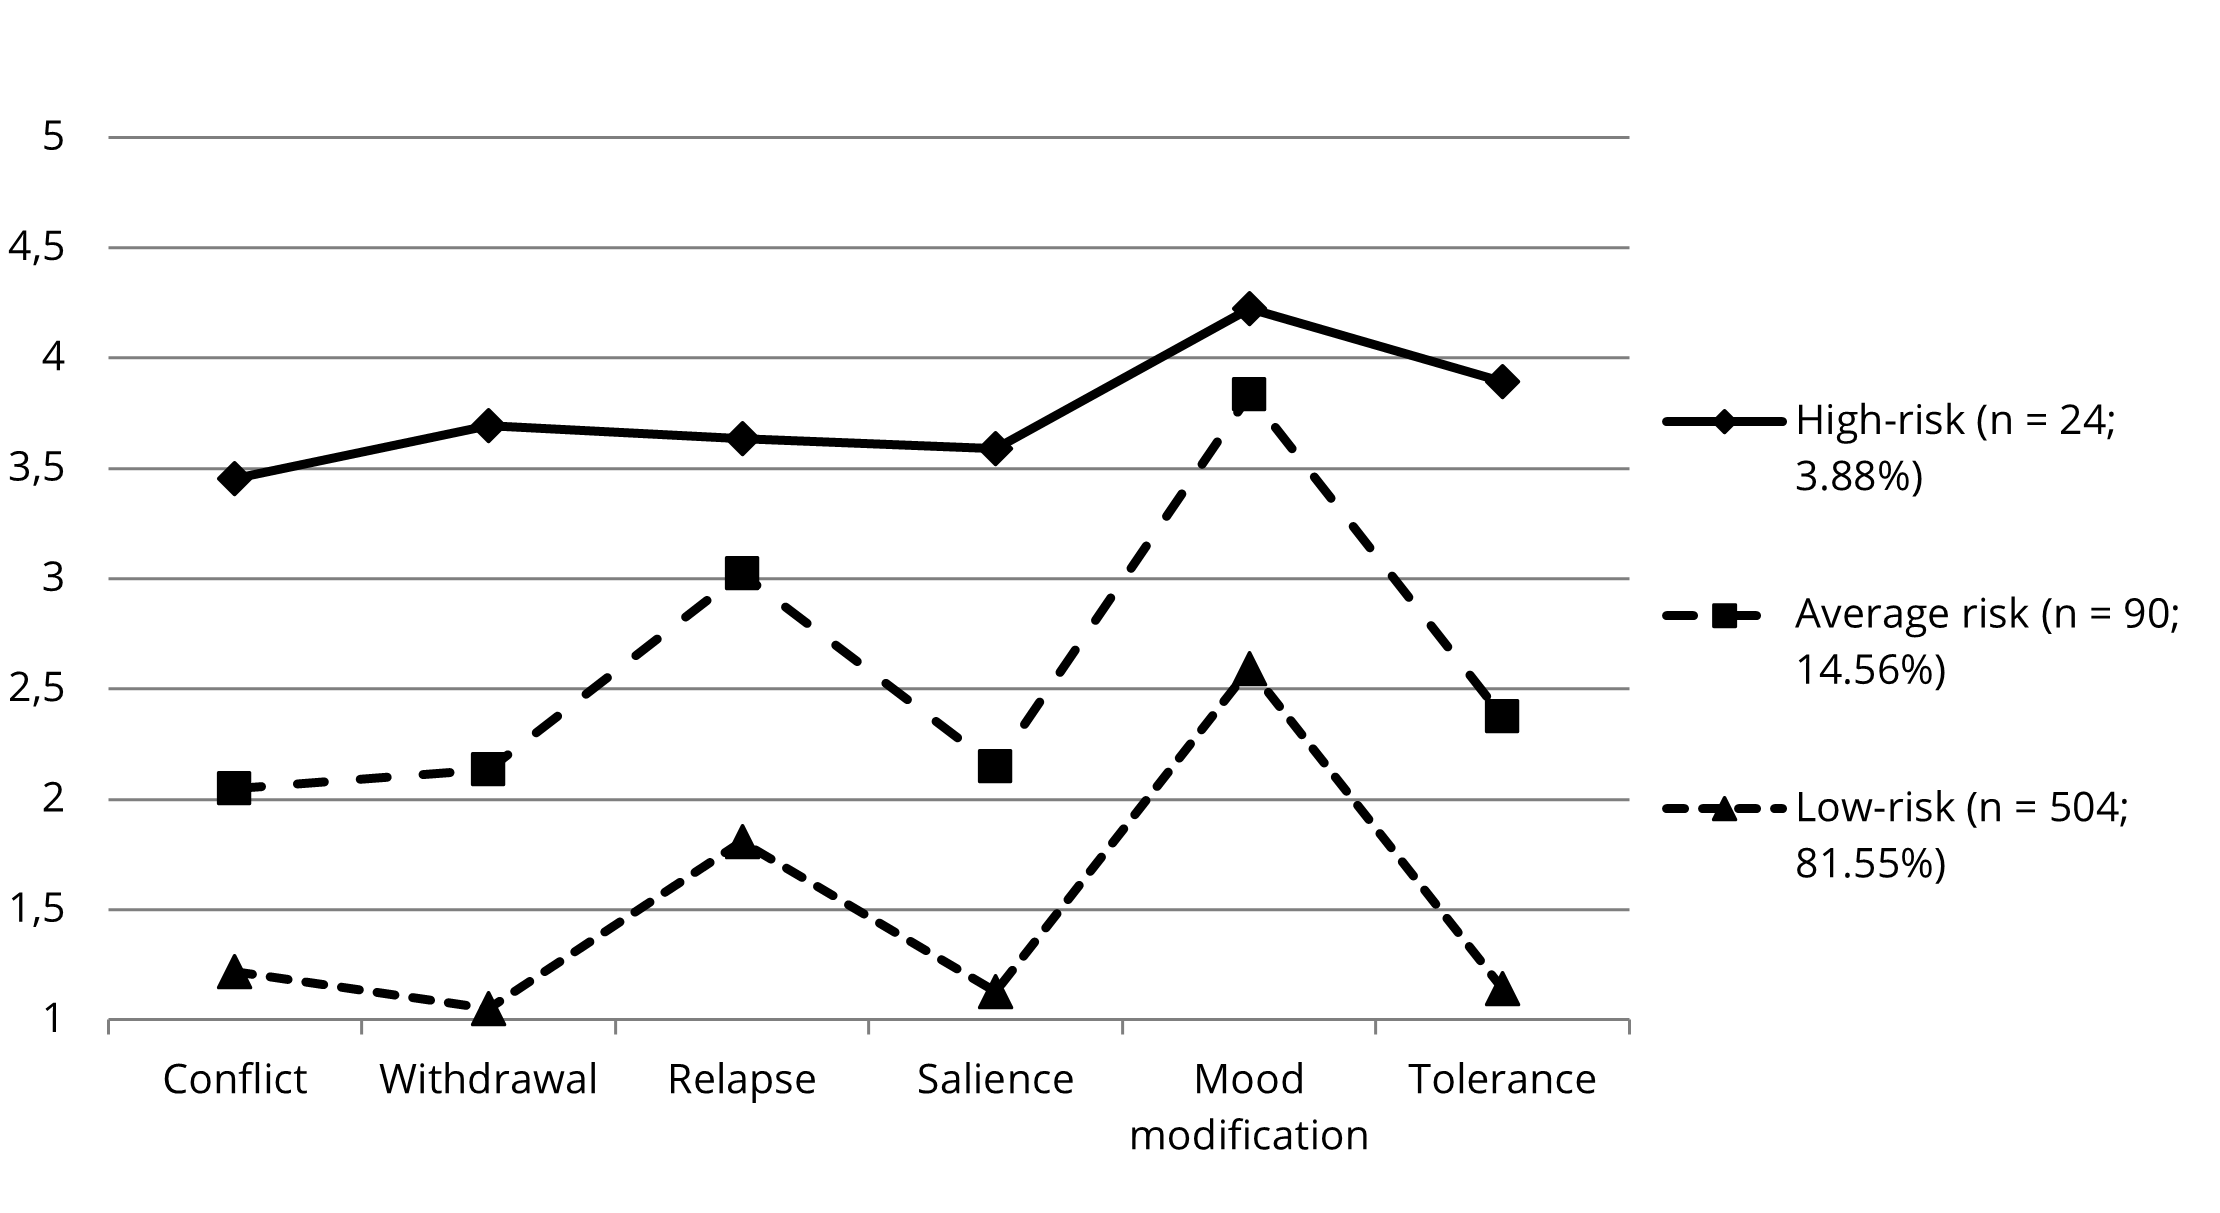
Note. Based on the distances in item scores, items representing symptoms of conflict, withdrawal, salience, and tolerance
were found to be the most effective in discriminating between groups.
Table A5. Cutoff Thresholds for the Six-Item Problematic TikTok Use Questionnaire (PTUQ).
|
Cutoff score |
True positive |
True negative |
False positive |
False negative |
Sensitivity |
Specificity |
PPV |
NPV |
Accuracy |
|
11 |
24 |
382 |
212 |
0 |
100% |
64.31% |
10.17% |
100% |
65.70% |
|
12 |
24 |
437 |
157 |
0 |
100% |
73.57% |
13.26% |
100% |
74.60% |
|
13 |
24 |
479 |
115 |
0 |
100% |
80.64% |
17.27% |
100% |
81.39% |
|
14 |
24 |
507 |
87 |
0 |
100% |
85.35% |
21.62% |
100% |
85.92% |
|
15 |
24 |
526 |
68 |
0 |
100% |
88.55% |
26.09% |
100% |
89.00% |
|
16 |
24 |
548 |
46 |
0 |
100% |
92.26% |
34.29% |
100% |
92.56% |
|
17 |
24 |
569 |
25 |
0 |
100% |
95.79% |
48.98% |
100% |
95.95% |
|
18 |
24 |
578 |
16 |
0 |
100% |
97.31% |
60.00% |
100% |
97.41% |
|
19 |
22 |
585 |
9 |
2 |
91.67% |
98.48% |
70.97% |
99.66% |
98.22% |
|
20 |
20 |
590 |
4 |
4 |
83.33% |
99.33% |
83.33% |
99.33% |
98.71% |
|
21 |
18 |
593 |
1 |
6 |
75.00% |
99.83% |
94.74% |
99.00% |
98.87% |
|
22 |
13 |
594 |
0 |
11 |
54.17% |
100% |
100% |
98.18% |
98.22% |
|
Note. PPV = positive predictive value; NPV = negative predictive value. The final cutoff threshold is marked in bold. The highest accuracy was achieved at the score of 21. Further confirming this selection, while sensitivity decreased by 8.33%, PPV increased by 11.44%, while changes in specificity and NPV were minimal compared to the score of 20. Scores on the PTUQ can range from 6 to 30. |
|||||||||
Table A6. Group Comparisons in TikTok Activities and Psychological States Across High-Risk, Average Risk,
Low-Risk Profiles Based on the LPA.
|
|
Low-risk group (n = 504) |
Average-risk group (n = 90) |
High-risk group (n = 24) |
F/χ2 |
|
Body image state |
5.33 (1.54)a |
4.83 (1.58)a |
4.89 (1.81)a |
4.54 |
|
Depression |
6.53 (5.22)a |
10.07 (5.74)b |
13.08 (5.03)b |
31.97* |
|
Anxiety |
4.68 (4.38)a |
8.22 (5.19)b |
10.54 (5.59)b |
38.80* |
|
Stress |
7.67 (5.10)a |
11.54 (5.17)b |
12.33 (5.36)b |
29.27* |
|
Exploring the For You page |
3.43 (0.92)a |
3.67 (0.75)a |
3.50 (0.78)a |
2.62 |
|
Exploring the Discover page |
1.58 (0.83)a |
1.80 (0.95)a |
2.08 (0.97)a |
6.11 |
|
Viewing content creators’ videos, live-streaming, or profiles |
1.66 (0.76)a |
1.87 (0.72)a |
2.63 (0.88)b |
20.12* |
|
Reading comments to others’ videos |
2.30 (0.94)a |
2.84 (0.82)b |
2.88 (0.74)b |
16.45* |
|
Making videos or live-streaming with others or alone |
1.17 (0.47)a |
1.27 (0.51)a |
2.08 (1.06)b |
45.53* |
|
Reading comments, viewing reactions to own videos, comments |
1.18 (0.54)a |
1.20 (0.58)a |
2.04 (1.12)b |
37.87* |
|
Sending message or chatting via the application’s chat function |
1.66 (0.88)a |
1.88 (0.91)a |
2.83 (1.01)b |
21.06* |
|
Note. To reduce the occurrence of Type I error for multiple group comparisons, the p-value was consistently set at * p < .01 in this analysis. Based on the preceding test of normality (ranges within −/+ 2 for skewness and −/+ 7 for kurtosis were considered as normally distributed data), Kruskal-Wallis test was performed for two TikTok activities (i.e., making videos or live-streaming with others or alone, and reading comments, viewing reactions to own videos, comments), while one-way ANOVA was conducted for all other variables. Identical letters in the same row represent nonsignificant difference across groups, while different letters represent significant differences across groups based on the post-hoc Tukey (for one-way ANOVA) and Mann-Whitney tests (for Kruskal-Wallis test). |
||||
Table A7. Hierarchical SEM Model Exploring the Predictors of Extensive Use Time and Problematic TikTok Use.
|
Predictor variables |
Outcome variables |
|||||||
|
|
Extensive TikTok use time (hours per day) |
Problematic TikTok use |
||||||
|
|
β |
SE |
95% CI |
R2 |
β |
SE |
95% CI |
R2 |
|
Model I |
|
|
|
.03 |
|
|
|
.03 |
|
Gender |
.14*** |
0.05 |
.07, .20 |
|
.16** |
0.05 |
.06, .26 |
|
|
Age |
−.11 |
0.07 |
−.22, .06 |
|
−.05 |
0.09 |
−.23, .11 |
|
|
Model II |
|
|
|
.08*** |
|
|
|
.26*** |
|
Gender |
.14*** |
0.03 |
.06, .20 |
|
.16** |
0.05 |
.06, .26 |
|
|
Body image state |
−.02 |
0.05 |
−.11, .09 |
|
.11 |
0.06 |
.005, .22 |
|
|
Depression, anxiety, and stress |
.24*** |
0.05 |
.13, .33 |
|
.53*** |
0.05 |
.44, .62 |
|
|
Model III |
|
|
|
.24*** |
|
|
|
.45*** |
|
Gender |
.06 |
0.04 |
.00, .11 |
|
.08 |
0.05 |
−.003, .17 |
|
|
Depression, anxiety, and stress |
.16*** |
0.04 |
.09, .21 |
|
.36*** |
0.04 |
.29, .41 |
|
|
Exploring the For You page |
.22*** |
0.03 |
.15, .27 |
|
.20*** |
0.05 |
.10, .28 |
|
|
Exploring the Discover page |
.06 |
0.04 |
−.01, .13 |
|
.14*** |
0.04 |
.07, .21 |
|
|
Viewing content creators’ videos, live streaming, or profiles |
.06 |
0.04 |
−.02, .13 |
|
.12** |
0.04 |
.04, .19 |
|
|
Reading comments to others’ videos |
.22*** |
0.04 |
.15, .29 |
|
.27*** |
0.05 |
.19, .34 |
|
|
Making videos or live-streaming with others or alone, or reading comments, viewing reactions to own videos, comments |
.11* |
0.05 |
.02, .19 |
|
.16*** |
0.04 |
.07, .24 |
|
|
Sending message or chatting via the application’s chat function |
.16*** |
0.04 |
.08, .22 |
|
.16*** |
0.04 |
.07, .23 |
|
|
Note. *** p < .001, ** p < .01, * p < .05. N = 611. Gender was coded as 1 = men, 2 = women. CI = confidence interval based on 1,000 bootstrapped samples. Correlations between extensive and problematic use were r = .48, p < .001 in Model I; r = .43, p < .001 in Model II, and r = .29, p < .001 in Model III. Model fit was acceptable across the models: χ2 = 116.150, df = 24, p < .001, CFI = .967, TLI = .951, RMSEA = .079 [90% CI = .065–.094] for Model I; χ2 = 2,120.112, df = 554, p < .001, CFI = .929, TLI = .924, RMSEA = .068 [90% CI = .065–.071] for Model II; and χ2 = 1,541.050, df = 530, p < .001, CFI = .953, TLI = .950, RMSEA = .056 [90% CI = .053–.059] for Model III). As age was not associated with TikTok use in Model I, age was excluded from the subsequent model in which indicators of psychological distress were added. As body image did not predict either form of TikTok use, this variable was excluded from Model III. |
||||||||

This work is licensed under a Creative Commons Attribution-ShareAlike 4.0 International License.
Copyright © 2025 Ágnes Zsila, Mara S. Aruguete, Reza Shabahang, Ágnes Buvár, Gábor Orosz