
Facebook, social comparison and happiness: Evidence from a quasi-natural experiment
Vol.17,No.4(2023)

The ubiquity of Facebook usage compels us to study its effects on well-being. We identified a unique sample of Facebook users and non-users who are employed at a security-related organization, where Facebook usage was differentially restricted (even at home) creating a quasi-natural experiment. Performing between-subject analysis, we found significant differences between Facebook users and non-users with regard to social comparison orientation and happiness. Given the exogenous nature of the assignment into groups (i.e., users and non-users), we attribute these differences to the accumulated effect of Facebook usage. Specifically, we infer that Facebook usage increases engagement in social comparison which is liable to reduce user happiness. Social comparison fully mediates the effect of Facebook on happiness, but only among young employees and only among those who believe that others have many more positive experiences than they do. Overall, our findings suggest that even if Facebook users understand that their friend's posts are positively biased, the increased engagement in social comparison may adversely affect those who believe that their friends’ lives are better than their own.
happiness; Facebook; quasi-natural experiment; social comparison; Social network sites (SNS)
Ayala Arad
The Coller School of Management, Tel Aviv University, Tel Aviv, Israel
Ayala Arad is an associate professor at the Coller School of Management and the head of the Solomon Lew Center for Consumer Behavior at Tel Aviv University. She received her PhD in Economics from Tel Aviv University. Her research involves experimental studies of bounded rationality in individual decision-making processes and strategic interactions.
Ohad Barlizaly
The Coller School of Management, Tel Aviv University, Tel Aviv, Israel
Ohad Barzilay is the head of data science at Similarweb. After earning his PhD in Computer Science, Ohad joined the department of information and technology management at the Coller School of Management at Tel Aviv University, in which he studied the economics of digital platforms and electronic markets. Before joining academia, Ohad worked for some technology companies including Google, Jungo, VocalTec and BMC. He also served at the Israeli Chief Scientist Office at the committee for incubator and early-stage company funding, and at the scientific committee of the Blavatnik Interdisciplinary Center for Cyber Research.
Maayan Perchick
The Coller School of Management, Tel Aviv University, Tel Aviv, Israel
Maayan Perchick received her BSc in Chemistry from Ben-Gurion University of the Negev and her MS in Information Technology and Technology Management from the Coller School of Management, Tel Aviv University.
Allcott, H., Braghieri, L., Eichmeyer, S., & Gentzkow, M. (2020). The welfare effects of social media. American Economic Review, 110(3), 629–676. https://doi.org/10.1257/aer.20190658
Appel, H., Gerlach, A. L., & Crusius, J. (2016). The interplay between Facebook use, social comparison, envy, and depression. Current Opinion in Psychology, 9, 44–49. https://doi.org/10.1016/j.copsyc.2015.10.006
Argyle, M. (2013). The psychology of happiness. Routledge. https://doi.org/10.4324/9781315812212
Baron, R. M., & Kenny, D. A. (1986). The moderator-mediator variable distinction in social psychological research: Conceptual, strategic, and statistical considerations. Journal of Personality and Social Psychology, 51(6), 1173–1182. https://doi.org/10.1037/0022-3514.51.6.1173
Bjørnskov, C. (2003). The happy few: Cross–country evidence on social capital and life satisfaction. Kyklos, 56(1), 3–16. https://doi.org/10.1111/1467-6435.00207
Braghieri, L., Levy, R., & Makarin, A. (2022). Social media and mental health. American Economic Review, 112(11), 3660–3693. https://doi.org/10.1257/aer.20211218
Brown, D. J., Ferris, D. L., Heller, D., & Keeping, L. M. (2007). Antecedents and consequences of the frequency of upward and downward social comparisons at work. Organizational Behavior and Human Decision Processes, 102(1), 59–75. https://doi.org/10.1016/j.obhdp.2006.10.003
Burke, M., Cheng, J., & de Gant, B. (2020). Social comparison and Facebook: Feedback, positivity, and opportunities for comparison. In Proceedings of the 2020 CHI conference on human factors in computing systems (pp. 1–13). https://doi.org/10.1145/3313831.3376482
Burnell, K., George, M. J., Vollet, J. W., Ehrenreich, S. E., & Underwood, M. K. (2019). Passive social networking site use and well-being: The mediating roles of social comparison and the fear of missing out. Cyberpsychology: Journal of Psychosocial Research on Cyberspace, 13(3), Article 5. https://doi.org/10.5817/CP2019-3-5
Callan, M. J., Kim, H., & Matthews, W. J. (2015). Age differences in social comparison tendency and personal relative deprivation. Personality and Individual Differences, 87, 196–199. https://doi.org/10.1016/j.paid.2015.08.003
Chou, H.-T. G., & Edge, N. (2012). “They are happier and having better lives than I am”: The impact of using Facebook on perceptions of others' lives. Cyberpsychology, Behavior, and Social Networking, 15(2), 117–121. https://doi.org/10.1089/cyber.2011.0324
Cohen‐Charash, Y. (2009). Episodic envy. Journal of Applied Social Psychology, 39(9), 2128–2173. https://doi.org/10.1111/j.1559-1816.2009.00519.x
Dehejia, R. H., & Wahba, S. (1999). Causal effects in nonexperimental studies: Re-evaluating the evaluation of training programs. Journal of the American Statistical Association, 94(448), 1053–62. https://doi.org/10.1080/01621459.1999.10473858
Dellarocas, C. (2005). Reputation mechanism design in online trading environments with pure moral hazard. Information Systems Research, 16(2), 209–230. https://doi.org/10.1287/isre.1050.0054
Ellison, N. B., Steinfield, C., & Lampe, C. (2007). The benefits of Facebook “friends:” Social capital and college students’ use of online social network sites. Journal of Computer‐Mediated Communication, 12(4), 1143–1168. https://doi.org/10.1111/j.1083-6101.2007.00367.x
Farahani, H. A., Kazemi, Z., Aghamohamadi, S., Bakhtiarvand, F., & Ansari, M. (2011). Examining mental health indices in students using Facebook in Iran. Procedia—Social and Behavioral Sciences, 28, 811–814. https://doi.org/10.1016/j.sbspro.2011.11.148
Feinstein, B. A., Hershenberg, R., Bhatia, V., Latack, J. A., Meuwly, N., & Davila, J. (2013). Negative social comparison on Facebook and depressive symptoms: Rumination as a mechanism. Psychology of Popular Media Culture, 2(3), 161–170. https://doi.org/10.1037/a0033111
Festinger, L. (1954). A theory of social comparison processes. Human Relations, 7(2), 117–140. https://doi.org/10.1177/001872675400700202
Finn, S. E. (1986). Stability of personality self-ratings over 30 years: Evidence for an age/cohort interaction. Journal of Personality and Social Psychology, 50(4), 813–818. https://doi.org/10.1037/0022-3514.50.4.813
Fox, J., & Moreland, J. J. (2015). The dark side of social networking sites: An exploration of the relational and psychological stressors associated with Facebook use and affordances. Computers in Human Behavior, 45, 168–176. https://doi.org/10.1016/j.chb.2014.11.083
Fox, J., & Warber, K. M. (2015). Queer identity management and political self‐expression on social networking sites: A co‐cultural approach to the spiral of silence. Journal of Communication, 65(1), 79–100. https://doi.org/10.1111/jcom.12137
Gardner, M., & Steinberg, L. (2005). Peer influence on risk taking, risk preference, and risky decision making in adolescence and adulthood: An experimental study. Developmental Psychology, 41(4), 625–635. https://doi.org/10.1037/0012-1649.41.4.625
Gerber, J. P., Wheeler, L., & Suls, J. (2018). A social comparison theory meta-analysis 60+ years on. Psychological Bulletin, 144(2), 177–197. https://doi.org/10.1037/bul0000127
Gesenhues, A. (2019, May 28). Time spent on Facebook, Snapchat remains flat, but Instagram sees growth. MarTech. https://martech.org/time-spent-on-facebook-snapchat-remains-flat-but-instagram-sees-growth/
Gibbons, F. X., & Buunk, B. P. (1999). Individual differences in social comparison: The development of a scale of social comparison orientation. Journal of Personality and Social Psychology, 76(1), 129–142. https://doi.org/10.1037/0022-3514.76.1.129
Ginsberg, D., & Burke, M. (2019, November 7). Hard questions: Is spending time on social media bad for us? Meta. https://about.fb.com/news/2017/12/hard-questions-is-spending-time-on-social-media-bad-for-us/
Gonzales, A. L., & Hancock, J. T. (2011). Mirror, mirror on my Facebook wall: Effects of exposure to Facebook on self-esteem. Cyberpsychology, Behavior, and Social Networking, 14(1-2), 79–83. https://doi.org/10.1089/cyber.2009.0411
Hayes, F. A. (2013). Introduction to mediation, moderation, and conditional process analysis: A regression-based approach. The Guilford Press. https://psycnet.apa.org/record/2013-21121-000
Heffetz, O. & Rabin, M. (2013). Conclusions regarding cross-group differences in happiness depend on difficulty of reaching respondents. American Economic Review, 103(7), 3001–3021. https://doi.org/10.1257/aer.103.7.3001
Helliwell, J. (2001). Social capital, the economy and well-being. In A. Sharpe, F. St-Hilare, & K. Banting (Eds.) The review of economic performance and social progress 2001: The longest decade: Canada in the 1990s (vol. 1, pp. 43–60). The Institute for Research on Public Policy. https://ideas.repec.org/h/sls/repsls/v1y2001jh.html
Helson, R., & Moane, G. (1987). Personality change in women from college to midlife. Journal of Personality and Social Psychology, 53(1), 176–86. https://doi.org/10.1037/0022-3514.53.1.176
Hills, P., & Argyle, M. (2002). The Oxford Happiness Questionnaire: A compact scale for the measurement of psychological well-being. Personality and Individual Differences, 33(7), 1073–1082. https://doi.org/10.1016/S0191-8869(01)00213-6
Ho, D., Imai, K., King, G., and Stuart, E. (2007). Matchit: Nonparametric preprocessing for parametric causal inference. Journal of Statistical Software, 42(8). http://gking.harvard.edu/matchit/.
Krasnova, H., Wenninger, H., Widjaja, T., & Buxmann, P. (2013). Envy on Facebook: A hidden threat to users' life satisfaction? Wirtschaftsinformatik, Article 92. https://aisel.aisnet.org/wi2013/92/
Krasnova, H., Widjaja T, Buxmann P, Wenninger H, & Benbasat I. (2015). Research note - Why following friends can hurt you: An exploratory investigation of the effects of envy on social networking sites among college-age users. Information Systems Research, 26, 585–605. https://doi.org/10.1287/isre.2015.0588
Kraut, R., Patterson, M., Lundmark, V., Kiesler, S., Mukophadhyay, T., & Scherlis, W. (1998). Internet paradox: A social technology that reduces social involvement and psychological well-being? American Psychologist, 53(9), 1017–1031. https://doi.org/10.1037/0003-066X.53.9.1017
Kross, E., Verduyn, P., Demiralp, E., Park J., Lee, D. S., & Lin, N. (2013). Facebook use predicts declines in subjective well-being in young adults. PLoS One, 8(8), Article e69841. https://doi.org/10.1371/journal.pone.0069841
Kross, E., Verduyn, P., Sheppes, G., Costello, C. K., Jonides, J. & Ybarra, O. (2021). Social media and well-being: Pitfalls, progress, and next steps. Trends in Cognitive Sciences, 25(1), 55–66. https://doi.org/10.1016/j.tics.2020.10.005
Kruglanski, A. W., & Mayseless, O. (1990). Classic and current social comparison research: Expanding the perspective. Psychological Bulletin, 108(2), 195–208. https://doi.org/10.1037/0033-2909.108.2.195
Labrague, L. J. (2014). Facebook use and adolescents’ emotional states of depression, anxiety, and stress. Health Science Journal, 8(1), 80–89. https://squ.elsevierpure.com/en/publications/facebook-use-and-adolescents-emotional-states-of-depression-anxie
Leung, A., Kier, C., Fung, T., Fung, L., & Sproule, R. (2013). Searching for happiness: The importance of social capital. In A. D. Fave (Ed.), The exploration of happiness (pp. 247–267). Springer Netherlands. https://doi.org/10.1007/978-94-007-5702-8_13
Levin, S. (2018, February 14). Facebook admits it poses mental health risk – but says using site more can help. The Guardian. https://www.theguardian.com/ technology/2017/dec/15/facebook-mental-health-psychology-social-media
Lim, M., & Yang, Y. (2019). Upward social comparison and Facebook users’ grandiosity: Examining the effect of envy on loneliness and subjective well-being. Online Information Review, 43(4), 635–652. https://doi.org/10.1108/OIR-04-2017-0137
Lin, R., & Utz, S. (2015). The emotional responses of browsing Facebook: Happiness, envy, and the role of tie strength. Computers in Human Behavior, 52, 29–38. https://doi.org/10.1016/j.chb.2015.04.064
Liu, D., Baumeister, R. F., Yang, C.-c., & Hu, B. (2019). Digital communication media use and psychological well-being: A meta-analysis. Journal of Computer-Mediated Communication, 24(5), 259–274. https://doi.org/10.1093/jcmc/zmz013
Ljepava, N. R., Orr, R. R., Locke, S., & Ross, C. (2013). Personality and social characteristics of Facebook non-users and frequent users. Computers in Human Behavior, 29(4), 1602–1607. https://doi.org/10.1016/j.chb.2013.01.026
McEwan, B. (2013). Sharing, caring, and surveilling: An actor–partner interdependence model examination of Facebook relational maintenance strategies. Cyberpsychology, Behavior, and Social Networking, 16(12), 863–869.
Meier, A., Gilbert, A., Börner, S., & Possler, D. (2020). Instagram inspiration: How upward comparison on social network sites can contribute to well-being. Journal of Communication, 70(5), 721–743. https://doi.org/10.1093/joc/jqaa025
Meier, A., & Johnson, B. K. (2022). Social comparison and envy on social media: A critical review. Current Opinion in Psychology, 45, Article 101302. https://doi.org/10.1016/j.copsyc.2022.101302
Meier, A., & Schäfer, S. (2018). Positive side of social comparison on social network sites: How envy can drive inspiration on Instagram. Cyberpsychology, Behavior and Social Networking, 21(7), 411–417. https://doi.org/10.1089/cyber.2017.0708
Nabi, R. L., Prestin, A., & So, J. (2013). Facebook friends with (health) benefits? Exploring social network site use and perceptions of social support, stress, and well-being. Cyberpsychology, Behavior, and Social Networking, 16(10), 721–727. https://doi.org/10.1089/cyber.2012.0521
Nadkarni, A., & Hofmann, S. G. (2012). Why do people use Facebook? Personality and Individual Differences, 52(3), 243–249. https://doi.org/10.1016/j.paid.2011.11.007
Noon, E. J., & Meier, A. (2019). Inspired by friends: Adolescents' network homophily moderates the relationship between social comparison, envy, and inspiration on Instagram. Cyberpsychology, Behavior and Social Networking, 22(12), 787–793. https://doi.org/10.1089/cyber.2019.0412
Overby, E., Slaughter, S. A., & Konsynski, B. (2010). Research commentary—the design, use, and consequences of virtual processes. Information Systems Research, 21(4), 700–710. https://doi.org/10.1287/isre.1100.0319
Ozimek, P., & Bierhoff, H.-W. (2016). Facebook use depending on age: The influence of social comparisons. Computers in Human Behavior, 61, 271–279. https://doi.org/10.1016/j.chb.2016.03.034
Park, S. Y., & Baek, Y. M. (2018). Two faces of social comparison on Facebook: The interplay between social comparison orientation, emotions, and psychological well-being. Computers in Human Behavior, 79, 83–93. https://doi.org/10.1016/j.chb.2017.10.028
Pempek, T. A., Yermolayeva, Y. A., & Calvert, S. L. (2009). College students’ social networking experiences on Facebook. Journal of Applied Developmental Psychology, 30(3), 227–238. https://doi.org/10.1016/j.appdev.2008.12.010
Pettijohn II, T. F., LaPiene, K. E., Pettijohn, T. F., & Horting, A. L. (2012). Relationships between Facebook intensity, friendship contingent self-esteem, and personality in U.S. college students. Cyberpsychology: Journal of Psychosocial Research on Cyberspace, 6(1), Article 2. https://doi.org/10.5817/CP2012-1-2
Pew Research Center. Social Media Fact Sheet. (2021, April 7). https://www.pewresearch.org/internet/fact-sheet/social-media/
Preacher, K. J., & Hayes, A. F. (2004). SPSS and SAS procedures for estimating indirect effects in simple mediation models. Behavior Research Methods, Instruments & Computers, 36(4), 717–731. https://doi.org/10.3758/BF03206553
Reer, F., Tang, W. Y., & Quandt, T. (2019). Psychosocial well-being and social media engagement: The mediating roles of social comparison orientation and fear of missing out. New Media & Society, 21(7), 1486–1505. https://doi.org/10.1177/1461444818823719
Rosenbaum, P. R., & Rubin, D. B. (1983). The central role of the propensity score in observational studies for causal effects. Biometrika, 70(1), 41–55. https://doi.org/10.1093/biomet/70.1.41
Rousseau, A., Eggermont, S., & Frison, E. (2017). The reciprocal and indirect relationships between passive Facebook use, comparison on Facebook, and adolescents’ body dissatisfaction. Computers in Human Behavior, 73, 336–344. https://doi.org/10.1016/j.chb.2017.03.056
Rozgonjuk, D., Ryan, T., Kuljus, J.-K., Täht, K., & Scott, G. G. (2019). Social comparison orientation mediates the relationship between neuroticism and passive Facebook use. Cyberpsychology: Journal of Psychosocial Research on Cyberspace, 13(1), Article 2. https://doi.org/10.5817/CP2019-1-2
Ruble, D. N., Boggiano, A. K., Feldman, N. S., & Loebl, J. H. (1980). Developmental analysis of the role of social comparison in self-evaluation. Developmental Psychology, 16(2), 105–115. https://doi.org/10.1037/0012-1649.16.2.105
Schmuck, D., Karsay, K., Matthes, J., & Stevic, A. (2019). “Looking Up and Feeling Down”. The influence of mobile social networking site use on upward social comparison, self-esteem, and well-being of adult smartphone users. Telematics and Informatics, 42, Article 101240. https://doi.org/10.1016/j.tele.2019.101240
Siegler, I. C., Zonderman, A. B., Barefoot, J. C., Williams, R. B., Jr., Costa, P. T., Jr., & Mc-Crae, R. R. (1990). Predicting personality in adulthood from college MMPI scores: Implications for follow-up studies in psychosomatic medicine. Psychosomatic Medicine, 52(6), 644–652. https://doi.org/10.1097/00006842-199011000-00006
Smith, R. H. (2000). Assimilative and contrastive emotional reactions to upward and downward social comparisons. In J. Suls & L. Wheeler (Eds.), Handbook of social comparison: Theory and research (pp. 173–200). Kluwer Academic/Plenum Publishers. https://doi.org/10.1007/978-1-4615-4237-7_10
Smith, R. H., Parrott, W. G., Diener, E. F., Hoyle, R. H., & Kim, S. H. (1999). Dispositional envy. Personality and Social Psychology Bulletin, 25(8), 1007–1020. https://doi.org/10.1177/01461672992511008
Suls, J. M., & Mullen, B. (1982). From the cradle to the grave: Comparison and self-evaluation across the life-span. In J. M. Suls (Ed.) Psychological perspectives on the self (vol.1, pp. 97–125). Lawrence Erlbaum.
Tandoc, E. C., Ferrucci, P., & Duffy, M. (2015). Facebook use, envy, and depression among college students: Is Facebooking depressing? Computers in Human Behavior, 43, 139–146. https://doi.org/10.1016/j.chb.2014.10.053
Tiwana, A., Konsynski, B., & Bush, A. A. (2010). Research commentary—Platform evolution: Coevolution of platform architecture, governance, and environmental dynamics. Information Systems Research, 21(4), 675–687. https://doi.org/10.1287/isre.1100.0323
Triệu, P., Ellison, N. B., Schoenebeck, S. Y., & Brewer, R. N. (2021). Implications of Facebook engagement types and feed’s social content for self-esteem via social comparison processes. Social Media+ Society, 7(3). https://doi.org/10.1177/20563051211042400
Vecchio, R. P. (2000). Negative emotion in the workplace: Employee jealousy and envy. International Journal of Stress Management, 7(3), 161–179. https://doi.org/10.1023/A:1009592430712
Verduyn, P., Lee, D. S., Park, J., Shablack, H., Orvell, A., Bayer, J., Ybarra, O., Jonides, J., & Kross, E. (2015). Passive Facebook usage undermines affective well-being: Experimental and longitudinal evidence. Journal of Experimental Psychology: General, 144(2), 480–488. https://doi.org/10.1037/xge0000057
Verduyn, P., Gugushvili, N., Massar, K., Täht, K., & Kross, E. (2020). Social comparison on social networking sites. Current Opinion in Psychology, 36, 32–37. https://doi.org/10.1016/j.copsyc.2020.04.002
Verduyn, P., Ybarra, O., Résibois, M., Jonides, J., & Kross, E. (2017). Do social network sites enhance or undermine subjective well‐being? A critical review. Social Issues and Policy Review, 11(1), 274–302. https://doi.org/10.1111/sipr.12033
Vogel, E. A., Rose, J. P., Okdie, B. M., Eckles, K., & Franz, B. (2015). Who compares and despairs? The effect of social comparison orientation on social media use and its outcomes. Personality and Individual Differences, 86, 249–256. https://doi.org/10.1016/j.paid.2015.06.026
Wang, J.-L., Wang, H.-Z., Gaskin, J., & Hawk, S. (2017). The mediating roles of upward social comparison and self-esteem and the moderating role of social comparison orientation in the association between social networking site usage and subjective well-being. Frontiers in Psychology, 8, Article 771. https://doi.org/10.3389/fpsyg.2017.00771
Wenninger, H., Cheung, C. M. K., & Chmielinski, M. (2021). Understanding envy and users' responses to envy in the context of social networking sites: A literature review. International Journal of Information Management, 58, Article 102303. https://doi.org/10.1016/j.ijinfomgt.2020.102303
Wenninger, H., Cheung, C. M. K., & Krasnova, H. (2019). College-aged users behavioral strategies to reduce envy on social networking sites: A cross-cultural investigation. Computers in Human Behavior, 97, 10–23. https://doi.org/10.1016/j.chb.2019.02.025
Wenninger, H., Krasnova, H., & Buxmann, P. (2014). Activity matters: Investigating the influence of Facebook on life satisfaction of teenage users. ECIS 2014 PROCEEDINGS, TRACK01, Article 13. https://aisel.aisnet.org/ecis2014/proceedings/track01/13/
Wills, T. A. (1981). Downward comparison principles in social psychology. Psychological Bulletin, 90(2), 245–271. https://doi.org/10.1037/0033-2909.90.2.245
Wood, J. V., Taylor, S. E., & Lichtman, R. R. (1985). Social comparison in adjustment to breast cancer. Journal of Personality and Social Psychology, 49(5), 1169–1183. https://doi.org/10.1037/0022-3514.49.5.1169
Yang, F.-R., Wei, C.-F., & Tang, J.-H. (2019). Effect of Facebook social comparison on well-being: A meta-analysis. Journal of Internet Technology, 20(6), 1829–1836. https://jit.ndhu.edu.tw/article/view/2169
Yoon, S., Kleinman, M., Mertz, J., & Brannick, M. (2019). Is social network site usage related to depression? A meta-analysis of Facebook–depression relations. Journal of Affective Disorders, 248, 65–72. https://doi.org/10.1016/j.jad.2019.01.026
Zhao, S., Grasmuck, S., & Martin, J. (2008). Identity construction on Facebook: Digital empowerment in anchored relationships. Computers in Human Behavior, 24(5), 1816–1836. https://doi.org/10.1016/j.chb.2008.02.012
Authors’ Contribution
Ayala Arad: methodology, formal analysis, writing – original draft, review & editing. Ohad Barzilay: methodology, formal analysis, writing – original draft, review & editing. Maayan Perchick: methodology, formal analysis, investigation, writing – original draft.
Editorial Record
First submission received:
June 3, 2022
Revision received:
April 25, 2023
Accepted for publication:
August 8, 2023
Editor in charge:
Alexander P. Schouten
Introduction
Social media has become an integral part of daily life with 84% of 18–29-year-olds in the US using it (Pew Research Center, 2021). Facebook has over 2 billion users worldwide, with an average daily usage of 37 minutes per user (Gesenhues, 2019). The analysis presented in this paper is intended to shed light on the effect of social network sites (SNS), and in particular Facebook usage, on users’ subjective well-being (SWB).
SNS, like their offline counterparts, have been found to fortify one’s self-esteem, reinforce group identity and increase trust and cooperation (e.g., Fox & Warber, 2015; Gonzales & Hancock, 2011; Zhao et al., 2008). Since these benefits and the SWB of users are strongly associated (e.g., Bjørnskov, 2003; Helliwell, 2001; Leung et al., 2013), it is reasonable to assume that participating in SNS has a positive effect on well-being.
However, there is increasing evidence to the contrary, suggesting that SNS may have a negative impact on SWB (Kraut et al., 1998; Kross et al., 2021; Verduyn et al., 2020). The design of online platforms can influence user behavior (Dellarocas, 2005; Overby et al., 2010; Tiwana et al., 2010). In the case of Facebook, the design of the news feed creates an overwhelming emphasis on the positive experiences of others (Chou & Edge, 2012; Kross et al., 2013), which may give rise to envy, rumination, jealousy and low self-esteem (Feinstein et al., 2013; Fox & Moreland, 2015; Tandoc et al., 2015; Triệu et al., 2021), as well as depression, anxiety and stress (Braghieri et al., 2022; Farahani et al., 2011; Labrague, 2014).
The broad spectrum of positive and negative effects on well-being that are attributed to Facebook and other SNS needs to be understood (Appel et al., 2016; Kross et al., 2021; Verduyn et al., 2017, 2020).
Facebook architecture is likely to trigger comparison of one’s own experiences to others’ experiences. Thus, social comparison may have an important role in determining the effect of using Facebook on SWB. Previous research has identified correlation between heavy or passive Facebook usage and social comparison (e.g., Burke et al., 2020; Rozgonjuk et al., 2019). Offline upward social comparison has been found to induce negative feelings (Gerber et al., 2018) and reduce happiness (Argyle, 2013). Furthermore, several studies have investigated the effects of online social comparison on SWB and found both positive and negative effects, as summarized by Verduyn et al. (2020) and Meier & Johnson (2022). Meta-analyses by Yang et al. (2019) and Yoon et al. (2019) revealed that social comparison on SNS generally leads to a decrease in SWB and to depression. However, social comparison may also have favorable effects (Meier et al., 2020; Park & Baek, 2018).
The current study uses a quasi-natural experiment to measure the cumulative effect of prolonged Facebook usage on users' SWB in a real-world setting. In 2015, employees from a large security organization were sampled, including Facebook users and non-users, with quasi-exogenous allocation to these two groups due to organization-imposed restrictions on Facebook usage. The setting makes it possible to compare users and non-users to examine the causal effect of Facebook usage on social comparison and happiness. The study also measures individuals’ perceptions of their friends’ lives (compared to own) and investigates the interplay between these three factors.
We present two hypotheses on the impact of Facebook usage on social comparison and happiness. The first hypothesis suggests that using Facebook increases one's tendency to engage in social comparison (SCO), with younger users being more susceptible than older ones. The second hypothesis posits that the negative effect of Facebook on happiness is mediated by SCO, and that this effect is stronger for users who perceive their friends' experiences as much more positive than their own.
Our new measure of the perception of friends’ experiences allows to shed light on the mechanism behind Facebook’s effect on SWB, by disentangling two potential paths: (1) Facebook biases one’s perception of others’ positive experiences. This perception bias may affect happiness even if one’s SCO (the tendency to compare) has not increased, because the biased perception makes any comparison incidence more harmful. (2) Facebook’s architecture induces users to observe the positive experiences of others more vividly and frequently than non-users, which triggers a higher frequency of upward social comparisons. Increased engagement in (upward) social comparison due to Facebook use may affect happiness even if one’s perceptions of others’ lives haven’t been altered by Facebook use, because more comparisons are made.
The results of our analysis suggest that Facebook usage increases SCO, which in turn decreases happiness, particularly for users who perceive their friends' experiences as much more positive than their own. It was found that only young participants (aged 18–25) were susceptible to the negative effects of Facebook usage on social comparison and happiness, which could be due to their more passive use of the platform and greater focus on others compared to older users. We did not find any indication that Facebook affects the perception of others’ experiences (compared to one’s own experiences). Thus, the findings provide empirical support for our proposed mechanism, in which increased tendency to compare to others may affect happiness even if one’s perceptions of others’ lives haven’t changed due to Facebook use.
This study is innovative in its experimental setting, which facilitates a quasi-natural experiment in a workplace. Notably, the partially exogenous nature of the assignment into users and non-users reduces the inherent selection bias which has been evident in previous studies, allowing for causal interpretation to some extent. Individuals who choose not to use Facebook are likely to differ in character from Facebook users (Ljepava et al., 2013; Nadkarni & Hofmann, 2012) which makes it difficult to devise a proper control group of Facebook non-users. A similar selection problem exists in studies that compare the SWB of users who are characterized by different types or intensities of usage (Chou & Edge, 2012; Tandoc et al., 2015). A person's general disposition may affect how they use Facebook (e.g., passive use vs. active use, etc.), making it difficult to identify the impact of the type or intensity of Facebook usage on happiness. Even longitudinal within-subject studies that compare SWB across time and types of usage (e.g., Kross et al., 2013; Verduyn et al., 2015) may be subject to bias since in periods when the participants are happier, they might also choose to use Facebook more or less intensively. Lastly, using path analysis (Baron & Kenny, 1986) does not eliminate the possibility of underlying endogeneity (see Appel et al., 2016).
An additional contribution of our study is that it examines how the effect of Facebook usage on SWB varies with age. While previous studies used more homogenous subject groups, usually consisting of students (Wenninger et al., 2014), we analyze a sample of employees of varying ages and find that the older members of the sample were less vulnerable to Facebook’s influence on their SCO and in turn on their happiness.
Finally, the study's unique setting allowed for the examination of passive Facebook usage, where even employees who were permitted to use Facebook were asked to be cautious about the information they shared online, including refraining from uploading photos and disclosing work-related information. This type of usage is in fact common (Ginsberg & Burke, 2019; Levin, 2018; Verduyn et al., 2015) and our findings add to the growing body of literature that highlights the negative implications of passive social media usage (Burnell et al., 2019; Liu et al., 2019; Verduyn et al., 2015, 2017; Wenninger et al., 2014).
Theory
We seek to investigate Facebook’s effect on social comparison and happiness, while considering users’ perceptions of the positive/negative experiences of their friends, and to study the interplay between these factors. Specifically, the proposed theoretical framework distinguishes between two constructs: (a) the degree to which one considers one’s own actions in light of what others do, i.e., SCO; and (b) the perceived difference between one’s own positive experiences and those of one’s friends, denoted as ∆(pos). The theory is outlined in Figure 1.
Figure 1. Outline of the Theory on the Effect of
Facebook on One’s Happiness Via the Mediating
Effect of Social Comparison.
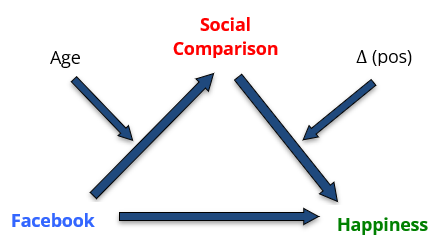
Note. Age serves as a moderator for the effect of Facebook on social comparison. The effect of social comparison on happiness is moderated by ∆(pos).
People have an innate drive to evaluate their own opinions and abilities (Festinger, 1954), with the goal of reducing uncertainty (Gibbons & Buunk, 1999) and establishing their standing relative to others (Brown et al., 2007). Since humans are social creatures, self-evaluation often depends upon comparing oneself with other people, a process called “social comparison” (Festinger, 1954). Formally, social comparisons are defined as “comparative judgments of social stimuli on particular content dimensions” (Kruglanski & Mayseless, 1990). People vary considerably from one another in the extent to which they engage in social comparison, which can be measured by a widely used index called “social comparison orientation” (Gibbons & Buunk, 1999).
Many online user interactions on Facebook correspond to offline social interactions and have social effects, such as enforcing group identity (Fox & Warber, 2015; Zhao et al., 2008), and increasing social capital, social support and relationship maintenance (Ellison et al., 2007; McEwan, 2013; Nabi et al., 2013). Facebook’s design, and in particular the news feed, intensifies the social experience. The news feed stacks the experiences of multiple people, making the comparison to one’s own experiences unavoidable. Furthermore, the ubiquity of Facebook may make the increased social comparison a habit that manifests outside of Facebook. Facebook friends are often also real-world friends, and thus it is reasonable to expect a social comparison spillover.
We hypothesize that the effect of using Facebook on social comparison is moderated by age.1 Social comparison is a part of human development that supports self-evaluation and changes with age (Ruble et al., 1980). Consistent with Suls and Mullen's (1982) life-span model of comparison processes, it was found that older adults report less of a tendency to socially compare than younger adults (Callan et al., 2015). Hence, it is important to control for age when estimating the effect of Facebook usage on social comparison. Furthermore, since Facebook provides an additional channel for social comparison, it may intensify already existing differences in social comparison between age groups.2 Recent evidence suggests that the type and intensity of Facebook usage varies according to age (Pettijohn et al., 2012) and that passive Facebook usage (e.g., examining others’ profiles rather than sharing experiences and engaging with other users) is very common among young users (Pempek et al., 2009; Verduyn et al., 2015). The passive form of usage intensifies social comparison using Facebook and it becomes the core experience (Rousseau et al., 2017; Verduyn et al., 2017). Combined with evidence that young adults are more easily influenced by external factors and their character is more malleable than that of older adults (Finn, 1986; Gardner & Steinberg, 2005; Helson & Moane, 1987; Siegler et al., 1990), it is likely that the effect of Facebook on SCO is larger for young adults than for older ones.
Thus, we propose the following hypothesis:
H1 (social comparison): Facebook usage increases one's SCO, an effect that is moderated by age (such that older users are less affected than younger users).
Social comparison can be in two directions – upward or downward (Gibbons & Buunk, 1999; Wills, 1981). In an upward comparison, one perceives another to be superior along some dimension while in a downward comparison, the opposite is the case. Research suggests that in offline contexts, upward comparison is much more common among individuals (Gerber et al., 2018). Smith (2000) distinguishes between several negative emotions that are likely to arise due to upward social comparison, such as depressive feelings, shame, and envy.
A number of previous studies have focused on the mediating role of envy in reducing subjective well-being (Cohen-Charash, 2009; Smith et al., 1999; Vecchio, 2000), also on Facebook (Krasnova et al., 2013; Krasnova et al., 2015).3 Envy is one possible outcome of upward social comparison. However, the theory proposed here is somewhat subtler in that it distinguishes between Facebook’s effect on the intensity of social comparison and the direction of the comparison (upward or downward). Each of these two effects may lead to increased envy. In particular, it may be that Facebook usage increases one's SCO (in line with H1), online and/or offline, but does not affect one's perception of others’ experiences relative to one’s own, which may cause either upward or downward social comparison, depending to the user’s unbiased perception of others vs. that of himself. This mechanism is somewhat similar to the one suggested in Reer et al. (2019), in which SCO mediates the link between social media use and depression, where self-esteem moderates the relationship between social comparison and depression.
Based on the existing literature off-platform, we expect that Facebook usage will decrease user happiness in the case of upward social comparison (Argyle, 2013; Wood et al., 1985). This is also consistent with studies on SNS which found that upward social comparison decreases other measures of SWB (Lim & Yang, 2019; Schmuck et al., 2019; Wang et al., 2017).
Therefore, we also propose the following hypothesis:
H2 (social comparison as mediator for happiness): The (negative) effect of Facebook usage on happiness is mediated by SCO and moderated by the relative frequency of friends’ positive experiences as perceived by the user (such that the effect is stronger for users with high levels of ∆(pos)).
Methods
The sample consists of employees from a large, well-known security organization. They must go through a rigorous security clearance process before being hired. The employees consist of knowledge workers, IT experts, administrators, scientists and managers. The ages in the sample vary from 18 to 58 (M = 26); 40% are females; 26% are married; and 56% have at least a college degree while the rest have at least a high school education. The average income in the sample is above the average in Israel and their socioeconomic background is comparable to that of university students in Israel.
In January 2015, 144 randomly selected employees filled out a pencil-and-paper questionnaire we had formulated. All of those who were asked to take part in the study agreed to, thus mitigating the risk of happiness-associated volunteer bias (Heffetz & Rabin, 2013). Informed consent was obtained from all participants. Employees who did not have an active Facebook account at the time of the study (in 2015) were classified as non-users and those with an active account as users. The sample consisted of 95 users and 49 non-users.4
The assignment to the groups of users and non-users is described below, followed by a description of the questionnaire, descriptive statistics and the data analysis method.
Quasi-Exogenous Assignment of Employees
For security reasons, the organization's employees were not allowed to use social networks during the period from 2008 to 2012 (neither at work nor at home). Employees with an existing Facebook account, including employees joining the organization during this period, were asked to delete their account. In 2012, the restrictions were relaxed and the policy became dependent on the projects an employee is involved in (rather than his job in the organization). For example, an administrator and a scientist may have identical restrictions placed on them while two engineers might have different ones.
The changes in policy serve to create a quasi-natural experiment by assigning employees to one of two groups: users or non-users. Our main claim is that the restrictions imposed on the employees serve as an external barrier to using Facebook, which encourages employees to avoid using Facebook entirely (thus “assigning” them to the non-users group). This “encouragement” operates by means of two channels:
- Present Prohibition. This includes employees who were not allowed to use Facebook at the time of the study (2015). Considering the nature of the organization, the importance of an employee maintaining his credibility within the organization, the possibility that Facebook usage is monitored, and the periodic polygraph testing, it is safe to assume that employees who were instructed not to use Facebook complied with the restriction.
- Previous Blanket Ban. This includes employees who worked in the organization prior to 2012. They were forbidden to use Facebook during the period 2008-2012; even subsequent to that period, many of the employees who were allowed to have a Facebook account were still forbidden to use their full name or to upload photos, restrictions that compromised their Facebook experience. Post-study interviews indicate that these employees were also used to not having Facebook and therefore decided not to use Facebook even though they were allowed to.
In our random sample of 144 employees, 49 (34%) did not have an active Facebook account, compared to only 4% of non-users in a comparable student group.5 A difference of this order of magnitude suggests that the extent of Facebook abstinence in the sample is related to the organization’s restrictions on usage (whether current or previous).
Since the above assignment to the groups (users and non-users) was not random, as in an experiment, we employ a matching method in order to balance the two groups and analyze the matched sample.
The Questionnaire
The questionnaire (which appears in the online appendix) included six sections, which were presented to the subjects in the following order:
- Demographics: age, gender, family status, a choice between three levels of education and five levels of income.
- Friends' Experiences: There were ten questions regarding the positive experiences in their friends’ lives (such as how often during the week they go out, read a book, watch a movie, etc.) and five questions regarding the negative experiences (such as how often during the week they are upset, sick, etc.).
- Social Comparison: This section was based on the Scale for Social Comparison Orientation (Gibbons & Buunk, 1999). A high score indicates a high tendency to engage in social comparison. The reliability of the scale was evaluated using Cronbach’s alpha measure (α = .80).
- Happiness: This section is based on The Oxford Happiness Questionnaire (Hills & Argyle, 2002). A high score reflects a high level of satisfaction with one’s own life. The reliability of the scale was evaluated using Cronbach’s alpha measure (α = .71).
- Personal Experiences: Participants were asked about the frequency of ten positive experiences and five negative experiences in their own lives, which correspond to the experiences they were asked about in Section B. Based on the answers to sections B and E, we measured the difference between the frequency of others’ positive and negative experiences and one’s own and created the variables ∆(pos) and ∆(neg). A high value of ∆(pos) (∆(neg)) reflects an individual’s tendency to believe that others have more positive (negative) experiences than he or she does.
- Facebook Usage: This section is based on Ellison et al. (2007). The questions concerned the frequency of Facebook usage and the type of activities that users engage in. For example, participants were asked how often they check their Facebook account, how often they upload photos, how often they tag, etc.
Descriptive Statistics
Since the original assignment to the groups (users and non-users) was not random, we employ the propensity score matching method (Dehejia & Wahba, 1999; Rosenbaum & Rubin, 1983), using Matchit (Ho et al., 2007) in order to balance the two groups based on their demographic features and then perform the analysis on the balanced groups. The matching procedure uses the nearest neighbour method and probit as the distance function and discards observations with low quality matches that lie outside the common support of the distance measure (without replacement). The process resulted in two balanced groups: 41 non-users (out of the original 49 non-users) and 41 users.6 The demographics and main characteristics of users and non-users in the matched sample are shown in Table 1. The users spend an average of 48 minutes on Facebook each day (the median is about 30 minutes) and 78% of them check their account at least once a day (34% check it more frequently).
Table 1. Descriptive Statistics of Our Matched Sample.
|
|
|
Non-users (N = 41) |
Users (N = 41) |
||||||||
|
p |
|
Min |
Max |
M |
SD |
|
Min |
Max |
M |
SD |
|
|
Age |
.654 |
|
18.00 |
42.00 |
27.07 |
6.65 |
|
18.00 |
44.00 |
26.41 |
6.61 |
|
Gender |
.640 |
|
1.00 |
2.00 |
1.29 |
0.46 |
|
1.00 |
2.00 |
1.34 |
0.48 |
|
Education |
.453 |
|
3.00 |
5.00 |
4.51 |
0.84 |
|
3.00 |
5.00 |
4.37 |
0.92 |
|
Income |
.662 |
|
1.00 |
5.00 |
2.90 |
1.76 |
|
1.00 |
5.00 |
2.73 |
1.76 |
|
Family Status |
.646 |
|
1.00 |
2.00 |
1.63 |
0.49 |
|
1.00 |
2.00 |
1.68 |
0.47 |
|
Social comparison |
.097 |
|
1.00 |
5.38 |
3.35 |
0.84 |
|
2.00 |
5.50 |
3.69 |
0.98 |
|
Happiness |
.113 |
|
2.88 |
6.00 |
4.60 |
0.66 |
|
3.25 |
5.75 |
4.37 |
0.62 |
|
∆(pos) |
.852 |
|
0.20 |
0.66 |
0.42 |
0.11 |
|
0.15 |
0.71 |
0.42 |
0.13 |
|
∆(neg) |
.802 |
|
0.06 |
0.73 |
0.40 |
0.17 |
|
0.11 |
0.76 |
0.41 |
0.18 |
|
Own(pos) |
.407 |
|
0.08 |
0.61 |
0.36 |
0.13 |
|
0.19 |
0.70 |
0.38 |
0.12 |
|
Own(neg) |
.842 |
|
0.00 |
0.90 |
0.39 |
0.23 |
|
0.00 |
0.85 |
0.40 |
0.21 |
|
Note. Gender: 1 is male, 2 is female. Education: 3 is high-school education, 5 is more than 15 years of education and 4 is in between. Income: 3 is the average income in the country, 1 is much lower and 5 is much higher than the average income. Family status: 1 is married, 2 is single. Social comparison and happiness are both between 1 and 6. ∆(pos) is the extent (potentially between 0 and 1) to which one finds others’ lives richer in positive experiences compared to one’s own; ∆(neg) is the analogous extent for negative experiences. The column titled p presents the p-value of a t-test comparing the two groups’ means. The are no significant differences between Facebook users and non-users in the below variables’ means, with the exception of the social comparison’s means, which are significantly different at the 10% level. |
|||||||||||
Empirical Model
We carried out a linear regression analysis using the matched sample. In the basic analysis, we measure the differences between users and non-users but do not take into consideration the manner and scope of Facebook usage, which may be endogenously determined by the users. In the online appendix, we extend the basic analysis to include usage patterns and how these patterns relate to social comparison and happiness.
We estimate a moderated mediation model (using PROCESS, Model 21; Hayes, 2013), which examines our hypotheses. According to the model (Figure 1), the effect of Facebook usage on happiness is mediated by social comparison. Age serves as a moderator for the effect of Facebook on social comparison and therefore it influences the indirect effect of Facebook usage on happiness. Furthermore, the effect of social comparison on happiness is moderated by the perceptions of others' positive experiences relative to the perceptions of one’s own (∆(pos)). Thus, we investigate the variable effect of Facebook usage according to age and according to the level of ∆(pos). The indirect effects are estimated using nonparametric bootstrapping procedure (i.e., 5,000 resamples; Preacher & Hayes, 2004).
The moderated mediation model is given by the following equations:
(1) Social comparison = α1 Facebook + α2 Age + α3 Facebook *Age + ε1
(2) Happiness = β_1 Facebook + β_2 ∆(neg) + β_3 Social comparison + β_4 ∆(pos) + β_5 Social comparison*∆(pos) + ε_2
We control for ∆(neg) for the sake of symmetry (the main effect of ∆(pos) is included in the model). As a test of robustness, we ran a number of variations of the model and found that not controlling for ∆(neg) or using additional demographic covariates does not alter the qualitative results.
We also estimate the model in Figure 1 using binary moderators, for both age and ∆(pos), instead of using the original continuous measures. For this purpose, we split the sample into two groups according to age – employees who are younger than the median age (age < 25) and the rest (age ≥ 25). Similarly, we split the sample into ∆(pos)H (higher than the median) and ∆(pos)L (lower than the median). We then re-estimate equations (1) and (2) where Age is replaced by the dummy variable “Age < 25” and ∆(pos) is replaced by the dummy variable “∆(pos)H”. Although we lose some information when transforming continuous variables into binary ones, this exercise allows to estimate the effect of Facebook usage for younger vs. older employees and the effect of social comparison on happiness for ∆(pos)H vs. ∆(pos)L, while maintaining a reasonable group size in these comparisons.
Results
The findings indicate that Facebook usage increases social comparison, an effect that is moderated by age (thus supporting H1), which in turn reduces happiness conditional on the perception of friends' positive experiences relative to the perception of one’s own (thus supporting H2).
We start with the estimation of the moderated mediation model outlined in Figure 1 and Equations (1) and (2), using the continuous moderators age and Δ(pos). The full regression results appear in Table 2. A Bootstrap estimation of confidence intervals for the regression’s coefficients and of the indirect effect of Facebook on happiness appear in the online appendix.
We found a significant effect of Facebook on social comparison (B = 2.46, SE = 0.81, t = 3.03, p = .003). We did not find a main effect of age on social comparison (B = 0.02, SE = 0.02, t = 1.04, p = .300). However, age’s interaction with Facebook usage was negative and significant (B = −0.08, SE = 0.03, t = −2.70, p = .009), suggesting that the effect of Facebook usage decreases with age, thus supporting H1. According to the Johnson-Neyman procedure, the estimated effect of Facebook usage on social comparison is positive and significant only for employees who are up to the age of 25, who account for 52% of the sample.
Table 2. The Results of the Mediated Moderation Model Outlined in Figure 1.
|
|
Social comparison |
Happiness |
|
|
2.46*** (0.81) |
−0.14 (0.13) |
|
Age |
0.02 (0.02) |
|
|
Facebook X age |
−0.08** (0.03) |
|
|
Δ(neg) |
1.21*** (0.38) |
|
|
Social comparison |
|
0.44* (0.23) |
|
Δ(pos) |
|
3.69** (1.79) |
|
Social comparison X Δ(pos) |
|
−1.38*** (0.50) |
|
R2 |
.13 |
.27 |
|
N |
82 |
82 |
|
Note. The predictors in Equations 1 (Social comparison) and 2 (Happiness) appear in the left column. Standard errors in parentheses. *p < .1, **p < .05, *** p < .01. |
||
Social comparison, in turn, decreases happiness (B = 0.44, SE = 0.23, t = 1.93, p = .057) and the interaction Social comparison X Δ(pos) is both negative and significant (B = −1.38, SE = 0.50, t = −2.76, p = .007), which confirms H2. According to the Johnson-Neyman procedure, the estimated negative effect of social comparison on happiness is significant only among the upper 44 percentiles of ∆(pos), averaging across age. Thus, employee’s level of ∆(pos) determines whether and to what extent social comparison decreases happiness.7
Finally, Facebook usage has no significant direct effect on happiness (B = −0.14 (0.13), t = −1.07, p = .286). In other words, social comparison fully mediates the effect of Facebook on happiness.
Figure 2. Indirect Effect of Facebook on Happiness Moderated by Age and Δ(pos).
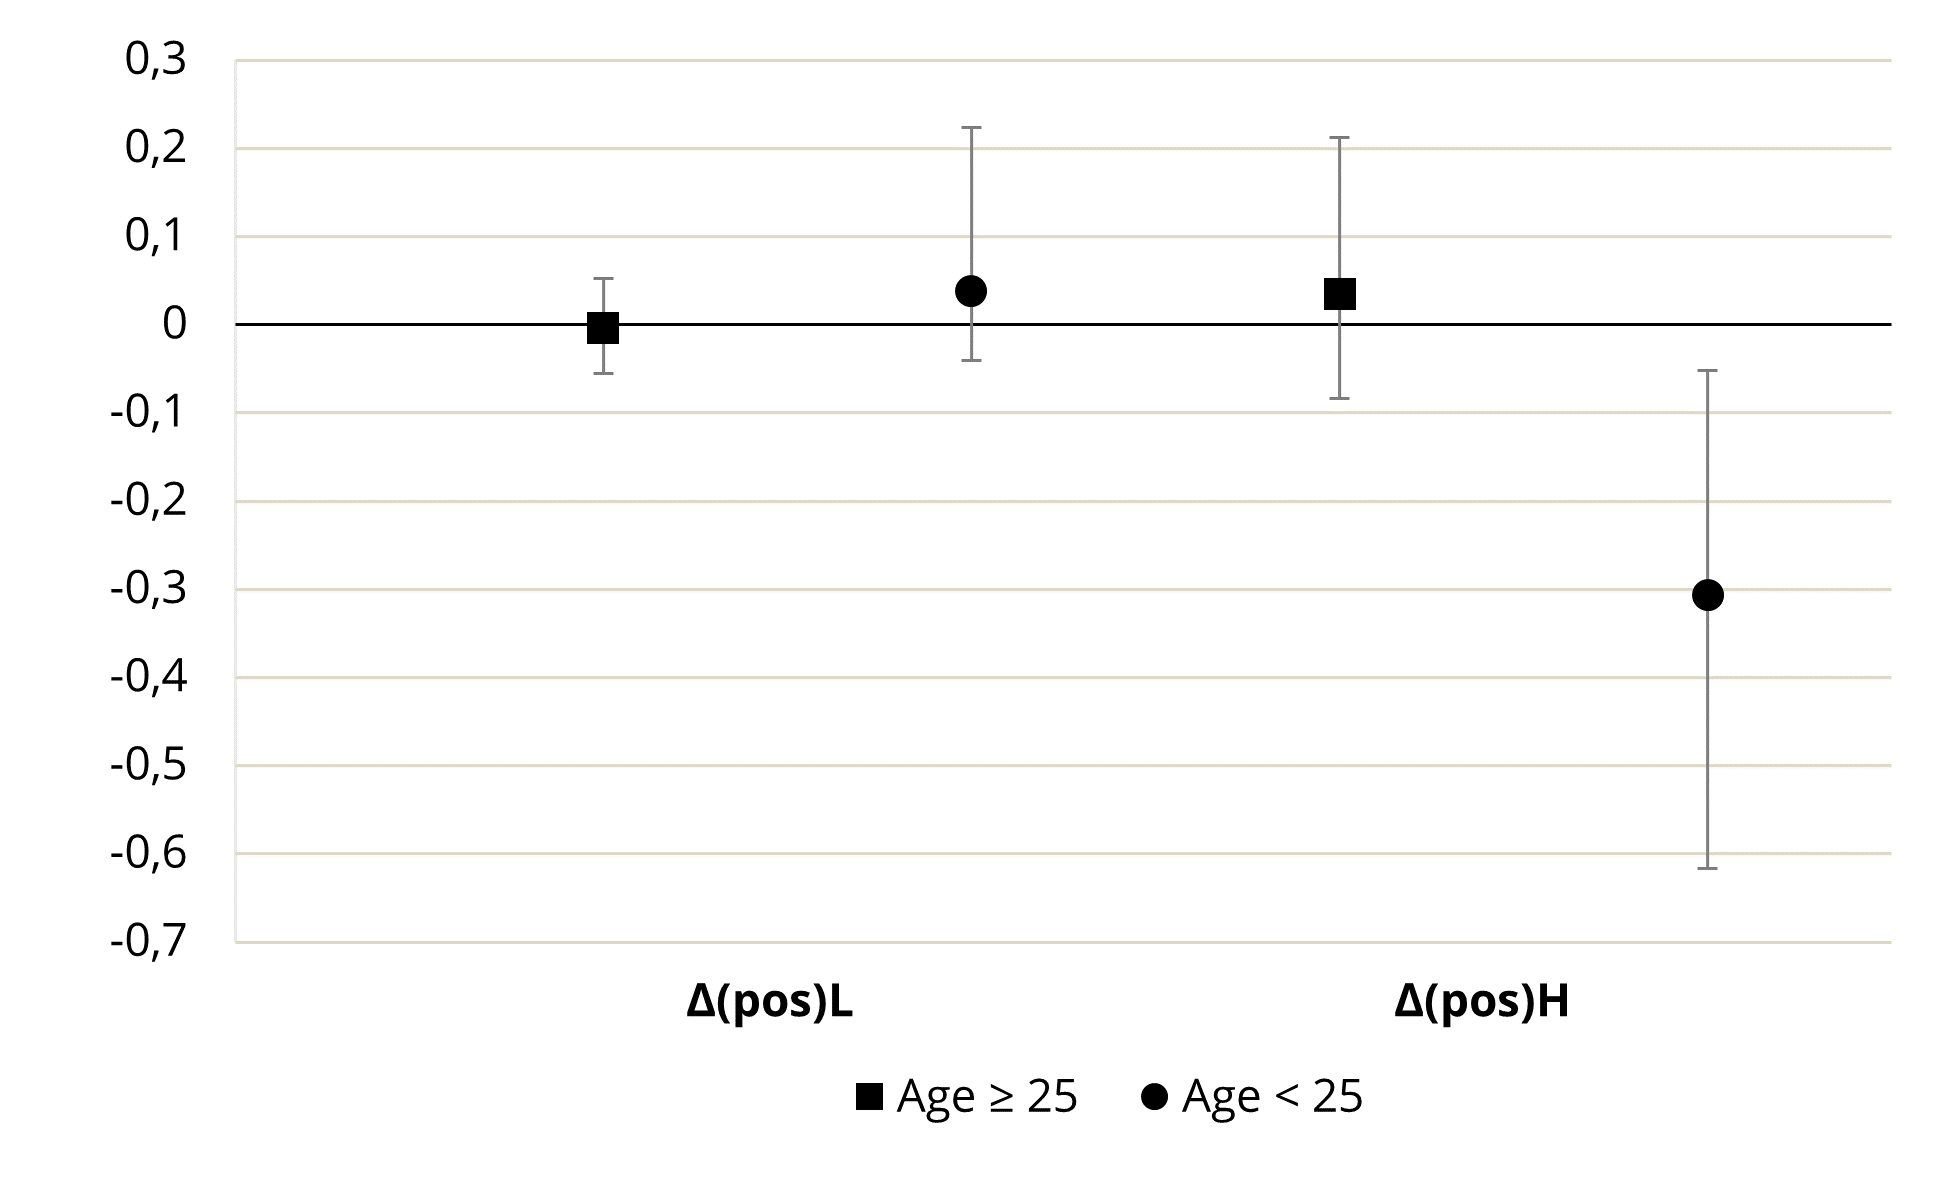
Note. The indirect effect of Facebook on happiness (mediated by social comparison) and the 95% confidence intervals for two age groups and two Δ(pos) groups, below and above the median.
We now report the re-estimation of the model in Figure 1 using binary moderators, instead of the original continuous measures of age and ∆(pos). The estimated effect of Facebook usage on social comparison for the younger employees (age < 25) is 0.85 (SE = 0.30, t = 2.84, p = .006), whereas the effect for the older employees (age ≥ 25) is insignificant (−0.10, SE = 0.25, t = −0.38, p = .704), consistent with H1. The estimated effect of social comparison on happiness for ∆(pos)H is −0.36 (SE = 0.09, t = −3.85, p < .001), whereas the effect for ∆(pos)L is insignificant (0.05, SE = 0.09, t = 0.51 p = .614), consistent with H2. Overall, there is a significant negative indirect effect on happiness for the younger group, conditional on ∆(pos)H (−0.31, SE = 0.15, 95% CI [−0.62, −0.05]), and an insignificant effect for the older group (0.03, SE = 0.09, 95% CI [−0.15, 0.21]), consistent with H2. See the online appendix for the full regression results. Figure 2 summarizes the indirect effect of Facebook usage on happiness given the different values of the binary moderators.
Discussion
Our findings indicate that using Facebook increases engagement in social comparison (H1). The questionnaire was not restricted to on-platform comparison, but rather measured overall comparison orientation. We suggest that the Facebook user experience promotes social comparison (particularly via the news feed) and may establish a tendency to compare oneself to others both on- and off-platform. We did not find any indication that Facebook usage affects the belief that others’ lives are richer in positive experiences than one’s own (i.e., ∆(pos); see the online appendix). However, we did find indications that increased engagement in social comparison combined with a belief that others’ lives are richer in positive experiences than one’s own causes users to be less happy than non-users (H2).
These findings suggest that a user’s decline in happiness is due to an increase in social comparison, even if neither ∆(pos) nor ∆(neg) are affected by Facebook usage. This has the important implication that designers of the Facebook platform should invest more effort in reducing Facebook’s encouragement to compare, while the need to de-bias users’ perceptions of others may be overemphasized.
Another contribution of the study relates to the moderating effect of age. Most of the studies on the effect of Facebook usage have been conducted among relatively young participants, most of them students (Wenninger et al., 2014). Our setting made it possible to examine a wide range of ages (18–44 years old) and to isolate the effect of its interaction with Facebook use on social comparison and happiness. We found that only young participants (aged 18–25) were susceptible to the Facebook effect on social comparison and consequently on happiness.
A possible explanation for the age-related differences is that younger participants are more susceptible to Facebook’s influence because they rely on Facebook as a source of social information to a greater extent than older adults, who are “used to” collecting social information from offline sources. This may be reflected in differences between younger and older adults in the use of Facebook's various features. We explore the age-related usage patterns among the employees in the organization (see the online appendix) and find that younger users tend to use Facebook more passively (i.e., they concentrate on obtaining information) and focus more on others than on themselves (i.e., they tag and comment more than uploading photos or posting statuses), which may trigger social comparison. Note that we found no age-related differences in the overall intensity of usage, although the frequency of checking the account was significantly larger for younger employees.
One caveat to consider is the possibility that young employees have a greater tendency to use other social media (e.g., Twitter) as well and that their levels of social comparison and happiness are not affected solely by Facebook usage. However, other social media platforms were not widely in use in Israel at the time of the study and we believe that communication channels (such as Facetime) that augment off-platform social relationships are less likely to reduce users’ well-being.
This study is the first, to the best of our knowledge, to use a quasi-natural experiment to measure the cumulative effect of prolonged Facebook usage in a real-world setting. It demonstrates a potential negative effect of using social network platforms such as Facebook on users’ subjective well-being. Our setting has some advantages over lab experiments, in which there may be a need to simulate Facebook usage; participants may be influenced by an awareness of the research questions; and the effects measured in a lab may only be momentary. Another advantage of the unique setting is that it allows to account for the cumulative effect of Facebook usage “in the wild”, in contrast to lab experiments and brief-duration field studies (Allcott et al., 2020; Kross et al., 2013; Lin & Utz, 2015; Verduyn et al., 2015; Vogel et al., 2015). However, our natural setting also carries some limitations. First the assignment to groups (users and non-users) as a result of the organization’s Facebook policy is not random as it would be in a lab experiment and does not completely eliminate selection bias. Second, we were limited to a relatively small sample which means that our statistical power is low. Third, our population was characterized by a particularly passive usage of Facebook which may drive our main results.
The interpretation of our results is based on the argument that the restrictions imposed on the employees in our sample serve as an external barrier to using Facebook, which “assigns” them into the groups of users and non-users. Nonetheless, there is a concern that non-users and users have different characteristics, which are associated with the projects they work on. For example, it may be that the projects in which Facebook use is forbidden are top secret, and working on such projects may be systematically associated with high job satisfaction, which, in turn, is correlated with the dependent variables, i.e., social comparison and happiness. Furthermore, it may be that employees in these projects were assigned to them because they have some specific trait desirable in those projects, which again may bias the estimates.
Although this is a valid concern, we believe that it does not create a systematic bias in the estimates, given the nature of the organization and the administration of the questionnaires. Specifically, the questionnaires were administered over a three-week period on the organization’s campus. The participants, both users and non-users, were physically dispersed in different buildings and in different offices and were employed in nine different departments (in various divisions) and 18 different teams. Furthermore, both groups included employees in a variety of positions (administrators, scientists, engineers, managers, etc.). Thus, the diversity in the sample mitigates the risk of systematic in-group bias. In addition, we found that the frequencies of the various everyday experiences of users and non-users in the sample were not significantly different.
There is also a concern regarding non-compliance, as in any field experiment. In our context, this involves employees who were allowed to use Facebook without restriction, but refrained from doing so nevertheless. Thus, the 2015 snapshot distinguishes between treated subjects (non-users) and non-treated subjects (users), although this is not necessarily in perfect alignment with the restrictions imposed on the subjects. This potential non-compliance is a manifestation of self-selection and may bias the estimated effect. We assessed the magnitude of this selection bias by means of post-study interviews and found it to be of a small magnitude (the interviews are described in the online appendix). We also reduced the effect of potential selection bias on the estimation by using a matching procedure, which creates two balanced groups based on their demographic features, and estimating our model on the matched sample.
Future studies should investigate the effect of Facebook on users’ well-being using a larger and more diverse sample, yet attempting to identify unique natural settings in which not using Facebook is not an outcome of one’s choice.
Footnotes
1 Interestingly, in the context of Facebook usage it was found that comparison orientation is the mediating variable between age and the intensity of Facebook activity, suggesting that younger adults are more inclined to compare themselves with others and therefore use Facebook more than older adults (Ozimek & Bierhoff, 2016). Due to the exogenous assignment of non-users in our setting, we can examine the reversed direction of this link.
2 It is also likely that younger users rely on Facebook as a source of social information to a greater extent than older users, who are “used to” collecting social information from offline sources.
3 Distinguishing between different types of envy on social networking sites and users’ response to it have been the focus of many recent studies, such as Lim and Yung (2019), Meier & Johnson (2022), Meier & Schäfer (2018), Noon et al. (2019), Wenninger et al. (2019) and Wenninger et al. (2021).
4 Most of the non-users have never opened a Facebook account. Ten out of them had an account in the past but closed it well before the study (2.34 years before, on average), where the most recent non-users are three employees who closed their account 6 months before the study.
5 Out of the employees who are 29 years old and younger (whose average age is similar to that of the students), 26% did not have an active account.
6 In a previous version of the paper we analyzed the original sample of 144 employees, as well as a matched sample obtained through a different approach – propensity score matching with replacement. The qualitative results are the same in all of these approaches.
7 We estimated a variation of the model which does not include the interaction of social comparison and ∆(pos). Although social comparison significantly reduces happiness, we feel that this variation of the model misses an important element and, accordingly, the estimation’s adjusted R2 is lower than that of the original model’s estimation (see the online appendix for more details).
Conflict of Interest
The authors have no conflict of interests to declare.
Appendices
Appendix A: Questionnaire (translated from Hebrew)
Section A
- Age
- Sex: male / female
- Family status:
- a) married
- b) single
- c) widow/er
- d) divorced
- Education (years):
- a) ≤ 8
- b) 9–11
- c) 12
- d) 13–14
- e) ≥ 15
- The average income per person in Israel is NIS 9,000 gross. How does your income (gross) compare to the average?
- a) Much below the average
- b) Slightly below the average
- c) Average
- d) Slightly above the average
- e) Much above the average
Section B
In this part of the questionnaire, you are asked to assess the frequency with which your friends and acquaintances engage in certain activities and encounter certain situations, on average.
By "friends" we mean all the circles of friends and acquaintances you have built up over the years. By "family" we mean immediate family (spouse/partner, children, parents and siblings).
- How many times a month do your friends go out (to parties, pubs, restaurants, etc.)? ____
- How many books do your friends read a month? ____
- How many movies do your friends watch per month at the cinema? ____ at home? _____
- How many times a month do your friends go out with their spouse/partner? ____
- What percentage of your friends subscribe to an Israeli daily newspaper (printed or online)?
- What percentage of your friends regularly read the non-Hebrew press (newspapers, news websites, blogs, subscribe to feeds, etc.)? ____
- How many articles a month (press / internet) do your friends read? ____
- How many times a month do your friends spend time on family activities? ____
- How many times a month are your friends disappointed with food they have eaten at a restaurant / had delivered or prepared themselves? ___
- How many times a month do your friends get sick? ____
- How many times a month do your friends get upset at work? ____
- How many times a month do your friends quarrel with a family member? ____
- How many times a month do your friends get moody? ____
- How many times a year do your friends go on vacation in Israel or abroad? ____
- On each of questions 1-14 above, we want to know how accurate you believe your answer is. Circle the numbers of the questions for which you believe your assessment is accurate plus/minus 1. How many questions have you circled? ____
Section C
Please indicate the degree to which you agree with each of the following statements on a scale of 1-6, where 1 means strongly disagree and 6 means strongly agree.
- I often compare myself with others with respect to what I have accomplished in life
- I always pay a lot of attention to how I do things compared with how others do things
- I often compare how my loved ones (spouse/partner, family members, etc.) are doing with how others are doing
- I am not the type of person who is always making comparisons with others
- If I want to find out how well I have done something, I compare what I have done with what others have done
- I often compare how I am doing socially (e.g., social skills, popularity) with other people
- If I want to form an opinion about something, I try to find out what others think about it
- I never compare my situation in life to that of other people
- I often see others doing something fun and feel sorry I do not do it as well
- After an enjoyable activity I feel the need to share the experience
- When I hear about the positive experiences of acquaintances, I get ideas about similar things I can do myself
- Sometimes I find it hard to see that other people have achieved things I have still not been able to achieve
Section D
Please indicate how much you agree with each of the following statements on a scale of 1-6, where 1 means strongly disagree and 6 means strongly agree.
- I don’t feel particularly pleased with the way I am
- I feel that life is very rewarding
- I am quite satisfied with everything in my life
- I don’t think I look attractive
- I find beauty in different things
- I can adapt myself to what I want
- I feel fully alert
- I do not have happy memories of the past
Section E
In this section, you are asked to estimate the frequency with which you find yourself in certain situations and engage in various activities in your daily life, on average. Please try to make your evaluations as accurate as possible.
- How many times a month do you go out (to parties, pubs, restaurants, etc.)? ____
- How many books do you read a month? ____
- How many movies do you watch a month at the cinema? _____ at home? _____
- How many times a month do you go out with your spouse/partner? ____
- Do you subscribe to an Israeli daily newspaper (printed or online)? ____
- Do you regularly read the non-Hebrew press (newspapers, news websites, blogs, subscribe to feeds, etc.)? ____
- How many articles a month (press / internet) do you read? ____
- How many times a month you spend time on family activities?
- How many times a month are you disappointed with food you have eaten at a restaurant / had delivered or prepared by yourself? ____
- How many times a month do you get sick? ____
- How many times a month do you get upset at work? ____
- How many times a month do you quarrel with a family member? ____
- How many times a month do you get moody? ____
- How many times a year do you go on vacation in Israel or abroad? ____
Section F
In this section, we want to know about your use of Facebook.
- Do you have a Facebook account?
- a) Yes. I have an active account.
- b) I have an account but it is not active. (How long has the account been inactive? _____)
- c) I had a Facebook account but closed it. (How long ago? ___________)
- d) No. I have never had a Facebook account.
- What proportion of your friends use Facebook?
If you are not sure, give your best estimate ___________%
This is the end of the questionnaire for those of you who do not have a Facebook account.
- Please indicate how much you agree with each of the following statements on a scale of 1–6, where 1 means strongly disagree and 6 means strongly agree.
- a) Facebook is part of my daily activity
b) I am proud to tell people I'm on Facebook
c) Facebook has become part of my daily routine
d) I feel out of touch when I haven't logged onto Facebook for a while
e) I feel I am part of the Facebook community
f) I would be sorry if Facebook shut down - How often on average do you check your Facebook account?
- Every few minutes
- Every hour
- Several times a day
- Every day
- Every few days
- Once a week
- g) Less than once a week
- In the past week, on average, approximately how much time a day have you spent actively using Facebook? ___ (minutes)
- Specify the extent to which you use Facebook for each of the following activities, where 1 means that you do not use Facebook for this activity and 6 means that you use Facebook mostly for this activity.
- Look at pictures posted by others
- Read articles / reports
- Watch amusing videos
- Know what is happening to people who are close to me
- Know about social events that are to take place
- Keep up on what is happening in the country and on the views of the public about what is happening
- Keep in touch with distant acquaintances
- Keep in touch with social and professional groups
- Share my thoughts and my views
- To what extent do you perform the following actions on Facebook, where 1 means not at all and 6 means very frequently?
- Post statuses
- Upload photos and videos
- Like
- Comments
- Tag places, friends, etc.
Comment: Construction of the Variables ∆(pos) and ∆(neg)
Based on the answers to sections B and E, we measured the difference between the frequency of others’ positive and negative experiences and one’s own. Because the differences in frequencies for the various experiences (questions) use different scales, the difference for each experience was translated into a relative score, i.e., a percentile for that experience. We then averaged across the 10 positive experiences to obtain the variable ∆(pos) and averaged across the 5 negative experiences to obtain the variable ∆(neg). Thus, a high value of ∆(pos) (∆(neg)) indicates that, relative to the sample, an individual tends to believe that others have more positive (negative) experiences than he does.
Appendix B: Complementary Analysis
As mentioned in the main text, the assignment into users and non-users was not random and therefore there is the possibility that it is associated with personal characteristics that are correlated with social comparison and happiness. Our main analysis, which was carried out on a matched sample based on propensity scores, partially deals with this issue, since the treatment and control groups are balanced in the observed variables. However, it is still possible that the after-matching assignment is associated with important unobservable variables. Furthermore, and as in other field experiments, there may be non-compliers among the participants who decided not to use Facebook even though they did not face any particularly severe usage restrictions, thus introducing self-selection bias. To address these issues, we conducted post-study interviews with non-users in order to assess the magnitude of self-selection in our sample. In addition, we compared the sample to a parallel group of university students in order to determine whether it is unique in its characteristics and its pattern of Facebook usage. This allows us to evaluate the generalizability of the results.
Post-Study Interviews
In order to estimate the magnitude of self-selection in our sample, we conducted post-study interviews with the organization’s non-user employees, trying to understand their reasons for not using Facebook and how those reasons relate to the restrictions placed on them. We interviewed 38 employees who do not use Facebook.
When asked to explain why they do not use Facebook, 32 out of the 38 employees cited the restrictions placed on them by the organization. Of the other six, three had restrictions placed on them at the time of the study, and two were forbidden to use Facebook in the past. Although those five employees did not state the restrictions as the reason for not using Facebook, their choice of not using Facebook might have been affected by these unique circumstances (possibly without their awareness). Thus, only one of the 38 employees chose not to use Facebook despite of not being restricted in the past or at the time of the study.
The interviews suggest that our non-user group includes a small number of employees who do not use Facebook out of choice. For these employees, the choice not to use Facebook may be correlated with some personal characteristics, which in turn may be correlated with their social comparison and happiness. However, self-selection into the group of non-users based on individual differences is small in magnitude: a conservative conclusion would be that 16% (6 out of 38) of our non-users might have voluntarily selected not to use Facebook. Since the choice of 5 out of these 6 employees might have been affected by the restrictions in the past or in the present, we believe that the magnitude of self-selection is actually smaller than that.
Comparison to a Different Group of Facebook Users Outside the Organization
The generalization of our findings depends on the degree to which the sample is representative. In order to determine whether the level of social comparison and happiness or the pattern of Facebook usage is unique to the sample or representative of the population, we compared the results for our matched sample to those for a sample of 175 undergraduates with a comparable socioeconomic background at a university located near the organization’s facility. The student sample, which was close to gender-balanced (49% females) and aged 18-35 (average age: 22.4), completed an identical questionnaire online. Only four percent of the students were not Facebook users. Thus, we compare only Facebook users in the two samples. Although the original sample is unique in some ways (i.e., employees of a security-related organization), we found that the social comparison and happiness scores of Facebook users were similar in the two samples when controlling for demographic variables (social comparison: B = −0.007 (0.187), p = .971, n = 208; happiness: B = 0.192 (0.141), p = .175, n = 208, see Table A1). This suggests that the original sample is not unique with respect to the variables of interest.
The pattern of Facebook usage, however, differs between the two samples even when controlling for demographic variables. Thus, Facebook usage in the student sample is more intense: they feel more connected to Facebook (question F3); they spend more time on Facebook (question F5, minutes per day); and they check their account more frequently (question F4). Accordingly, they have a higher usage intensity score relative to the original sample (B = 0.647 (0.223), p = .004, n = 208, Table A2). Nonetheless, Facebook usage in the original sample is not negligible: they spend an average of 48 minutes on Facebook each day (median of about 30 minutes) and 78% of the users check their account at least once a day (34% more than once). Furthermore, the students are more active according to the passive vs. active measure derived from question F6 (B = −0.936 (0.243), p < .001, n = 208, Table A2).1 On the other hand, the samples are similar in the balance between self-focused and others-focused Facebook activity, as reflected in the answers to question F7 (B = 0.015 (0.036), p = .667, n = 208, Table A2).2
Although the two groups differ with respect to age and the other demographic variables that may affect Facebook usage, it is nonetheless of interest to compare their overall patterns of Facebook usage. It appears that the original sample is somewhat more passive than the student sample (mean passive vs. active index: 3.045 (0.258) vs. 2.539 (0.076), respectively). Nevertheless, passive usage is quite common also among the students: after eliminating the most active 38% of the student sample, the average becomes 3.002 (0.097), similar to that of the original sample. Thus, the passive usage observed in the original sample is not uncommon among a large group of individuals not subject to any usage restrictions. In fact, passive social media usage is prevalent in the general population and is becoming an increasing concern, as manifested in recent studies (e.g., Verduyn et al., 2015).
Students and Employees’ Happiness and Social Comparison Score
Considering only Facebook users, we compare a population of students with the employees in the organization. The following table presents the OLS estimation for two models, one in which social comparison level is the dependent variable and another in which happiness is the dependent variable. In both, the explanatory variables are the demographic variables as well as a dummy variable – whether the subject belongs to the sample of students (= 1) or to the sample of employees in the organization (= 0).
Table A1. Students and Employees’ Happiness and Social Comparison Score.
|
|
Social comparison |
Happiness |
|
Age |
−0.051** (0.020) |
0.021 (0.015) |
|
Gender |
−0.028 (0.125) |
−0.051 (0.094) |
|
Education |
−0.049 (0.089) |
0.019 (0.067) |
|
Income |
−0.042 (0.067) |
0.059 (0.050) |
|
Family |
−0.636** (0.253) |
0.069 (0.190) |
|
Students |
−0.007 (0.187) |
0.192 (0.141) |
|
R2 |
.060 |
.035 |
|
N |
208 |
208 |
|
Note. * p < .1, ** p < .05, *** p < 0.01 |
||
Students and Employees’ Facebook Usage
The following table presents the estimation results of three OLS models. The dependent variables are: intensity of usage, a measure of active vs. passive usage and a measure of self-focused vs. others-focused usage. The results show that the students use Facebook more intensely than the employees. They are also more active vs. passive. However, the balance between self-focused and others-focused activity is the same for the two samples.
Table A2. Students and Employees’ Facebook Usage.
|
|
Intensity |
Passive vs. active |
Self vs. others |
|
Age |
−0.034 (0.024) |
−0.048* (0.026) |
0.009* (0.004) |
|
Gender |
0.062 (0.149) |
−0.153 (0.162) |
0.029 (0.024) |
|
Education |
0.010 (0.106) |
−0.281** (0.116) |
0.023 (0.017) |
|
Income |
0.047 (0.080) |
−0.012 (0.087) |
−0.019 (0.013) |
|
Family |
−0.576* (0.301) |
−0.142 (0.328) |
0.003 (0.049) |
|
Students |
0.647*** (0.223) |
−0.936*** (0.243) |
0.015 (0.036) |
|
R2 |
.069 |
.092 |
.050 |
|
N |
208 |
208 |
208 |
|
Note. *p < .1, **p < .05, *** p < .01. |
|||
Appendix C: Supplementary Tables and Figures
Table A3. The Correlations Between the Study Variables.
|
1. |
2. |
3. |
4. |
5. |
6. |
7. |
8. |
9. |
10. |
11. |
|
|
1. Age |
1 |
−.397 ** |
.537 ** |
.777 ** |
−.573 ** |
−0.112 |
−0.05 |
−0.172 |
−0.045 |
−0.137 |
0.128 |
|
2. Gender |
1 |
−.464 ** |
−.350 ** |
0.159 |
0.062 |
0.052 |
.228 * |
0.076 |
−0.044 |
−0.145 |
|
|
3. Education |
1 |
.471 ** |
−.405 ** |
−.265 * |
−0.084 |
−0.074 |
−0.068 |
0.051 |
0.029 |
||
|
4. Income |
1 |
−.593 ** |
−0.172 |
−0.049 |
−0.128 |
0.085 |
−0.069 |
0.173 |
|||
|
5. Family status |
1 |
0.217 |
0.051 |
0.113 |
−0.161 |
−0.055 |
−0.054 |
||||
|
6. % Friends Facebook |
1 |
0.215 |
−0.099 |
−0.13 |
0.068 |
−0.059 |
|||||
|
7. Facebook |
1 |
−0.021 |
0.028 |
0.185 |
−0.176 |
||||||
|
8. ∆(pos) |
1 |
0.17 |
0.095 |
−0.151 |
|||||||
|
9. ∆(neg) |
1 |
−0.077 |
.264 * |
||||||||
|
10. Social comparison |
1 |
−.291 ** |
|||||||||
|
11. Happiness |
1 |
||||||||||
|
Note. Gender: 1 is male, 2 is female. Education: 3 is high-school education, 5 is more than 15 years of education and 4 is in between. Income: 3 is the average income in the country, 1 is much lower and 5 is much higher than the average income. Family status: 1 is married and 2 is single. Social comparison and happiness are both between 1 and 6. ∆(pos) is the extent (potentially between 0 and 1) to which one finds others’ lives richer in positive experiences compared to one’s own; ∆(neg) is the analogous extent for negative experiences. |
|||||||||||
Perception of Others’ Lives
We found that Facebook usage has no impact on the ∆(pos) and ∆(neg) scores (∆(pos): B = −0.007 (0.026), p = .776, n = 82, ∆(neg): B = 0.009 (0.039), p = .808, n = 82), using an OLS regression model with the demographic variables as covariates. We tested a number of models for both ∆(pos) and ∆(neg) and obtained Facebook coefficients that are very small in magnitude and non-significant (four models are presented in Tables S4 and S5 each). Note, however, that given our small sample, the minimal effect size that we can detect with a power of 80% is f2 = 0.14, whereas the effect size of both ∆(pos) and ∆(neg) is 0.001.3 It is also possible that the participants referred to the experiences of their close friends when evaluating the frequency of positive and negative experiences others (even though they were instructed to consider “all the circles of friends and acquaintances you have built up over the years”). In such a case, differences between evaluation of users and non-users shrink because social media are likely to be used more to gain information on friends we are less close to.
To further examine the robustness of the null result, we conducted multivariate analysis. We calculated, for each question in Section B and its parallel in Section E, the difference between the estimated frequency with which friends experience something and the frequency with which the participant experiences it. Thus, 15 differences were obtained: ∆posi, where i = 1,…,10 (for the 10 questions on positive experiences) and ∆negi, where i = 1,...,5 (for the 5 questions on negative experiences). Multivariate analysis using the demographic variables as covariates affirmed that Facebook usage does not affect the set ∆posi, i = 1,…,10 (Pillai’s Trace = 0.095, Wilks’ Lambda = 0.905, Hotelling’s Trace = 0.105, Roy’s Largest Root = 0.105, F = 0.696, p = .724) nor does it affect the set ∆negi, i = 1,...,5 (Pillai's Trace = 0.070, Wilks’ Lambda = 0.930, Hotelling’s Trace = 0.075, Roy’s Largest Root = 0.075, F = 1.07, p = .384). Similar qualitative results were obtained when allowing for an interaction of Facebook and age.
The finding that there is no significant bias in the perception is somewhat surprising in view of the fact that Facebook is considered to be a tool for impression management and that users tend to portray improved versions of themselves there (Zhao et al., 2008). Moreover, earlier findings suggest that users tend to believe that others have better lives than they do (Chou and Edge, 2012). Taking our results with a grain of salt, they suggest that users (at least partially) self-correct for this bias when thinking about particular experiences, perhaps due to the increasing attention given to this issue in popular media4, and the understanding that Facebook photos and reports do not represent reality.
The Effect of Facebook on ∆(pos)
The following table presents the OLS estimation of four models in which ∆(pos) is the dependent variable, where the explanatory variables are the demographic variables and Facebook usage. We also explore the interaction of Facebook usage and age. We found that Facebook have no significant effect on this index.
Table A4. The Effect of Facebook on ∆(pos).
|
|
∆(pos) |
∆(pos) |
∆(pos) |
∆(pos) |
|
Age |
−0.002 (0.003) |
0.001 (0.004) |
−0.002 (0.003) |
−0.001 (0.003) |
|
Gender |
0.056* (0.033) |
0.060* (0.033) |
0.060* (0.033) |
|
|
Education |
0.011 (0.02) |
0.012 (0.019) |
0.014 (0.019) |
|
|
Income |
0.002 (0.012) |
0.002 (0.012) |
0.003 (0.012) |
|
|
Family |
0.022 (0.036) |
0.028 (0.036) |
0.017 (0.036) |
|
|
|
−0.002 (0.027) |
0.129 (0.109) |
|
0.093 (0.107) |
|
% Friends Facebook |
−0.001 (0.001) |
−0.001 (0.001) |
|
|
|
Facebook X age |
|
−0.005 (0.004) |
|
−0.004 (0.004) |
|
Facebook intensity |
|
|
−0.003 (0.007) |
|
|
R2 |
.082 |
.101 |
.072 |
.042 |
|
N |
82 |
82 |
82 |
82 |
|
Note. *p < .1, **p < .05, *** p < .01. |
||||
The Effect of Facebook on ∆(neg)
The following table presents the OLS estimation of four models in which ∆(neg) is the dependent variable, where the explanatory variables are the demographic variables and Facebook usage. We also explore the interaction of Facebook usage and age. We found that Facebook have no significant effect on this index.
Table A5. The Effect of Facebook on ∆(neg).
|
|
∆(neg) (1) |
∆(neg) (2) |
∆(neg) (3) |
∆(neg) (4) |
|
Age |
−0.007 (0.005) |
−0.010 (0.006) |
−0.008 (0.005) |
−0.003 (0.004) |
|
Gender |
−0.009 (0.048) |
−0.005 (0.049) |
−0.015 (0.049) |
|
|
Education |
−0.026 (0.029) |
−0.027 (0.029) |
−0.022 (0.028) |
|
|
Income |
0.022 (0.018) |
0.022 (0.019) |
0.023 (0.018) |
|
|
Family |
−0.082 (0.053) |
−0.088 (0.054) |
−0.090* (0.053) |
|
|
|
0.017 (0.039) |
−0.115 (0.162) |
|
−0.082 (0.162) |
|
% Friends Facebook |
−0.001 (0.001) |
−0.001 (0.001) |
|
|
|
Facebook X age |
|
0.005 (0.006) |
|
0.003 (0.006) |
|
Facebook intensity |
|
|
−0.007 (0.011) |
|
|
R2 |
.094 |
.103 |
.085 |
.007 |
|
N |
82 |
82 |
82 |
82 |
|
Note. * p < .1, ** p <.05, *** p < .01 |
||||
The Results of a Mediated Moderation Model Without Moderation of ∆(pos)
Table A6. The Results of a Mediated Moderation Model Without Moderation
of ∆(pos).
|
|
Social comparison |
Happiness |
|
|
2.455*** (0.812) |
−0.188 (0.134) |
|
Age |
0.022 (0.021) |
|
|
Facebook X age |
−0.08** (0.03) |
|
|
Δ(neg) |
1.041*** (0.386) |
|
|
Social comparison |
|
−0.158** (0.074) |
|
Δ(pos) |
|
−0.996* (0.576) |
|
R2 |
.146 |
.193 |
|
N |
82 |
82 |
|
Note. *p < .1, **p < .05, *** p < .01 |
||
The following table presents the results of an estimation of variation of the model outlined in Figure 1, eliminating the interaction term social comparison X Δ(pos). We find a significant effect of Facebook and of Facebook X age on social comparison, as well as a main effect of social comparison on happiness. The estimated effect of Facebook use on happiness level is significant for the 10th, 25th and 50th percentiles of age, and is not significant for the higher percentiles, as in the original model’s estimation. For the 19-, 22- and 25-year-olds, the effects are: −0.149 (0.103), −0.111 (0.077) and −0.074 (0.054), respectively.
The Estimated Indirect Effect of Facebook on Happiness
Based on the estimation on Table 2, the following table summarizes the indirect effect of Facebook on happiness given the different values of the two moderators (the values for age and ∆(pos) moderators that correspond to the 10th, 25th, 50th, 75th, and 90th percentiles).
Table A7. The Estimated Indirect Effect of Facebook on Happiness.
|
Age |
∆ (pos) |
Effect |
Boot SE |
BootLLCI |
BootULCI |
|
19 |
0.29 |
0.036 |
0.098 |
−0.140 |
0.260 |
|
19 |
0.32 |
−0.003 |
0.087 |
−0.195 |
0.163 |
|
19 |
0.41 |
−0.120 |
0.083 |
−0.354 |
−0.002 |
|
19 |
0.49 |
−0.225 |
0.114 |
−0.504 |
−0.043 |
|
19 |
0.57 |
−0.329 |
0.158 |
−0.684 |
−0.056 |
|
22 |
0.29 |
0.027 |
0.073 |
−0.101 |
0.197 |
|
22 |
0.32 |
−0.002 |
0.065 |
−0.145 |
0.127 |
|
22 |
0.41 |
−0.090 |
0.062 |
−0.263 |
−0.002 |
|
22 |
0.49 |
−0.168 |
0.086 |
−0.375 |
−0.031 |
|
22 |
0.57 |
−0.245 |
0.120 |
−0.511 |
−0.042 |
|
25 |
0.29 |
0.018 |
0.050 |
−0.061 |
0.145 |
|
25 |
0.32 |
−0.001 |
0.044 |
−0.095 |
0.087 |
|
25 |
0.41 |
−0.059 |
0.043 |
−0.183 |
−0.002 |
|
25 |
0.49 |
−0.111 |
0.062 |
−0.267 |
−0.014 |
|
25 |
0.57 |
−0.162 |
0.089 |
−0.374 |
−0.017 |
|
30 |
0.29 |
0.003 |
0.024 |
−0.034 |
0.071 |
|
30 |
0.32 |
0.000 |
0.020 |
−0.050 |
0.029 |
|
30 |
0.41 |
−0.009 |
0.031 |
−0.093 |
0.040 |
|
30 |
0.49 |
−0.016 |
0.054 |
−0.138 |
0.082 |
|
30 |
0.57 |
−0.023 |
0.079 |
−0.203 |
0.116 |
|
35 |
0.29 |
−0.013 |
0.047 |
−0.181 |
0.043 |
|
35 |
0.32 |
0.001 |
0.042 |
−0.083 |
0.097 |
|
35 |
0.41 |
0.042 |
0.057 |
−0.019 |
0.220 |
|
35 |
0.49 |
0.079 |
0.089 |
−0.051 |
0.305 |
|
35 |
0.57 |
0.116 |
0.126 |
−0.080 |
0.423 |
|
Note. Significant effects are in bold. |
|||||
The Results of a Mediated Moderation Model With Intensity of Facebook Usage
The following table reports the estimation of the effect of Facebook usage intensity on social comparison and happiness, using a variation of the mediated moderation model described in Figure 1 (replacing Facebook in Facebook intensity). We find a significant effect of Facebook intensity on social comparison and significant interactions – Facebook intensity X age and Social comparison X Δ(pos).
Table A8. The Results of a Mediated Moderation Model With Intensity
of Facebook Usage.
|
|
Social comparison |
Happiness |
|
Facebook intensity |
0.733*** (0.23) |
−0.053 (0.036) |
|
Age |
0.021 (0.02) |
|
|
Facebook intensity X age |
−0.024*** (0.009) |
|
|
Δ(neg) |
1.189*** (0.373) |
|
|
Social comparison |
|
0.442* (0.226) |
|
Δ(pos) |
|
3.659** (1.766) |
|
Social comparison X Δ(pos) |
|
−1.373*** (0.496) |
|
R2 |
.146 |
.277 |
|
N |
82 |
82 |
|
Note. * p < .1, ** p < .05, *** p < .01 |
||
The Estimated Indirect Effect of Intensity of Using Facebook on Happiness
The following table summarizes the indirect effect of Facebook intensity on happiness (based on the estimation reported on Table A8) given the different values of the two moderators (the values correspond to the 10th, 25th, 50th, 75th, and 90th).
Table A9. The Estimated Indirect Effect of Intensity of Using Facebook on Happiness.
|
Age |
∆ (pos) |
Effect |
Boot SE |
BootLLCI |
BootULCI |
|
19 |
0.29 |
0.012 |
0.029 |
−0.037 |
0.082 |
|
19 |
0.32 |
0.001 |
0.026 |
−0.050 |
0.056 |
|
19 |
0.41 |
−0.033 |
0.025 |
−0.098 |
0.004 |
|
19 |
0.49 |
−0.063 |
0.034 |
−0.145 |
−0.010 |
|
19 |
0.57 |
−0.094 |
0.046 |
−0.200 |
−0.017 |
|
22 |
0.29 |
0.009 |
0.021 |
−0.026 |
0.063 |
|
22 |
0.32 |
0.001 |
0.019 |
−0.036 |
0.042 |
|
22 |
0.41 |
−0.024 |
0.019 |
−0.073 |
0.003 |
|
22 |
0.49 |
−0.047 |
0.026 |
−0.111 |
−0.008 |
|
22 |
0.57 |
−0.069 |
0.035 |
−0.154 |
−0.012 |
|
25 |
0.29 |
0.006 |
0.014 |
−0.015 |
0.046 |
|
25 |
0.32 |
0.000 |
0.013 |
−0.023 |
0.030 |
|
25 |
0.41 |
−0.016 |
0.013 |
−0.053 |
0.001 |
|
25 |
0.49 |
−0.030 |
0.019 |
−0.078 |
−0.003 |
|
25 |
0.57 |
−0.044 |
0.026 |
−0.107 |
−0.004 |
|
30 |
0.29 |
0.000 |
0.007 |
−0.010 |
0.019 |
|
30 |
0.32 |
0.000 |
0.006 |
−0.012 |
0.012 |
|
30 |
0.41 |
−0.001 |
0.009 |
−0.024 |
0.013 |
|
30 |
0.49 |
−0.002 |
0.015 |
−0.037 |
0.025 |
|
30 |
0.57 |
−0.003 |
0.022 |
−0.055 |
0.035 |
|
35 |
0.29 |
−0.005 |
0.015 |
−0.059 |
0.014 |
|
35 |
0.32 |
0.000 |
0.013 |
−0.034 |
0.025 |
|
35 |
0.41 |
0.013 |
0.016 |
−0.006 |
0.062 |
|
35 |
0.49 |
0.026 |
0.025 |
−0.013 |
0.087 |
|
35 |
0.57 |
0.038 |
0.035 |
−0.021 |
0.117 |
|
Note. Significant effects are in bold. |
|||||
Bootstrap Estimates of Regression Coefficients for the Model Outlined in Figure 1
The following tables report the summary statistics of regression coefficients obtained through bootstrapping (B = 5,000 bootstrap samples), estimating the model outlines in Figure 1. The results are similar to those presented in Table 2. In particular, we find a significant effect of Facebook on social comparison and significant interactions – Facebook X age and Social comparison X Δ(pos).
Table A10a. Dependent Variable: Social Comparison.
|
Coefficient |
BootMean |
BootSE |
BootLLCI |
BootULCI |
|
|
|
2.455 |
2.513 |
0.952 |
0.749 |
4.478 |
|
Age |
0.022 |
0.023 |
0.027 |
−0.023 |
0.081 |
|
Facebook X age |
−0.08 |
−0.081 |
0.034 |
−0.153 |
−0.018 |
Table A10b. Dependent Variable: Happiness.
|
Coefficient |
BootMean |
BootSE |
BootLLCI |
BootULCI |
|
|
|
−0.139 |
−0.149 |
0.134 |
−0.416 |
0.114 |
|
∆(neg) |
1.214 |
1.186 |
0.448 |
0.319 |
2.074 |
|
Social comparison |
0.44 |
0.445 |
0.213 |
0.015 |
0.860 |
|
∆(pos) |
3.69 |
3.699 |
1.790 |
−0.125 |
7.246 |
|
Social comparison X ∆(pos) |
−1.383 |
−1.380 |
0.484 |
−2.282 |
−0.332 |
Facebook Usage of Younger Vs. Older Employees
Considering only Facebook users in the organization, the following table compares the type of usage and intensity of usage of the group of young users (24 and younger) with that of older users (25 and older). No significant differences were found. The “continuous” variable age, however, was found to be correlated with the self vs. others index (Pearson r = .321, p = .041), with the frequency of checking the account (Pearson r = .368, p = .018), with the % of friends who use Facebook (Pearson r = −.313, p = .046) and, in the 10% significance level, with the passive vs. active index (Pearson r = −.282, p = .074). Namely, younger employees have more friends who use Facebook, they tend to check their account more often and their usage is more passive and more focused on others than on themselves.
Table A11. Facebook Usage of Younger vs. Older Employees.
|
|
|
N |
M |
SD |
t |
p |
|
Association |
25 & older |
21 |
3.32 |
1.32 |
0.61 |
.54 |
|
24 & younger |
20 |
3.06 |
1.39 |
|||
|
Frequency |
25 & older |
21 |
4.19 |
1.03 |
1.76 |
.87 |
|
24 & younger |
20 |
3.65 |
0.93 |
|||
|
Time |
25 & older |
21 |
48.10 |
51.82 |
0.02 |
.99 |
|
24 & younger |
20 |
47.85 |
49.65 |
|||
|
Facebook intensity |
25 & older |
21 |
3.30 |
1.18 |
0.29 |
.77 |
|
24 & younger |
20 |
3.19 |
1.19 |
|||
|
% Friends Facebook |
25 & older |
21 |
90.57 |
7.78 |
−1.41 |
.17 |
|
24 & younger |
20 |
93.65 |
6.17 |
|||
|
Passive vs. active |
25 & older |
21 |
2.80 |
1.32 |
−0.96 |
.34 |
|
24 & younger |
20 |
3.30 |
1.94 |
|||
|
Self vs. others |
25 & older |
21 |
0.51 |
0.22 |
1.26 |
.22 |
|
24 & younger |
20 |
0.44 |
0.13 |
The Results of a Mediated Moderation Model With Binary Moderators
The following table reports the estimation of the effect of Facebook usage on social comparison and happiness, using a variation of the mediated moderation model described in Figure 1 by replacing the continuous variables Age and Δ(pos) and Δ(neg) in the binary variables Age < 25, Δ(pos)H and Δ(neg)H, respectively. We find significant interactions – Facebook X (Age < 25) and Social comparison X Δ(pos)H. Thus, the indirect effect of Facebook on Happiness is significant only for the younger employees with high level of Δ(pos), as reported in Figure 2.
Table A12. The Results of a Mediated Moderation Model With Binary Moderators.
|
|
Social comparison |
Happiness |
|
|
−0.095 (0.248) |
−0.165 (0.13) |
|
Age < 25 |
−0.289 (0.272) |
|
|
Facebook X (Age < 25) |
0.94** (0.387) |
|
|
Δ(neg)H |
0.398*** (0.129) |
|
|
Social comparison |
|
0.046 (0.09) |
|
Δ(pos)H |
|
1.251*** (0.457) |
|
Social comparison X Δ(pos)H |
|
−0.408*** (0.13) |
|
R2 |
.127 |
.255 |
|
N |
82 |
82 |
|
Note. * p <.1, ** p < .05, *** p < .01. |
||
Figure A1. Cumulative Distribution of Social Comparison Level
Among Younger Users and Non-Users.
Figure A2. Cumulative Distribution of Social Comparison Level
Among Older Users and Non-Users.
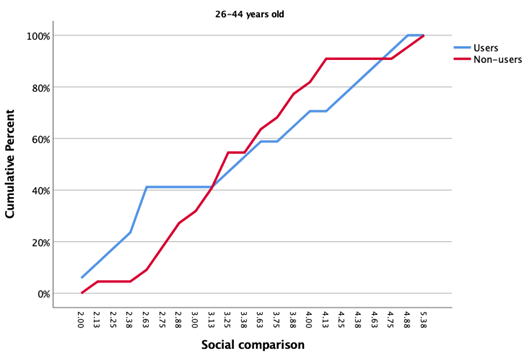
Figure A3. Cumulative Distribution of Social Comparison Level
Among All Users and Non-Users.

Figure A4. Cumulative Distribution of Happiness Level
Among All Users and Non-Users.
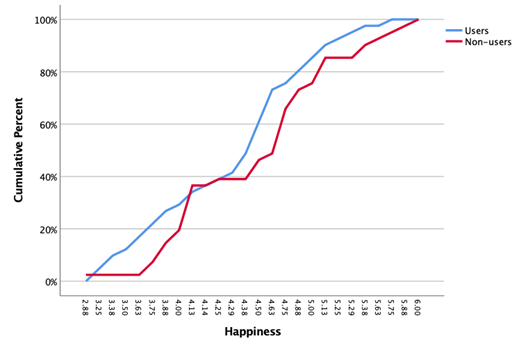
Figure A5. Cumulative Distribution of ∆(pos)
Among All Users and Non-Users.
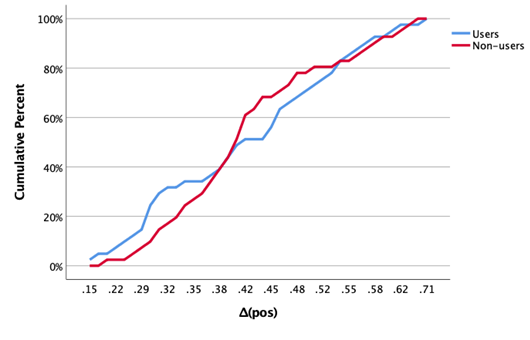
Figure A6. Cumulative Distribution of ∆(neg)
Among All Users and Non-Users.

Figure A7. The Association Between Social Comparison
and Happiness Levels Among All Employees.

Footnotes in Appendices
1 The passive vs. active measure is based on Question 6 in Section F and reflects the ratio between passive activities (e.g., learning) and active usage (e.g., connecting): (q1+q2+q3+q4+q5+q6) / (q7+q8+q9). Thus, a higher score indicates that usage is more passive.
2 The self vs. others measure is the ratio between self-focused and others-focused activity, based on the five answers to question 7 in Section F: (q1+q2) / (q3+q4+q5). Thus, a higher score indicates that the user is more self-focused.
3 In the social sciences, f2 effect sizes of 0.02, 0.15 and 0.35 are considered small, medium and large, respectively (Cohen, 1988).
4 E.g., https://www.newyorker.com/tech/elements/how-facebook-makes-us-unhappy
References in Appendices
Chou, H.-T. G., & Edge, N. (2012). “They are happier and having better lives than I am”: The impact of using Facebook on perceptions of others' lives. Cyberpsychology, Behavior, and Social Networking, 15(2), 117–121. https://doi.org/10.1089/cyber.2011.0324
Cohen, J. (1988). Statistical Power Analysis for the Behavioral Sciences. Routledge.
Verduyn, P., Lee, D. S., Park, J., Shablack, H., Orvell, A., Bayer, J., Ybarra, O., Jonides, J., & Kross, E. (2015). Passive Facebook usage undermines affective well-being: Experimental and longitudinal evidence. Journal of Experimental Psychology: General, 144(2), 480–488. https://doi.org/10.1037/xge0000057
Zhao, S., Grasmuck, S., & Martin, J. (2008). Identity construction on Facebook: Digital empowerment in anchored relationships. Computers in Human Behavior, 24(5), 1816–1836. https://doi.org/10.1016/j.chb.2008.02.012

This work is licensed under a Creative Commons Attribution-ShareAlike 4.0 International License.
Copyright © 2023 Ayala Arad, Ohad Barlizaly, Maayan Perchick