
Technology-facilitated abuse of young adults in the United States: A latent class analysis
Vol.17,No.3(2023)
Elizabeth A. Mumford
 Poulami Maitra
Jackie Sheridan
Emily F. Rothman
Poulami Maitra
Jackie Sheridan
Emily F. Rothman
Awareness of the growing potential for technology-facilitated abuse (TFA) raises questions about the prevalence of the problem overall and in various forms. The current study fielded a newly developed comprehensive measure of 27 different forms of TFA in a nationally representative sample of US adults ages 18–35. Item response theory analytic techniques were applied to identify items that captured the range of young adult experiences, resulting in a 17-item version of the Cyber-Abuse Research Initiative (CARI) scale. Latent class analyses were applied to identify person-centered profiles of TFA victimization. Seven out of ten respondents reported TFA victimization of some or multiple forms, which LCA results indicated could be characterized as five different TFA profiles. The probability of membership in TFA victimization profiles, compared to those respondents reporting low exposure to no TFA, was greater for women, LGBQA+ young adults, and for individuals who consider themselves to have a public following. In addition to providing the flexible, comprehensive CARI scale for ongoing research, the current results may be applied towards both TFA prevention and disruption efforts.
technology-facilitated abuse; communications; reputational harm; surveillance; fraud
Elizabeth A. Mumford
Public Health Research, NORC at the University of Chicago, Chicago, Illinois, United States
Elizabeth A. Mumford, PhD, Principal Research Scientist at NORC at the University of Chicago, conducts research regarding contextual explanations for risky behaviors with a central focus on sexual harassment, sexual assault, technology-facilitated abuse, and interpersonal aggression.
Poulami Maitra
Public Health Research, NORC at the University of Chicago, Chicago, Illinois, United States
Poulami Maitra, PhD, is a Senior Statistician at NORC at the University of Chicago. She has experience in designing and analyzing experiments, survival data, longitudinal data, Bayesian hierarchical modeling, shrinkage methodologies, predictive analytics using machine learning methods, missing data imputation methods, small area estimation (SAE) models and structural equations models.
Jackie Sheridan
Public Health Research, NORC at the University of Chicago, Chicago, Illinois, United States
Jackie Sheridan-Johnson, MPH, is a Senior Research Associate at NORC at the University of Chicago.
Emily F. Rothman
Department of Occupational Therapy, Sargent College, Boston University, Boston, Massachusetts, United States
Emily F. Rothman, ScD, is Professor and Chair of the Occupational Therapy Department at Boston University. She conducts research on interpersonal violence and on autism.
Erica Olsen
National Network to End Domestic Violence, Washington, DC, USA
Erica Olsen, MSW, is the Safety Net Project Senior Director at the National Network to End Domestic Violence. Through the Safety Net Project, Erica works with private industry, state, and federal agencies and international groups to improve safety and privacy for victims in this digital age.
Elaina Roberts
National Network to End Domestic Violence, Washington, DC, USA
Elaina Roberts, JD, was the Technology Safety Legal Manager of the Safety Net Project at the National Network to End Domestic Violence and is currently a grants management specialist at the Office on Violence Against Women in the U.S. Department of Justice.
Abreu, R. L., & Kenny, M. C. (2018). Cyberbullying and LGBTQ youth: A systematic literature review and recommendations for prevention and intervention. Journal of Child & Adolescent Trauma, 11(1), 81–97. https://doi.org/10.1007/s40653-017-0175-7
Afrouz, R. (2021). The nature, patterns and consequences of technology-facilitated domestic abuse: A scoping review. Trauma, Violence, & Abuse, 24(2), 913–927. https://doi.org/10.1177_15248380211046752
Agustina, J. R. (2015). Understanding cyber victimization: Digital architectures and the disinhibition effect. International Journal of Cyber Criminology, 9(1), 35–54. http://dx.doi.org/10.5281/zenodo.22239
Ahlgrim, B., & Terrance, C. (2018). Perceptions of cyberstalking: Impact of perpetrator gender and cyberstalker/victim relationship. Journal of Interpersonal Violence, 36(7–8), NP4074–NP4093. https://doi.org/10.1177/0886260518784590
Anderson, E. L., Steen, E., & Stavropoulos, V. (2017). Internet use and problematic internet use: A systematic review of longitudinal research trends in adolescence and emergent adulthood. International Journal of Adolescence and Youth, 22(4), 430–454. https://doi.org/10.1080/02673843.2016.1227716
Arbuckle, J. L. (1996). Full information estimation in the presence of incomplete data. In G. A. Marcoulides & R. E. Schumacker (Eds.), Advanced structural equation modeling (pp. 243–277). Lawrence Erlbaum Associates.
Bacharach, M. (1965). Estimating nonnegative matrices from marginal data. International Economic Review, 6(3), 294–310. https://doi.org/10.2307/2525582
Baum, K., Catalano, S., Rand, M., & Rose, K. (2009). Stalking victimization in the United States (No. 224527). U.S. Department of Justice Bureau of Justice Statistics. https://www.justice.gov/sites/default/files/ovw/legacy/2012/08/15/bjs-stalking-rpt.pdf
Beaujean, A. A. (2014). Latent variable modeling using R: A step-by-step guide. Routledge.
Bentler, P. M., & Bonett, D. G. (1980). Significance tests and goodness of fit in the analysis of covariance structures. Psychological Bulletin, 88(3), 588–606. https://doi.org/10.1037/0033-2909.88.3.588
Black, M. C., Basile, K. C., Breiding, M. J., Smith, S. G., Walters, M. L., Merrick, M. T., Chen, J. T., & Stevens, M. R. (2011). The National Intimate Partner and Sexual Violence Survey (NISVS): 2010 summary report. National Center for Injury Prevention and Control, Centers for Disease Control and Prevention. https://www.cdc.gov/violenceprevention/pdf/nisvs_report2010-a.pdf
Borwell, J., Jansen, J., & Stol, W. (2021a). Comparing the victimization impact of cybercrime and traditional crime: Literature review and future research directions. Journal of Digital Social Research, 3(3), 85–110. https://doi.org/10.33621/jdsr.v3i3.66
Borwell, J., Jansen, J., & Stol, W. (2021b). The psychological and financial impact of cybercrime victimization: A novel application of the shattered assumptions theory. Social Science Computer Review, 40(4), 933–954. https://doi.org/10.1177/0894439320983828
Brown, C., Sanci, L., & Hegarty, K. (2021). Technology-facilitated abuse in relationships: Victimisation patterns and impact in young people. Computers in Human Behavior, 124, Article 106897. https://doi.org/10.1016/j.chb.2021.106897
Browne, M. W., & Cudeck, R. (1993). Alternative ways of assessing model fit. Sociological Methods & Research, 21(2), 230–258. https://doi.org/10.1177/0049124192021002005
Campos-Castillo, C. (2015). Revisiting the first-level digital divide in the United States: Gender and race/ethnicity patterns, 2007–2012. Social Science Computer Review, 33(4), 423–439. https://doi.org/10.1177/0894439314547617
Caneppele, S., & Aebi, M. F. (2017). Crime drop or police recording flop? On the relationship between the decrease of offline crime and the increase of online and hybrid crimes. Policing: A Journal of Policy and Practice, 13(1), 66–79. https://doi.org/10.1093/police/pax055
Caridade, S., Braga, T., & Borrajo, E. (2019). Cyber dating abuse (CDA): Evidence from a systematic review. Aggression and Violent Behavior, 48, 152–168. https://doi.org/10.1016/j.avb.2019.08.018
Choi, K.-S., & Lee, J. R. (2017). Theoretical analysis of cyber-interpersonal violence victimization and offending using cyber-routine activities theory. Computers in Human Behavior, 73, 394-402. https://doi.org/10.1016/j.chb.2017.03.061
Cordier, R., Speyer, R., Schindler, A., Michou, E., Heijnen, B. J., Baijens, L., Karaduman, A., Swan, K., Clavé, P., & Joosten, A. V. (2018). Using Rasch analysis to evaluate the reliability and validity of the swallowing quality of life questionnaire: An item response theory approach. Dysphagia, 33(4), 441–456. https://doi.org/10.1007/s00455-017-9873-4
DeKeseredy, W. S., Stoneberg, D. M., & Lory, G. L. (2021). Polyvictimization in the lives of North American female university/college students: The contribution of technology-facilitated abuse. In J. Bailey, A. Flynn, & N. Henry (Eds.), The emerald international handbook of technology-facilitated violence and abuse (pp. 65–81). Emerald Publishing Limited. https://doi.org/10.1108/978-1-83982-848-520211004
Dunn, S. (2021). Is it actually violence? Framing technology-facilitated abuse as violence. In J. Bailey, A. Flynn, & N. Henry (Eds.), The emerald international handbook of technology-facilitated violence and abuse (pp. 25–45). Emerald Publishing Limited. https://doi.org/10.1108/978-1-83982-848-520211002
Dunne, D. (2021). Cyber harassment & celebrities: Exploring personality types, self-efficacy and the types and levels of cyber harassment experienced by celebrities across social media [Master’s thesis, Dún Laoghaire Institute of Art, Design and Technology]. Research@THEA. https://research.thea.ie/handle/20.500.12065/3821
Farrington, D. P., Zych, I., Ttofi, M. M., & Gaffney, H. (2023). Cyberbullying research in Canada: A systematic review of the first 100 empirical studies. Aggression and Violent Behavior, 69, Article 101811. https://doi.org/10.1016/j.avb.2022.101811
Felmlee, D., Rodis, P. I., & Francisco, S. C. (2018). What a B!tch!: Cyber aggression toward women of color. In M. T. Segal & V. Demos (Eds.), Gender and the media: Women’s places (pp. 105–123). Emerald Publishing Limited. https://doi.org/10.1108/S1529-212620180000026008
Fernet, M., Lapierre, A., Hébert, M., & Cousineau, M.-M. (2019). A systematic review of literature on cyber intimate partner victimization in adolescent girls and women. Computers in Human Behavior, 100, 11–25. https://doi.org/10.1016/j.chb.2019.06.005
Fissel, E. R., Graham, A., Butler, L. C., & Fisher, B. S. (2021). A new frontier: Development and validation of an intimate partner cyber abuse measure in an adult-based sample. Social Science Computer Review, 40(4), 974–993. https://doi.org/10.1177/0894439321994618
Francisco, S. C., & Felmlee, D. H. (2022). What did you call me? An analysis of online harassment towards Black and Latinx women. Race and Social Problems, 14(1), 1–13. https://doi.org/10.1007/s12552-021-09330-7
Graham, R. (2020). Race, social media, and deviance. In T. J. Holt & A. M. Bossler (Eds.), The Palgrave handbook of international cybercrime and cyberdeviance (pp. 67–90). Springer International Publishing. https://doi.org/10.1007/978-3-319-78440-3_10
Hassan, S., Yacob, M. I., Nguyen, T., & Zambri, S. (2018). Social media influencer and cyberbullying: A lesson learned from preliminary findings. In Knowledge Management International Conference (KMICe) 2018, 25–27 July 2018, Miri Sarawak, Malaysia. UUM IRepository. http://repo.uum.edu.my/id/eprint/25225/
Hawdon, J., Parti, K., & Dearden, T. E. (2020). Cybercrime in America amid COVID-19: The initial results from a natural experiment. American Journal of Criminal Justice, 45(4), 546–562. https://doi.org/10.1007/s12103-020-09534-4
Henry, N., & Powell, A. (2016). Technology-facilitated sexual violence: A literature review of empirical research. Trauma, Violence, & Abuse, 19(2), 195–208. https://doi.org/10.1177/1524838016650189
Hu, L.-t., & Bentler, P. M. (1998). Fit indices in covariance structure modeling: Sensitivity to underparameterized model misspecification. Psychological Methods, 3(4), 424–453. https://doi.org/10.1037/1082-989X.3.4.424
Independent Review Commission (IRC) on Sexual Assault in the Military. (2021). Hard truths and the duty to change: Recommendations from the independent review commission on sexual assault in the military. https://media.defense.gov/2021/Jul/02/2002755437/-1/-1/0/IRC-FULL-REPORT-FINAL-1923-7-1-21.PDF/IRC-FULL-REPORT-FINAL-1923-7-1-21.PDF
Jamshidian, M., & Mata, M. (2007). 2 - Advances in analysis of mean and covariance structure when data are incomplete. In S.-Y. Lee (Ed.), Handbook of latent variable and related models (pp. 21–44). North-Holland. https://doi.org/10.1016/B978-044452044-9/50005-7
Jenaro, C., Flores, N., & Frías, C. P. (2018). Systematic review of empirical studies on cyberbullying in adults: What we know and what we should investigate. Aggression and Violent Behavior, 38, 113–122. https://doi.org/10.1016/j.avb.2017.12.003
Jöreskog, K. G., & Sörbom, D. (1993). LISREL 8: Structural equation modeling with the SIMPLIS command language. Scientific Software International.
Katz-Wise, S. L., & Hyde, J. S. (2012). Victimization experiences of lesbian, gay, and bisexual individuals: A meta-analysis. The Journal of Sex Research, 49(2–3), 142–167. https://doi.org/10.1080/00224499.2011.637247
Kim, C., & Ferraresso, R. (2022). Examining technology-facilitated intimate partner violence: A systematic review of journal articles. Trauma, Violence, & Abuse, 24(3), 1325–1343. https://doi.org/10.1177/15248380211061402
Koss, M. P. (1996). The measurement of rape victimization in crime surveys. Criminal Justice and Behavior, 23(1), 55–69. https://doi.org/10.1177/0093854896023001005
Kowalski, R. M., Dillon, E., Macbeth, J., Franchi, M., & Bush, M. (2020). Racial differences in cyberbullying from the perspective of victims and perpetrators. American Journal of Orthopsychiatry, 90(5), 644–652. https://doi.org/10.1037/ort0000492
Levi, M. (2017). Assessing the trends, scale and nature of economic cybercrimes: Overview and issues. Crime, Law and Social Change, 67(1), 3–20. https://doi.org/10.1007/s10611-016-9645-3
Lew, D., & Xian, H. (2019). Identifying distinct latent classes of adverse childhood experiences among US children and their relationship with childhood internalizing disorders. Child Psychiatry & Human Development, 50(4), 668–680. https://doi.org/10.1007/s10578-019-00871-y
Leyton Zamora, C., Boddy, J., O’Leary, P., & Liang, J. (2021). Culturally and linguistically diverse (CALD) women’s experiences of technology-facilitated violence: An intersectional approach. In A. Powell, A. Flynn, & L. Sugiura (Eds.), The Palgrave handbook of gendered violence and technology (pp. 115–134). Springer International Publishing. https://doi.org/10.1007/978-3-030-83734-1_7
Long, J. S. (1997). Regression models for categorical and limited dependent variables (Vol. 7). Sage.
Marcum, C. D., & Higgins, G. E. (2021). A systematic review of cyberstalking victimization and offending behaviors. American Journal of Criminal Justice, 46(6), 882–910. https://doi.org/10.1007/s12103-021-09653-6
Marcum, C. D., Higgins, G. E., Freiburger, T. L., & Ricketts, M. L. (2014). Exploration of the cyberbullying victim/offender overlap by sex. American Journal of Criminal Justice, 39(3), 538–548. https://doi.org/10.1007/s12103-013-9217-3
Marcum, C. D., Higgins, G. E., & Nicholson, J. (2017). I’m watching you: Cyberstalking behaviors of university students in romantic relationships. American Journal of Criminal Justice, 42(2), 373–388. https://doi.org/10.1007/s12103-016-9358-2
McIntyre, V. (2016). Do (x) you really want to hurt me: Adapting IIED as a solution to doxing by reshaping intent. Tulane Journal of Technology and Intellectual Property, 19, Article 111. https://journals.tulane.edu/TIP/article/view/2667
Mereish, E. H., Sheskier, M., Hawthorne, D. J., & Goldbach, J. T. (2019). Sexual orientation disparities in mental health and substance use among Black American young people in the USA: Effects of cyber and bias-based victimisation. Culture, Health & Sexuality, 21(9), 985–998. https://doi.org/10.1080/13691058.2018.1532113
Montgomery, R., Dennis, J. M., & Ganesh, N. (2016). Response rate calculation methodology for recruitment of a two-phase probability-based panel: The Case of AmeriSpeak. NORC at the University of Chicago. https://www.norc.org/content/dam/norc-org/pdfs/WhitePaper_ResponseRateCalculation_AmeriSpeak_2016.pdf
Moriarty, L. J., & Freiberger, K. (2008). Cyberstalking: Utilizing newspaper accounts to establish victimization patterns. Victims & Offenders, 3(2–3), 131–141. https://doi.org/10.1 080/15564880801938169
Mumford, E. A., Potter, S., Taylor, B. G., & Stapleton, J. (2020). Sexual harassment and sexual assault in early adulthood: National estimates for college and non-college students. Public Health Reports, 135(5), 555–559. https://doi.org/10.1177_0033354920946014
Mumford, E. A., Rothman, E. F., Maitra, P., & Sheridan-Johnson, J. (2022). U.S. young adults’ professional help-seeking in response to technology-facilitated abuse. Journal of Interpersonal Violence, 38(11–12), 7063–7088. https://doi.org/10.1177/08862605221140042
Myers, Z. R., Swearer, S. M., Martin, M. J., & Palacios, R. (2017). Cyberbullying and traditional bullying: The experiences of poly-victimization among diverse youth. International Journal of Technoethics (IJT), 8(2), 42–60. https://doi.org/10.4018/IJT.2017070104
National Center for Education Statistics. (2021). College enrollment rates. https://nces.ed.gov/programs/coe/indicator/cpb#:~:text=The%20overall%20college%20enrollment%20rate,was%2041%20percent%20in%202019
Nobles, M. R., Reyns, B. W., Fox, K. A., & Fisher, B. S. (2014). Protection against pursuit: A conceptual and empirical comparison of cyberstalking and stalking victimization among a national sample. Justice Quarterly, 31(6), 986–1014. https://doi.org/10.1080/07418825.2012.723030
Ohana, M. K. (2020). How has the security landscape changed in the last ten years with the rise of social media influencers [Master's thesis, San Diego State University]. San Diego State University ProQuest Dissertations Publishing. https://www.proquest.com/docview/2478076312?pq-origsite=gscholar&fromopenview=true
O’Hara, A. C., Ko, R. K. L., Mazerolle, L., & Rimer, J. R. (2020). Crime script analysis for adult image-based sexual abuse: A study of crime intervention points for retribution-style offenders. Crime Science, 9(1), Article 26. https://doi.org/10.1186/s40163-020-00130-9
Paat, Y.-F., & Markham, C. (2021). Digital crime, trauma, and abuse: Internet safety and cyber risks for adolescents and emerging adults in the 21st century. Social Work in Mental Health, 19(1), 18–40. https://doi.org/10.1080/15332985.2020.1845281
Patel, U., & Roesch, R. (2022). The prevalence of technology-facilitated sexual violence: A meta-analysis and systematic review. Trauma, Violence, & Abuse, 23(2), 428–443. https://doi.org/10.1177/1524838020958057
Pew Research. (2021, April). Internet/broadband fact sheet. https://www.pewresearch.org/internet/fact-sheet/internet-broadband/.
Powell, A., Scott, A. J., & Henry, N. (2020). Digital harassment and abuse: Experiences of sexuality and gender minority adults. European Journal of Criminology, 17(2), 199–223. https://doi.org/10.1177/1477370818788006
Reyns, B. W., Henson, B., & Fisher, B. S. (2012). Stalking in the twilight zone: Extent of cyberstalking victimization and offending among college students. Deviant Behavior, 33(1), 1–25. https://doi.org/10.1080/01639625.2010.538364
Schafer, J. L., & Graham, J. W. (2002). Missing data: Our view of the state of the art. Psychological Methods, 7(2), 147–177. https://doi.org/10.1037//1082-989x.7.2.147
Scheerder, A., van Deursen, A., & van Dijk, J. (2017). Determinants of Internet skills, uses and outcomes. A systematic review of the second- and third-level digital divide. Telematics and Informatics, 34(8), 1607–1624. https://doi.org/10.1016/j.tele.2017.07.007
Seewald, L., Walsh, T. B., Tolman, R. M., Lee, S. J., Reed, L. A., Ngo, Q., & Singh, V. (2022). Technology-facilitated abuse prevalence and associations among a nationally representative sample of young men. The Annals of Family Medicine, 20(1), 12–17. https://doi.org/10.1370/afm.2758
Sheridan-Johnson, J., Mumford, E. A., Maitra, P., & Rothman, E. R. (2023). Perceived Impact of COVID-19 on cyberabuse, sexual aggression, and intimate partner violence among U.S. young adults [Manuscript in preparation]. Public Health Research, NORC at the University of Chicago.
Taylor, S., & Xia, Y. (2018). Cyber partner abuse: A systematic review. Violence and Victims, 33(6), 983–1011. https://doi.org/10.1891/0886-6708.33.6.983
Tokunaga, R. S., & Aune, K. S. (2017). Cyber-defense: A taxonomy of tactics for managing cyberstalking. Journal of Interpersonal Violence, 32(10), 1451–1475. https://doi.org/10.1177/0886260515589564
Trujillo, O., Cantu, J. I., & Charak, R. (2020). Unique and cumulative effects of intimate partner cybervictimization types on alcohol use in lesbian, gay, and bisexual emerging adults. Cyberpsychology, Behavior, and Social Networking, 23(11), 743–751. https://doi.org/10.1089/cyber.2019.0773
Tynes, B. M., Rose, C. A., & Williams, D. R. (2010). The development and validation of the online victimization scale for adolescents. Cyberpsychology: Journal of Psychosocial Research on Cyberspace, 4(2), Article 2. https://cyberpsychology.eu/article/view/4237
Vakhitova, Z. I., Alston-Knox, C. L., Reynald, D. M., Townsley, M. K., & Webster, J. L. (2019). Lifestyles and routine activities: Do they enable different types of cyber abuse? Computers in Human Behavior, 101, 225–237. https://doi.org/10.1016/j.chb.2019.07.012
Vogels, E. A. (2021, August 19). Some digital divides persist between rural, urban and suburban America. Pew Research Center. https://www.pewresearch.org/fact-tank/2021/08/19/some-digital-divides-persist-between-rural-urban-and-suburban-america/
Walker, C. (2015). An analysis of cyberbullying among sexual minority university students. Journal of Higher Education Theory and Practice, 15(7), 44–50. http://digitalcommons.www.na-businesspress.com/JHETP/WalkerC_Web15_7_.pdf
Whitton, S. W., Dyar, C., Mustanski, B., & Newcomb, M. E. (2019). Intimate partner violence experiences of sexual and gender minority adolescents and young adults assigned female at birth. Psychology of Women Quarterly, 43(2), 232–249. https://doi.org/10.1177/0361684319838972
Winstok, Z. (2008). Conflict escalation to violence and escalation of violent conflicts. Children and Youth Services Review, 30(3), 297–310. http://www.sciencedirect.com/science/article/pii/S0190740907001880
Authors’ Contribution
Elizabeth Mumford: Funding acquisition, Project Administration, Conceptualization, Methodology, Writing- Original draft preparation, Visualization. Poulami Maitra: Data curation, Conceptualization, Formal analysis, Writing- Original draft preparation, Visualization. Jackie Sheridan: Project Administration, Data curation, Formal analysis, Writing- Original draft preparation. Emily Rothman: Funding acquisition, Conceptualization, Writing- Reviewing and Editing. Emily Olsen: Funding acquisition, Conceptualization, Writing- Reviewing and Editing. Elaina Roberts: Funding acquisition, Conceptualization, Writing- Reviewing and Editing.
Editorial Record
First submission received:
May 16, 2022
Revisions received:
September 11, 2022
February 25, 2023
April 18, 2023
Accepted for publication:
April 26, 2023
Editor in charge:
Lenka Dedkova
Introduction
Through a broad range of platforms, devices, and tools, it is increasingly possible to abuse people without direct contact. Technology-facilitated abuse (TFA) may arise from deceit, fraud, or imprudence, targeting assets (e.g., cash transfers, bank accounts) or individuals (e.g., harassment, reputational harm; Agustina, 2015). TFA, which in some instances may be characterized as violence (Dunn, 2021), may or may not occur in the context of existing dyadic relationships. Moreover, there is not always a distinct line between TFA and in-person abuse (DeKeseredy et al., 2021), as TFA may be used to threaten victims with physical violence, to track a victim’s location, or to control victim’s devices in ways that could result in physical harm. However, TFA is unique in that the perpetrator is able to intrude on a victim at any time of day, and from anywhere—without needing to be physically present. Therefore, TFA has the potential to generate a slew of deleterious health consequences, including anxiety, depression, helplessness, worthlessness, fatigue, self-harm, isolation, traumatization, vulnerability, embarrassment, insecurity, frustration, fear, shame, and functional harm (see Brown et al., 2021 for review), and material costs (Borwell et al., 2021a). These consequences tend to be more burdensome for people with fewer resources (Borwell et al., 2021b), elevating the importance of closer attention to TFA to address systemic inequities.
As Agustina (2015) frames the problem, cyber spaces both attract and generate crime, facilitate anonymity and invisibility, allow for asynchronous interactions, foster dissociative imagination and solipsistic introjection, and offer a liberating playing field for individuals who find real-world interactions to be repressive. Moreover, because of a generally shared desire for unrestricted navigation, inevitably users trade total security, i.e., prevention mechanisms, for technological freedoms (Agustina, 2015). This trade-off may be particularly true for young adults who are either digital natives (i.e., people who were born or grew up during the internet era) or who lack exposure to the privacy and benefits of our pre-digital culture.
Understanding the nature and extent of TFA is limited by the challenges of reporting and documenting diverse experiences (Ahlgrim & Terrance, 2018; Caneppele & Aebi, 2017; Levi, 2017). Technology-facilitated crime estimates focus on identity theft and fraud, to the exclusion of other interpersonal abuses reported in victim studies, such as stalking, doxing, and swatting (McIntyre, 2016). In the US, at least 7% of adults have experienced identity theft (Levi, 2017), and cybercrime overall may account for between one third and one half of all crime (Caneppele & Aebi, 2017). However, estimates of other forms of interpersonal TFA vary widely based on instrumentation and the chosen study population, often limited to college students and/or people reporting on their intimate partnerships (Brown et al., 2021; Fernet et al., 2019; Fissel et al., 2021; Taylor & Xia, 2018). For this reason, the current study was designed to field a comprehensive measure of TFA and estimate the prevalence of different forms and patterns of TFA among a representative sample of young adults in the United States.
Measurement and Methodological Issues
There are several methodological issues in the measurement of victimization, whether TFA or otherwise. One of these is the problem of victims being asked to self-classify their experience (Koss, 1996). Some survey respondents may not identify themselves as survivors of TFA and may underreport victimization because of survey question wording. To address this problem, previous TFA researchers have developed scale measures of online victimization that present specific scenarios (e.g., Tynes et al., 2010) to estimate overall exposure to TFA. However, protocols for asking respondents to determine if they have been a victim of TFA remain prevalent (e.g., Baum et al., 2009; Vakhitova et al., 2019). Even multi-item scales (see review for cyber dating abuse scale validation studies; Caridade et al., 2019), in the effort to balance accuracy and brevity, may underestimate the extent of different forms of TFA. Asking respondents to report on unwanted harassment (Reyns et al., 2012), for example, requires individual interpretation of what constitutes harassment. A second methodological problem is that some survey questions ask about only one type of technology. For example, if a survey question only asks respondents about abuse they may have experienced on the internet (Choi & Lee, 2017), the respondent may only consider websites or email—but not internet-connected devices such as cameras or eavesdropping devices, or financial fraud. Moreover, survey questions may be interpreted differently by individuals of different backgrounds, or with different exposure to various resources.
Third, convenience samples drawn from institutional (e.g., colleges) or online settings (e.g., Mechanical Turk) limit the generalizability of estimates (Jenaro et al., 2018). So, too, do research designs assessing experiences within intimate relationships, limiting the populations on which most scale development and measurement has focused (Afrouz, 2021; Brown et al., 2021; Fernet et al., 2019; Fissel et al., 2021; Kim & Ferraresso, 2022; Seewald et al., 2022; Taylor & Xia, 2018). A systematic review of cyber dating abuse, inclusive of studies of adolescents through college confirmed that there is a broad range of estimates (6% to 92%) of victimization as a result of different samples and measurement scales (Caridade et al., 2019). Importantly, studies of college students fail to document experiences of U.S. young adults who do not enroll in college (National Center for Education Statistics, 2021). Moreover, TFA may be perpetrated by individuals other than current or past intimate partners, and/or may reflect piling on by entire groups of people. Data from the National Crime Victimization Survey (Baum et al., 2009; Nobles et al., 2014) and the National Intimate Partner and Sexual Violence Survey (Black et al., 2011), while limited in scope and outdated given technology developments, have been the only nationally representative estimates of online and other forms of communications TFA in the general population (see also Seewald et al., 2022), supplemented by estimates of fraud and identity theft from law enforcement records (Levi, 2017).
Fourth, the expansive variety of technology-based platforms—email, instant messages, chat rooms, multiplayer online games, blogs, internet sites, social networks, and monitoring devices (Moriarty & Freiberger, 2008; Paat & Markham, 2021)—facilitate an ever-broader range of abuses. For example, individuals or groups may perpetrate unwanted contact, location tracking, impersonation, password breaches, bugging/spying, hyperintimacy, threat, extortion, sabotage, and invasion (Henry & Powell, 2016; Marcum et al., 2017; Moriarty & Freiberger, 2008; Nobles et al., 2014; O’Hara et al., 2020; Tokunaga & Aune, 2017). The growing possibilities and the range of digital devices, platforms and technologies connecting different aspects of daily life and human relationships speaks to the need for comprehensive TFA measurement.
Substantive and Methodological Gaps in the Research
Overall, the lack of generalizable samples, in addition to measurement choices circumscribing the target sample and the form and/or context of abusive experiences, has contributed to the limited grasp of the extent of the TFA problem across the U.S. While older Americans have not universally adopted modern technologies, nearly all young adults have a smart phone (96%) and use the internet (99%; Pew Research, 2021). Even if young adults do not use the internet, social media, or a smartphone, a perpetrator may abuse technology to victimize someone without their knowledge. To capture TFA in all its forms, detailed survey scale development with inputs from experts in dating abuse or intimate partner abuse have been a significant improvement (Brown et al., 2021; Caridade et al., 2019; Fissel et al., 2021); additional expertise in cyber security and the expertise of survivors are also critical to documenting the exposure and patterns of cyberabuse that young adult Americans have experienced. Moreover, the expanding formats and modalities of TFA challenge the feasibility of fielding comprehensive instrumentation with sufficient space for coincident measures of important constructs of interest for policy and prevention, and so efforts to identify the minimum scale measurement is warranted. Finally, research to date has labeled multiple constructs in the realm of cyberabuse—e.g., psychological, relational, direct/indirect, intrusive, coercive, sexually coercive, controlling, financially controlling, surveilling/monitoring, and humiliating abuses estimated through summarizing exposure to different forms of TFA (Brown et al., 2021; Caridade et al., 2019; Fissel et al., 2021)—but probability-based estimates of different person-centered profiles of TFA beyond adolescent samples are rare (Vakhitova et al., 2019).
Correlates of TFA Victimization
Past studies of correlates of TFA victimization also have been limited by these methodological gaps. The identification of correlates of TFA in representative samples will improve prevention efforts and outreach by helping services. A clear risk factor is an individual’s exposure to technologies and technology-driven platforms through which TFA may be perpetrated, and research does show that relative use of social media and time online predicts TFA (Marcum & Higgins, 2021). Relatedly, some individuals, by virtue of their professional responsibilities (e.g., as a journalist publishing online, or in creating new professional roles as Influencers on various social media platforms), may be more exposed to TFA not only because of relative use of technology, but also because of larger than usual audiences (Dunne, 2021; Hassan et al., 2018; Ohana, 2020). Other correlates demand closer examination. For example, because internet, social media, and technology use varies by personal characteristics such as age, gender, ethnicity and race (Anderson et al., 2017; Campos-Castillo, 2015; Kowalski et al., 2020; Marcum et al., 2014) or access-limiting factors such as socioeconomics or rural residence (Scheerder et al., 2017; Vogels, 2021), these individual factors may also be correlated with TFA experiences. As noted above, a body of research on TFA between intimate partners highlights the risks of exposure to TFA by a current or former partner (Kim & Ferraresso); moreover, individuals who are not in a committed relationship may face greater risks through broader dating behaviors and social activities (Sheridan-Johnson et al., 2023). Other personal characteristics can also increase individual risk for TFA because of systemic biases, such as the risks faced by individuals identified as sexual and gender minorities (Myers et al., 2017; Powell et al., 2020) or an ethnic or racial minoritized identity (Graham, 2020). These correlates are relevant to this investigation of TFA among young adults in the U.S.
The Present Study
The current study assessed TFA victimization in a sample representative of US young adults, applying a comprehensive scale developed with expert and survivor input (see Measures below). Following scale development, we had three research objectives. First, we sought to identify key TFA measures to support ongoing research. While we initially expected that each of the items fielded were distinct and uniquely informative measures of TFA, we also recognized the potential and importance of developing a compact measure of TFA to facilitate future research, and thus the need to test psychometrics of the CARI scale. Second, we sought to determine if there were patterns of TFA identifiable in a young adult population. We expected, that in addition to profiles of pervasive TFA and no TFA, the data would show that forms of TFA that appeared to be similar conceptually (e.g., surveillance behavior, fraud, or TFA that causes reputational harm) would appear with higher probability within distinct, data-driven latent classes of TFA, which could be constructive for prevention efforts and services. Third, we sought to determine if personal sociodemographic and internet use characteristics were associated with TFA victimization profiles. However, based on the literature and theoretical considerations, we formed limited hypotheses about predictors of different forms of TFA: we expected that there would be gender balance in the overall victimization rates, given the relative physical safety afforded by distal cyberspaces; and, given patterns in other forms of abuse (Katz-Wise & Hyde, 2012), we expected to find more prevalent victimization among young adults who identified as LGBQA+ compared to those who identified as heterosexual.
Methods
Sample
Data for the Cyber-Abuse Research Initiative (CARI), funded by the Office of Violence Against Women (OVW), were collected over the period of November 2020 to May 2021 from a nationally representative sample of U.S. adults ages 18–35 using NORC’s AmeriSpeak® Panel. The AmeriSpeak Panel is representative of approximately 97% of U.S. households (Montgomery et al., 2016). The sample was selected using 48 sampling strata based on age, race, Hispanic ethnicity, education, and gender. Black and Hispanic panelists were oversampled to ensure adequate representation. The survey was offered in English and Spanish and available for either an online or phone response. To encourage study participation, NORC sent email and SMS reminders to sampled panelists throughout the fielding period. Panelists were offered the equivalent of $10 for participation in the study. Out of the 8,620 invited panelists, a total of 2,752 respondents (32%) completed the survey, 2,739 by internet and 13 by phone. Given the importance of representing the experiences of all US young adults, we provide descriptive results for the 60 respondents who self-identified as transgender, non-binary gender, or other gender identity (some of whom marked more than one gender identity response option) (Table 2); however, this respondent subsample was too small to compare to cisgender respondents or include in the multivariable modelling. Inclusion in the multivariable sub-sample used for the latent class analysis (n=2,676, ~97% of the total sample), was based on the following criteria: (1) cisgender identity and (2) the respondent answered at least one of the 17 reduced-scale TFA victimization items (0.62% of respondents excluded if missing values on all 17 outcome variables). Table 1 presents the analytic sample characteristics. Cases with missing data on covariates (0.7% of the entire sample) were excluded from the multivariable analysis, assuming missing completely at random (MCAR; Jamshidian & Mata, 2007).
Measures
TFA Victimization
TFA measures (27 items; see Table 2) were developed by the authors based on prior research and professional expertise. A preamble preceded the bank of items set the context as “if anyone ever frightened, angered, or annoyed you by doing any of the following without your consent, without your upfront knowledge (e.g., consistent with family rules or company policy), or when you did not want them to.” Respondents were asked to answer Yes or No for each individual item. Measures were reviewed by practitioners external to the expert group.1 The scale was then piloted with nine survivors of TFA, ranging in age from late 20s to mid-50s, (recruited by NNEDV via their membership listserv), following which the research team conducted cognitive interviews with each participant to gain insights on gaps in measurement and appropriate language for the final scale. Participants provided detailed responses regarding their interpretation of item wording as well as feedback on the CARI scale coverage of their particular experiences. Further, we had extensive feedback on the instrument at all stages from leaders of NNEDV’s Safety Net program.
The final list of 27 items represents six conceptual categories of abuse based on the research team’s theoretical interpretation; this conceptual categorization neither drove the researchers’ creation of the 27 items nor constrained the subsequent empirical modeling approach. Surveillance (5 items; Table 2, items B–D, V, W) involved experiencing behaviors such as someone checking your phone call history, web browser history, and phone or email communications. Cyber-interference/communications (9 items; F, G, I–M, P, Q) included someone pretending to be another person in order to deceive you, sending you threatening or frightening messages, and contacting you repeatedly beyond what you felt comfortable with. Control/limiting access (2 items; A, E) included someone changing your passwords to online accounts or taking away your electronic device(s). Reputational harm (3 items; H, N, O) included sharing a doctored image of you online, or exposing your personal information (name, address, contact information) to other people. Monitoring/tracking (4 items; R–U) included someone tracking your location, monitoring or spying on you using spyware/stalkerware, or controlling internet-connected technology in your home without your permission. Fraud (4 items; X–AA) included someone attempting to deceive you into sending money, or someone accessing or manipulating your technology or accounts resulting in financial harm. Importantly, the analytic plan (below) was designed to test for empirically driven classes of TFA using individual items, rather than assuming that these conceptual categories would cleanly define victims’ experiences.
Table 1. Weighted Sample Description.
|
|
Na |
Frequency/Mean (SD) |
|
Age |
2,676 |
27.45 (4.92) |
|
Gendera |
|
|
|
Female |
1,361 |
50.8% |
|
Male |
1,315 |
49.2% |
|
Race/Ethnicity |
|
|
|
Non-Hispanic White |
1,469 |
55.0% |
|
Non-Hispanic Black |
373 |
14.9% |
|
Hispanic |
525 |
19.6% |
|
Non-Hispanic Other |
305 |
11.4% |
|
Sexual Orientation |
|
|
|
Heterosexual |
2,220 |
83.3% |
|
LGBQA+ |
444 |
16.7% |
|
Education Level |
|
|
|
High School Equivalent or Less |
788 |
29.5% |
|
Some College |
871 |
32.6% |
|
Bachelor’s Degree or Above |
1,011 |
37.9% |
|
Household Income (18-point scale of income categories) |
2,676 |
9.42 (4.28) |
|
Relationship Status |
|
|
|
Not Currently in a Committed Relationship |
1,112 |
41.5% |
|
Currently in a Committed Relationship |
1,564 |
58.5% |
|
Reside in a Metropolitan Area |
2,676 |
87.7% |
|
Frequency of use across sites/apps |
2,676 |
2.17 (1.00) |
|
Number of sites/apps used |
2,676 |
5.45 (2.05) |
|
Social Media Influencer (self-reported) |
2,676 |
11.6% |
|
Note. a Weighted N (rounded to nearest integer) is limited to cisgender respondents given that the CPS data do not include non-binary or transgender measurement to adjust the CARI weights. The sample of transgender, non-binary, or other gender identity respondents is n = 60 (see Table 2). |
||
Table 2. Weighted Distribution of TFA Victimization.
|
Victimization Itemsa |
Totala (N = 2,676) |
Male (n = 1,315) |
Female (n = 1,361) |
Trans, Non-binary, or Another gender identityb (n = 60) |
|
A. Made me give them access to or took away my phone, computer, or other electronic device, including making me give them my passwords for those devices |
17.70% |
15.5% |
19.8% |
35.4% |
|
B. Used my computer, phone or other electronic device to get information about me or other people |
21.61% |
18.9%* |
24.2%* |
36.1% |
|
C. Checked my sent/received email or message, or search histories, without my permission |
29.40% |
26.0%* |
32.7%* |
33.9% |
|
D. Checked my phone call histories without my permission |
25.94% |
22.4%** |
29.4%** |
29.4% |
|
E. Changed the password to my online accounts or social media |
15.2% |
13.6% |
16.9% |
22.5% |
|
F. Pretended (or had a third party pretend) to be me online/via phone to deceive others, embarrass me, or gather information about me, including making fake profiles of me |
15.2% |
14.2% |
16.2% |
11.6% |
|
G. Pretended to be another person online in order to deceive me, or others, or gather information about me |
25.5% |
26.2% |
24.9% |
32.4% |
|
H. Distributed, or posted online, an intimate image of me without my consent |
10.4% |
9.2% |
11.7% |
17.8% |
|
I. Sent me threatening, frightening, harassing or aggressive messages via email, text, social media, or another online platform |
28.2% |
25.0%* |
31.4%* |
47.3% |
|
J. Sent me unwanted pornographic or obscene images or messages via email, text, social media, or another online platform |
28.8% |
20.9%*** |
36.4%*** |
37.3% |
|
K. Created new accounts to continue to harass me online after I blocked them from contacting me |
18.3% |
15.3%** |
21.3%** |
30.5% |
|
L. Contacted me repeatedly via email, text, social media, or another online platform beyond what I felt comfortable with |
31.9% |
24.7%*** |
38.8%*** |
37.3% |
|
M. Encouraged other people to “troll,” attack, or harass me online |
15.3% |
14.9% |
15.7% |
27.6% |
|
N. Damaged, or tried to damage, my reputation by posting false, negative, or private information about me |
18.9% |
15.8%** |
21.9%** |
33.9% |
|
O. Shared a doctored or altered image, video, or audio recording of me (i.e., photo-shopped images or deepfakes) |
6.9% |
7.4% |
6.3% |
4.1% |
|
P. Exposed my name, address, contact information, social media profiles, or location to other people (sometimes called doxing) |
9.5% |
9.3% |
9.7% |
15.0% |
|
Q. Threatened to make or made a prank 911 call in an attempt to send the police to my residence (sometimes called swatting) |
6.0% |
5.4% |
6.4% |
18.2% |
|
R. Tracked my location with a phone, app, GPS device, or other technology |
14.8% |
13.6% |
16.1% |
16.2% |
|
S. Monitored or spied on me using spyware/stalkerware |
6.8% |
7.5% |
6.1% |
7.2% |
|
T. Monitored or spied on me using cameras, drones or a “bugging” or eavesdropping device |
5.9% |
5.7% |
6.1% |
11.1% |
|
U. Controlled internet-connected technology in my home without my permission, for example my internet-connected TV, refrigerator, lighting system, heating and cooling system, security system, or door locks |
6.6% |
6.9% |
6.3% |
6.1% |
|
V. Without my permission or knowledge, accessed any of my online accounts or social media |
18.9% |
15.8%** |
21.9%** |
31.2% |
|
W. Monitored online information posted by me or about me in a way that made me feel unsafe |
11.9% |
9.9%* |
13.9%* |
25.9% |
|
X. Used or attempted to use my personal information for some fraudulent purpose, including identity theft. |
16.3% |
18.0% |
14.6% |
16.2% |
|
Y. Attempted to deceive me into sending money or providing personal information about myself (sometimes called scamming, can include romance scams). |
26.1% |
27.2% |
25.0% |
24.8% |
|
Z. Accessed or manipulated my technology or accounts resulting in financial harm. |
8.4% |
9.1% |
7.7% |
12.1% |
|
AA. Gained access to my bank accounts to monitor my spending (including Venmo/PayPal, etc.) in order to defraud, take my money, or impersonate me. |
9.9% |
10.7% |
9.1% |
16.9% |
|
Note. Bolded items (17 out of 27) were retained for the subsequent latent class models (Table 3). aThese 27 items were conceptually categorized by the research team, prior to the empirical latent class analyses, as follows: Surveillance (B–D, V, W); Cyber-Interference/Communications (F, G, I–M, P,Q); Reputational Harm (H, N, O); Monitoring/Tracking (R–U); Control/Limiting Access (A, E); Fraud (X–AA). bBecause the CPS data do not include non-binary or transgender measurement, estimates are weighted for the U.S. cisgender population ages 18–35; estimates of TFA victimization experiences reported by transgender, non-binary, or other gender identity respondents are not weighted by gender identity. ***p < .001, **p < .01, *p < .05 for Chi-Square tests of differences between males and females. See Appendix C for further statistics.
|
||||
Covariates
Measures of Online Behavior. To assess the level of attention and engagement the respondent has online, respondents were asked, Would you describe yourself as having any kind of public following? In other words, are you to any extent an influencer, prominent figure, or leader in any online or social groups? Responses were coded as an indicator (yes/no) of whether the respondent was an Influencer. Additionally, we measured digital footprints reflecting respondents’ frequency and range of use of ten different groups of sites/apps (e.g., social media; dating sites; gaming; video or streaming; messaging sites/apps). Frequency of use was captured by taking the average of frequency across each platform, on a scale of 0–6, ranging from Don’t use this type of site/app (0) to More than once a day (6). The number of platforms used ranged from 0–10 of the individual platform types, counted as “1” if the respondent reported any use of platform.
Sociodemographic Characteristics. Models included gender identity (male or female), age (continuous), race/ethnicity (White Non-Hispanic, Black Non-Hispanic, Hispanic, or Non-Hispanic Other), LGBQA+ (identifying as lesbian or gay; bisexual, pansexual, or queer; questioning; asexual; or demisexual coded as 1 vs. heterosexual coded as 0), education level (high school equivalent or less, some college, or bachelors degree or higher), committed relationship (coded 1 vs. single, non-committed dating, widowed, separated, divorced coded as 0), household income (18 category variable treated as continuous), and metropolitan area residence (coded as 1).
Analysis Plan
We conducted item response theory (IRT) analysis to examine whether the 27-item scale could be reduced without losing substantive information (Figure 1).2 We examined Cronbach’s alpha applied to all 27 items together and biserial correlations to assess the reliability of the items and relative importance of each item respectively. First, a two-parameter logistic (2-PL) model was fit to the data. Model fit statistics—comparative fit index (CFI), the Tucker–Lewis index (TLI), and the root mean square error of approximation (RMSEA)—were examined along with item characteristics (ICC) and item information curves (IIC). An RMSEA value of less than .06 (Browne & Cudeck, 1993; Hu & Bentler, 1998; Jöreskog & Sörbom, 1993) and a CFI and TLI greater than .95 indicate good model–data fit (Bentler & Bonett, 1980; Hu & Bentler, 1998). Second, given the large sample and the probability that randomly rejecting a test at 5% is not negligible, we examined the chi-square test results for item fit at a significance level of 0.0001. Third, out of the items for which we could reject the hypothesis that the item fit well for the test, we looked at the IICs and Wright map and selected four items from each of the lower, middle and higher sections of the curve based on higher values of discrimination to capture items from all levels of difficulty (Beaujean, 2014; Cordier et al., 2018). Fourth, we refit the 2-PL model to the reduced item set. The number of TFA victimization items selected from the lower, middle, and higher sections of the IICs was dependent on the model fit statistics of the final 2-PL model. Overall, we conducted IRT analyses separately for males and females as well as for the full sample of cisgender respondents. The final selection of 17 indicators of TFA victimization reflects both male and female experiences. Of note, we repeated the IRT analyses for the entire sample (inclusive of individuals self-identifying as transgender, non-binary, or other gender identity) as well and found no difference in the final reduced set of 17 items (see Appendix B).
We then carried out latent class analysis (LCA) on the final set of 17 items. In LCA, an unknown number of mutually exclusive latent classes within the analytic sample are estimated based on the patterns of responses to the cyberabuse victimization indicators. We first fit multiple LCA models with different numbers of classes and then examined the fit statistics, including the Lo-Mendell-Rubin adjusted likelihood ratio test (LRT) and Bayesian LRT for the unweighted LCA, AIC, BIC, and entropy values. Based on these statistics as well as substantive inspection and judgement, we selected the final number of classes for both the weighted and unweighted fits. Finally, we estimated a multinomial logistic regression model of the latent classes on exogenous sociodemographic variables that were collected in the survey (Long, 1997). Missing data on the outcome variables (latent class indicators of TFA victimization) were accounted for by using the full information maximum likelihood (FIML) estimation method (Arbuckle, 1996; Schafer & Graham, 2002). We did not account for the missingness in the covariates as the percentage was only 0.63%. To investigate potential gender differences suggested by chi-square test results (Table 2; see Appendix C for details), we first estimated gender-stratified models. We noticed the number and composition of latent classes for female respondents matched results from the analyses of all cisgender respondents, whereas there was one fewer class for the male sample (two of the female classes appeared as one male class). Since the combined data was more informative (captured more variability in the data) and we did not observe differential effects of covariates by gender, we report the total cisgender results here. Final results are weighted—calculated by adjusting the probability of selection by iterative proportional fitting and accounting for the survey non-response (Bacharach, 1965)—to make conclusions nationally representative. The IRT analysis and final plots were created in R (v4.0.2) and the weighted latent class regression was conducted in Mplus (v8). Weights were created by using the iterative proportional fitting method such that the weighted marginal distributions of age, gender (male or female), race/ethnicity, Census division, education, housing tenure, household phone status, and cross-tabulations of age, gender, race/ethnicity and that of race/ethnicity, gender and census region in the sample match with that in the U.S. Current Population Survey (CPS). In other words, the non-binary or transgender young adults are weighted (along with the cisgendered sample) to the total population of U.S. residents ages 18–35, not to the population of trans or non-binary U.S. residents ages 18–35, specifically because the CPS or ACS (American Community Survey) does not capture this information for the entire US population.
Figure 1. Item Response Theory Item Information Curves, Full CARI Scale and Reduced CARI Scale.

Note. Figure 1 curves color coded by item [letter] when viewed online.
Results
Descriptive Results
Table 2 presents the weighted distribution of all 27 TFA victimization items. The TFA victimization reported by young adults who identified as trans, non-binary, or other gender identity was substantially higher than the TFA reported by other respondents for 17 out of the full scale of 27 measures. Where the TFA experiences of this group of young adults did not exceed rates reported by male and female respondents, the prevalence appeared to be generally similar to the higher rates reported by cisgender respondents, although significance testing was not possible because of the small sample sizes.
The prevalence of any TFA victimization in the sample for multivariable analyses was 69.7% (66.3% of males and 72.9% of females; χ2 = 6.0, p = .014, φ = .05). Overall, ten out of the 27 indicators were reported by significantly more female than male respondents. The most highly endorsed item (31.9%; Contacted me repeatedly via email, text, social media, or another online platform beyond what I felt comfortable with) was a form of cyber-interference/communication TFA. However, the prevalence of any form of cyber-interference/communication TFA was 54.3% (48.0% of males and 59.6% of females; χ2 = 16.1, p < .001, φ = .08). Over four in ten respondents (43.4%) reported any form of surveillance TFA (38.8% of males and 47.7% of females; χ2 = 9.9, p = .002, φ = .06). About a quarter of the sample (24.4%) reported any form of reputational harm (20.7% of males and 27.5% of females; χ2 = 7.5, p = .006, φ = .05). Overall, 18.6% of the sample had experienced some form of monitoring/tracking TFA, and the prevalence of any form of fraud TFA was 35.7% (no significant difference by gender). Finally, more than one-quarter (26.4%) of the sample had experienced some form of control/limiting access TFA (23.1% of males and 28.9% of females; χ2 = 5.5, p = .019, φ = .05).
CARI Scale Reduction
Next, we examined the 27 items scale to determine if the number of items could be reduced while retaining sufficient substantive information about the range victimization experiences. Applying IRT analyses, the TLI and CFI were 0.955 and 0.96 respectively whereas the RMSEA was .068, 90% CI [0.065, 0.071] and SRMSR was .06.3 For all 27 items, Cronbach’s alpha was .91 with TLI was .96, CFI was .964 and RMSEA was .6. We found the item characteristic and item information curves to be similar when we reduced the number of items to 17 (Cronbach’s alpha was .88 for the final model fit of the 17-item CARI scale; alpha = .89 for women and .88 for men). Based on these results, we inferred that the selected 17 items effectively represented the TFA experiences of this young adult sample. We have summarized the selected items and the corresponding item information curves for the 17 items (Figure 1). The plot shows that we are capturing both high and low difficulty items along with those which has high and low discrimination so that we capture most of the span of the items.
Profiles of TFA Victimization Experiences
For the selected 17 items of the reduced CARI scale, we fit a weighted latent class regression with demographic variables. We found seven classes distinguished by the probability of different forms of TFA experience (see Appendix D for details), with class labels reflecting relative probability as higher risk (HR) or moderate risk (MR) compared to low risk TFA classification (Figure 2). About 48% of respondents reported low prevalence of any TFA, and thus were classified as a “Low TFA” (class 6); this is the reference class for the subsequent multivariable model. About 23% of the sample reported elevated propensity of TFA experiences reflecting “MR-Communication TFA” (18%; class 4) and, for those whose risks of TFA victimization reflected all forms of TFA, “MR-Pervasive TFA” (5%; class 7). The remaining 28% of the sample were distributed across four classes that exhibited a high probability of some or all forms of TFA. About 10% of respondents experienced high risk of TFA through “HR-Surveillance” (class 1). Just over 5% of respondents were classified as “HR-Communication & Reputational Harm” (class 2), while nearly 10% were classified as “HR-Communication & Surveillance; MR-Reputational Harm” TFA (class 3). Finally, we had a relatively small (4%) but distinct group who had a high risk of experiencing all forms of TFA, and thus were classified as “HR-Pervasive TFA” (class 5).
Figure 2. Conditional Probabilities of Cyberabuse Victimization Experiences, by Latent Class Membership.

Note. Class numbers are assigned by analytic software and thus have no rank meaning.
Figure 3. Reduced CARI Scale: Mapping Different Forms of TFA From Conceptual Categories to Latent Class Results.

Note. Retained 17 CARI items based on IRT analyses. Items appearing in the conceptual category “control/limiting access” were not retained in IRT analyses for subsequent LCA. Class numbers assigned by analytic software and thus have no rank meaning. Solid lines represent higher probability of the select form of TFA within a given profile, whereas dotted lines represent moderate probabilities.
Given the complexity of the latent class results, Figure 3 presents a visual mapping of the different forms of TFA according to the initial conceptual categorization of each with the data-driven latent class results. As the figure illustrates, items measuring surveillance TFA behaviors may identify a distinct profile of TFA (class 1) but may also be experienced within broader spectrum TFA profiles (classes 3, 5, and 7). A similar result is apparent for cyber-interference/communications TFA, which may constitute the predominant forms of abuse for some young adults (class 4). However, communications, reputational harm, and fraud TFA are commonly reported within similar profiles, varying from moderate to high probability (classes 2, 3, 5 and 7). Monitoring or tracking behaviors, by contrast, appear only in the moderate (class 7) or high risk (class 5) TFA profiles, indicating that these forms do not usually appear in isolation of other forms of TFA for a young adult sample.4 Results indicated that the items conceptually categorized as control/limiting access were not essential to capturing experiences of moderate or high risk TFA; i.e., if young adults were experiencing these items, they were also likely experiencing other forms of TFA retained in the 17-item CARI scale.
Exogenous Factors Associated with TFA Profiles
Table 3 summarizes the results from the latent class regression, presenting relative risk ratios (RRR) for respondents of different characteristics to appear in a given latent class compared to Low TFA as the reference class (see Appendix E for further statistical results). The RRR of being in HR-Surveillance (class 1) was higher (RRR = 1.9, p = .028) for those who had only some college education vs. those who completed their bachelors compared to Low TFA (class 6). The risk was lower (RRR = 0.54, p = .010) for respondents with higher frequency of site/app use but was higher (RRR = 1.47, p = .002) for those with higher number of sites/apps they used. For influencers (RRR = 4.66, p = .009) and respondents using a greater number of sites/apps (RRR = 1.85, p < .001), the risk of experiencing HR-Communication & Reputational Harm (class 2) was higher compared to class 6. On the other hand, males (RRR = 0.47, p = .028) and respondents with higher household income (RRR = 0.93, p = .053) had lower risk of being in class 2 as compared to class 6. For individuals in the LGBQA+ community (RRR = 2.18, p = .003), those with only some college education (RRR = 2.21, p = .002), influencers (RRR = 3.46, p = .002), and respondents using greater number of sites/apps (RRR = 1.29, p = .014), the risk of HR-Communications & Surveillance; MR-Reputational Harm (class 3) was significantly higher compared to experiencing Low TFA. Similarly, for Males (RRR = 0.29, p < .001) and respondents with higher household income (RRR = 0.93, p = .011), the risk of being in class 3 was significantly lower compared to experiencing Low TFA. Respondents using a greater number of sites/apps (RRR = 1.33, p < .001), influencers (RRR = 2.45, p = .014), and LGBQA+ individuals (RRR = 1.85, p = .020) had higher relative risk of experiencing MR-Communications (class 4) compared to Low TFA, whereas Males (RRR = 0.40, p < .001) had lower risk of belonging to class 4. Respondents reporting that their education stopped with some college (RRR = 6.79, p < .001) or, at most, high school (RRR = 7.06, p = .001) and influencers (RRR = 10.77, p < .001) had a higher risk whereas Males (RRR = 0.31, p = .004) had a lower risk of belonging to HR-Pervasive TFA (class 5) as compared to Low TFA. Influencers (RRR = 6.46, p < .001), respondents using a greater number of websites (RRR = 2.15, p < .001), and older individuals (RRR = 1.11, p = .018) had a higher risk and respondents with greater household income (RRR = 0.83, p = .004) had a lower relative risk of belonging to MR-Pervasive TFA (class 7) as compared to Low TFA.
Discussion
The current study is a detailed examination of TFA victimization among U.S. young adults ages 18 to 35, an age group that has largely grown up with access to the expanding technological connections of the modern era. Nearly seven out of ten young adults reported any TFA victimization experience in their lifetime. Of those with elevated risks for TFA, more than half faced high risk of communications, surveillance, reputational harm, or pervasive TFA. While some of these reports may have reflected isolated historical experiences, over half the sample exhibited moderate to high risk for broader TFA exposures. Similarly, a prior study of adults ages 18 and older, relying on a non-probability sample and focused on distinguishing direct and indirect victimization, found overall that half of respondents had experienced TFA (Vakhitova et al., 2019). That more than half of US young adults experience moderate to pervasive TFA victimization—with known and costly consequences (Borwell et al., 2021a, 2021b; Brown et al., 2021)—supports the need for education, victim services, technological protections, and action through legal and other avenues of support.
Table 3. Association Between Respondent Characteristics and TFA Victimization Profiles.
|
|
Adjusted Odds Ratios (SE) |
|||||
|
|
Class 1 (9.7%): HR-Surveillance |
Class 2 (5.5%): HR-Communication & Reputational Harm |
Class 3 (9.6%): |
Class 4 (18.2%): |
Class 5 (3.7%): |
Class 7 (4.9%): MR-Pervasive TFA |
|
Age |
1.05 (0.03) |
1.03 (0.04) |
1.02 (0.03) |
1.03 (0.02) |
1.07 (0.04) |
1.11 (0.05)* |
|
Gender (Male) |
0.94 (0.24) |
0.47 (0.16)* |
0.29 (0.08)*** |
0.40 (0.09)*** |
0.31 (0.13)** |
0.75 (0.31) |
|
Black, Non-Hispanic |
1.15 (0.42) |
0.42 (0.37) |
0.83 (0.29) |
1.24 (0.33) |
1.84 (1.15) |
0.64 (0.33) |
|
Hispanic |
1.71 (0.53) |
1.13 (0.47) |
0.92 (0.31) |
0.73 (0.20) |
1.16 (0.66) |
1.09 (0.51) |
|
Other Race/ Ethnicity |
1.54 (0.56) |
0.82 (0.46) |
0.72 (0.27) |
1.30 (0.37) |
2.66 (1.54) |
1.80 (1.24) |
|
LGBQA+ |
1.48 (0.44) |
1.60 (0.61) |
2.18 (0.57)** |
1.85 (0.49)* |
1.67 (0.73) |
0.88 (0.49) |
|
Less than high school education |
1.39 (0.49) |
0.86 (0.36) |
1.43 (0.43) |
0.79 (0.21) |
7.06 (4.19)** |
2.68 (1.74) |
|
Some college education |
1.90 (0.55)* |
1.29 (0.50) |
2.21 (0.58)** |
1.28 (0.29) |
6.79 (3.54)*** |
3.20 (1.97) |
|
Household income |
0.98 (0.03) |
0.93 (0.03) |
0.93 (0.03)* |
0.96 (0.02) |
1.01 (0.05) |
0.83 (0.05)** |
|
In a committed relationship |
1.05 (0.28) |
0.95 (0.36) |
1.65 (0.45) |
1.12 (0.24) |
0.92 (0.44) |
1.48 (0.58) |
|
Metro resident |
0.98 (0.38) |
1.15 (0.57) |
0.65 (0.17) |
1.35 (0.38) |
1.05 (0.54) |
1.12 (0.61) |
|
Frequency of use across sites/apps |
0.54 (0.13)* |
0.69 (0.20) |
1.10 (0.22) |
0.98 (0.17) |
1.71 (0.62) |
0.77 (0.23) |
|
Number of sites/apps used |
1.47 (0.18)** |
1.85 (0.30)*** |
1.29 (0.14)* |
1.33 (0.11)*** |
1.42 (0.28) |
2.15 (0.41)*** |
|
Influencer status |
0.89 (0.45) |
4.66 (2.76)** |
3.46 (1.40)** |
2.45 (0.89)* |
10.77 (4.52)*** |
6.46 (3.39)*** |
|
Note. Class numbers assigned by M-Plus and thus have no rank meaning. HR (higher risk). MR (moderate risk). The reference class is class 6, Low TFA (48.3%). Covariate reference groups: Bachelor’s or higher, Female, NH-White, not in a committed relationship, heterosexual or straight, living in a non-metro region, does not have a public following/is not an influencer. ***p < .001, **p < .01 *p < .05. |
||||||
These results indicate that TFA risks are an important consideration in the general population. There was no evidence in this sample of differential exposure to the heterogenous patterns of TFA victimization based on age (relevant to the preponderance of studies conducted within college samples), race or Hispanic ethnicity nor, critically, being in a committed intimate relationship. Considering racial or ethnic identity, these results did not identify differences by racial and ethnic subgoup. There is a possibility that our instrument failed to assess certain forms of TFA such as racially specific threats or harassment that could vary by racial and ethnic subgroup. For example, our survey questions may not have prompted respondents to think about racially or ethnically specific or motivated TFA when they were answering our questions (Felmlee et al., 2018; Francisco & Felmlee, 2022). Further, prior research suggests that racial and ethnic minoritized immigrant women are at increased risk for TFA (Leyton Zamora et al., 2021). With these points in mind, the estimated prevalence of TFA in the current study is likely an underestimate, and further research examining group identity-based TFA is warranted to understand diversity of TFA experiences by racial, ethnic, and intersectional identities.
Regarding TFA within committed relationships, while the binary association of any TFA exposure was higher for those not currently in a committed relationship in the current CARI sample, being single did not distinguish any moderate or higher TFA risk profile in adjusted models. Intimate partners may interact in person more often than online and may experience a higher ratio of positive and protective interactions than non-intimate partners. Overall, the nature of intimate relationships has unique qualities (Winstok, 2008), such that TFA experiences in intimate relationships may be different and require their own measurement scale (e.g., Brown et al., 2021).
Some characteristics within the general population—i.e., sexual identity, educational attainment, and gender—do, however, signal vulnerabilities. Our hypothesis of greater victimization of LGBQA+ respondents was partially supported by this subgroup’s greater risk of classification in TFA profiles indicating broader TFA exposure. While there is a growing body of research regarding cyberbullying or harassment of LGBTQ youth (Abreu & Kenny, 2018; Mereish et al., 2019), most research among sexual minority young adult populations has focused on TFA in intimate relationships (e.g., Trujillo et al., 2020; Whitton et al., 2019). The current study underscores that individuals who identify as sexual minorities may be at particular risk of abusive communications, surveillance, and public posts that threaten their reputation, a particular concern given potential threats to their sexual privacy (Walker, 2015). Further, young adults with less educational attainment and lower household income were more likely to face higher risk of pervasive TFA exposures. This evidence also underscores the need to think outside of the “college population” box for prevention designs, just as recent research regarding sexual harassment and sexual assault victimization suggested (Mumford et al., 2020). Finally, contradicting our expectation of greater gender symmetry (viz other forms of abuse), we found in the CARI sample that female respondents were significantly more likely than males to appear in four out of the six TFA profiles, compared to the class of low TFA risk. While comparable general population studies are lacking for TFA victimization, the literature provides mixed findings regarding gender differences in cyber intimate partner violence (Taylor & Xia, 2018). The current study underscores the probability that women bear a greater burden of TFA victimization, as with other forms of abuse, than men, a problem that may extend to restrictions on access to technology (Leyton Zamora et al., 2021).
Finally, our results are consistent with other research (Dunne, 2021; Hassan et al., 2018; Ohana, 2020) highlighting increased risks of TFA primarily for young adults using a broader range of platforms or embodying an active public persona such as that established by influencers. These results point to the need to understand in more detail the nature of technology use and interaction (Scheerder et al., 2017) rather than the commonly used measure of the amount of time spent online (Farrington et al., 2023).
Limitations
Findings from this study are limited by several features of the research design. First, men were underrepresented in the cognitive testing phase, but the 17-item CARI scale reliability is strong for all cisgender respondents. Second, the study response rate of 32% may introduce bias if the respondent sample is not capturing a representative sample of the population; our use of the nationally representative sampling frame weights consistent with the US CPS distributions mitigate this concern. Third, the data were self-reported over an online survey; individuals who have experienced TFA indicators may be reluctant to participate in an online survey on this topic and/or to report certain forms of abuse if they feared their abuser would see their responses. In the development phase, we explored TFA survivors’ feelings about the web modality and learned that the opportunity to report their experiences outweighed fears of discovery for most people. To address participant needs, in addition to offering a phone survey option, a button for helpful online and phone-based resources was available on each page of the survey, as was a Quick Exit button to close the survey window instantly. However, to the extent that there is bias in the prevalence results, we expect that victimization rates are conservative. Fourth, consistent with most research in this field to date (Caridade et al., 2019), the data in this study were cross-sectional, limiting investigation of risk and protective factors. Fifth, to reduce participant burden, the measures of TFA victimization were binary and did not capture frequency or severity of any given abuse. Sixth, the current analyses include only respondents identifying as cisgender. The proportion of respondents identifying as transgender, non-binary, or other gender identity was too small to include in the latent class analyses. Seventh, AmeriSpeak is a household panel and thus excludes incarcerated individuals, homeless individuals and individuals in the military; while the former populations may have limited access to technology, given the high rates of sexual harassment and violence reported by members of the military (Independent Review Commission (IRC) on Sexual Assault in the Military, 2021), examining their experience of TFA is warranted. Finally, we would note that the study design required categorical reports, and we recognize that the nature and impact of these experiences likely varied by individual respondent.
Implications
The current study highlights the complexity of TFA experiences. There is limited information to be gleaned from the data-driven TFA profiles to inform particular approaches for prevention specialists. Rather, these results highlight the variable exposures across individuals defined by a range of personal characteristics. Both practitioners and researchers seeking to assess TFA victimization among young adults are advised to use the 17-item CARI scale rather than conceptual subscales, which were not supported in our analyses. Use of selected items or conceptually defined subcategories (see Measures) risks missing key population-based experiences and would fail to fully clarify the needs of clients seeking services. Notably, there is a large body of research focused solely on technology-facilitated sexual abuse (Patel & Roesch, 2022) that highlights the value of assessing a broader range of TFA such as that captured by the 17-items of the reduced CARI scale; namely, measuring only sexual TFA may miss key TFA experiences that would inform an individual victim’s course of action, or the actions of professional sources of assistance (Mumford et al., 2022).
The current TFA measurement scales, both victimization and perpetration, were developed by a group of experts in cyber security and interpersonal abuse with additional review and input through cognitive interviews with TFA survivors. While the 17-item CARI scale has high internal reliability, additional validation research fielding the CARI scale concurrently with the Brown et al. (2021) and the Fissel et al. (2021) scales among young adults with and without intimate partners would be constructive. However, our focus on young adults does not imply that the risks of TFA are not high in other age groups. The CARI instrument was reviewed by experts in victimization of older adults before fielded with the current young adult sample. Researchers studying TFA within older age groups may want to field the full 27-item scale, as the current study developed the reduced CARI scale specifically with this 18-35 year-old sample (e.g., older adults may experience more financial fraud). As with other victimization research (Lew & Xian, 2019), the value of estimating latent classes to identify profiles of TFA victimization is the opportunity to improve clinical screening and thus mitigate sequelae and consequences. We recommend that the reduced CARI scale be used when brevity is an important design factor, however, different TFA victimization profiles may be uncovered for different age groups. Notably, due to the reading level (grade 12) as well as the content of some of the items, the CARI scale may not be appropriate for youth research.
Other ecological developments, in addition to technology advancements, may also impact the prevalence and patterns of TFA. An analysis of TFA victimization rates before the COVID-19 pandemic began (November 2019) and after it hit the United States (April 2020) suggested no increases despite expectations given social distancing and other stressors (Hawdon et al., 2020), although the study design was limited by the broad age range, the short scale of TFA experiences, and timing of follow-up. To inform policy and prevention measures, investment in more robust research methods to measure different forms of TFA in representative samples over time is needed.
Conclusion
As the U.S. and global population is increasingly connected via digital technologies, the risk of TFA increases across different subgroups. Seven out of ten young adults in the U.S. have experienced any TFA and over half reported profiles of moderate to pervasive TFA. Overall, it is critical that justice and services for survivors of TFA recognize the needs of individuals who may have fewer resources to protect themselves. There are a multitude of barriers that might put some individuals at higher risk or limit access to formal help in response to TFA. Taken together, the current results underscore the importance of expanding TFA research beyond limiting definitions of college enrollment and intimate partnerships; fielding TFA measurement that is not limited by conceptual silos; and developing prevention and service approaches for general population needs, women, and sexual minorities.
Conflict of Interest
The authors have no conflicts of interest to declare.
Acknowledgement
The authors disclosed receipt of the following financial support for the research, authorship, and/or publication of this article: Grant No. 2019-SI-AX-0003 awarded by the Office on Violence Against Women, U.S. Department of Justice. Points of views in this document are those of the authors and do not necessarily represent the official position or policies of the U.S. Department of Justice or any other organization.
Footnotes
1 Development of the CARI scale included review by experts in the prevention of abuse in later life, to facilitate research in older age groups.
2 Further, based on an anonymous reviewer’s request, we conducted confirmatory factor analyses to assess whether meaningful subscales could be identified using the 27-item CARI measure. Results—see Appendix A—indicated that the conceptual categories of TFA as summarized above were not supported empirically.
3 Selection of three items in each descriptive category resulted in 13 items in total, a higher RMSEA value (.073) and lower TLI (.951) and CFI (.952) values. Selection of five items in each descriptive category 20 items in total resulted in a higher RMSEA value (.07) and lower TLI (.952) and CFI (.957) values. Taken together, these fit statistics point to the solution reported in the text.
4 Notably, in this young adult sample, fraud items dropped from the CARI scale presented similar to other TFA items but with a lower score; an isolated latent class for fraud was not probable in this age group.
Appendix A
Confirmatory Analysis
We first decided to look at each individual factor separately. In other words, we built CFAs separately for each of the six theoretically defined categories. Then, we redid the fit by considering correlation between the factors. Note that the items in our case are all binary, 0/1.
- CFA f =~ a*vsurva_r+ a*vcoma_r; no model fit stats since we did not have enough degree of freedom
- CFA f =~ vsurvb_r+vsurvc_r+vsurvd_r+vrepd_r+vrepe_r
User Model versus Baseline Model:
Comparative Fit Index (CFI) 0.937
Tucker-Lewis Index (TLI) 0.874
Root Mean Square Error of Approximation:
RMSEA 0.089
90 Percent confidence interval—lower 0.075
90 Percent confidence interval—upper 0.104
p-value RMSEA <= 0.05 0.000; shows that model fit is not good.
- CFA f=~ vcomb_r+vcomc_r+vcome_r+vcomf_r+vcomg_r+vcomh_r+vtracka_r+vtrackd_r+vtracke_r
User Model versus Baseline Model:
Comparative Fit Index (CFI) 0.932
Tucker-Lewis Index (TLI) 0.909
Root Mean Square Error of Approximation:
RMSEA 0.059
90 Percent confidence interval—lower 0.052
90 Percent confidence interval—upper 0.065
p-value RMSEA <= 0.05 0.014; shows that model fit is not good.
- CFA f =~ vtrackf_r+vrepa_r+vrepb_r+vrepc_r
User Model versus Baseline Model:
Comparative Fit Index (CFI) 0.986
Tucker-Lewis Index (TLI) 0.958
Root Mean Square Error of Approximation:
RMSEA 0.040
90 Percent confidence interval—lower 0.019
90 Percent confidence interval—upper 0.066
p-value RMSEA <= 0.05 0.697; shows that we do not have sufficient evidence to conclude that the model fit is bad. Since CFI and TLI are also much higher than 0.9, we conclude that the model fit is good.
- CFA f =~ vfrauda_r+vfraudb_r+vfraudc_r+vfraudd_r
User Model versus Baseline Model:
Comparative Fit Index (CFI) 0.946
Tucker-Lewis Index (TLI) 0.838
RMSEA 0.074
90 Percent confidence interval—lower 0.052
90 Percent confidence interval—upper 0.099
p-value RMSEA <= 0.05 0.035; shows that model fit is not good.
- CFA f =~ vcomd_r+vtrackb_r+vtrackc_r
User Model versus Baseline Model:
Comparative Fit Index (CFI) 1.000
Tucker-Lewis Index (TLI) 1.000
Had issues with calculating the RMSEA since we did not have enough degree of freedom. However, CFI and TLI shows that the model is a good fit.
- CFA f1 =~ avsurva_r+ avcoma_r f2 =~ vsurvb_r+vsurvc_r+vsurvd_r+vrepd_r+vrepe_r f3 =~ vcomb_r+vcomc_r+vcome_r+vcomf_r+vcomg_r+vcomh_r+vtracka_r+vtrackd_r+vtracke_r f4 =~ vtrackf_r+vrepa_r+vrepb_r+vrepc_r f5 =~ vfrauda_r+vfraudb_r+vfraudc_r+vfraudd_r f6 =~ vcomd_r+vtrackb_r+vtrackc_r
User Model versus Baseline Model:
Comparative Fit Index (CFI) 0.692
Tucker-Lewis Index (TLI) 0.651
Root Mean Square Error of Approximation:
RMSEA 0.054
90 Percent confidence interval—lower 0.052
90 Percent confidence interval—upper 0.056
p-value RMSEA <= 0.05 0.000; shows that the model fit was not good. Similar inference can be drawn from the CFI and TLI values.
Table A1. Confirmatory Factor Analysis Results.
|
Factor |
Item Label |
Items |
Est. |
SE |
Z |
p-value |
Std. all |
|
Factor1 |
A. Made me give them access to or took away my phone, computer, or other electronic device, including making me give them my passwords for those devices |
vsurva_r |
0.198 |
0.009 |
21.164 |
0 |
0.512 |
|
Factor1 |
E. Changed the password to my online accounts or social media |
vcoma_r |
0.198 |
0.009 |
21.164 |
0 |
0.542 |
|
Factor2 |
B. Used my computer, phone or other electronic device to get information about me or other people |
vsurvb_r |
0.268 |
0.008 |
32.485 |
0 |
0.645 |
|
Factor2 |
C. Checked my sent/received email or message, or search histories, without my permission |
vsurvc_r |
0.310 |
0.007 |
45.302 |
0 |
0.676 |
|
Factor2 |
D. Checked my phone call histories without my permission |
vsurvd_r |
0.301 |
0.007 |
41.343 |
0 |
0.684 |
|
Factor2 |
P. Exposed my name, address, contact information, social media profiles, or location to other people (sometimes called doxing) |
vrepd_r |
0.163 |
0.009 |
17.208 |
0 |
0.563 |
|
Factor2 |
Q. Threatened to make or made a prank 911 call in an attempt to send the police to my residence (sometimes called swatting) |
vrepe_r |
0.109 |
0.009 |
12.041 |
0 |
0.491 |
|
Factor3 |
F. Pretended (or had a third party pretend) to be me online/via phone to deceive others, embarrass me, or gather information about me, including making fake profiles of me |
vcomb_r |
0.216 |
0.009 |
24.530 |
0 |
0.602 |
|
Factor3 |
G. Pretended to be another person online in order to deceive me, or others, or gather information about me |
vcomc_r |
0.257 |
0.008 |
32.650 |
0 |
0.591 |
|
Factor3 |
I. Sent me threatening, frightening, harassing or aggressive messages via email, text, social media, or another online platform |
vcome_r |
0.292 |
0.007 |
43.611 |
0 |
0.637 |
|
Factor3 |
J. Sent me unwanted pornographic or obscene images or messages via email, text, social media, or another online platform |
vcomf_r |
0.254 |
0.008 |
32.657 |
0 |
0.542 |
|
Factor3 |
K. Created new accounts to continue to harass me online after I blocked them from contacting me |
vcomg_r |
0.241 |
0.008 |
29.035 |
0 |
0.617 |
|
Factor3 |
L. Contacted me repeatedly via email, text, social media, or another online platform beyond what I felt comfortable with |
vcomh_r |
0.281 |
0.007 |
39.660 |
0 |
0.592 |
|
Factor3 |
R. Tracked my location with a phone, app, GPS device, or other technology |
vtracka_r |
0.192 |
0.009 |
21.163 |
0 |
0.550 |
|
Factor3 |
U. Controlled internet-connected technology in my home without my permission, for example my internet-connected TV, refrigerator, lighting system, heating and cooling system, security system, or door locks |
vtrackd_r |
0.093 |
0.008 |
10.924 |
0 |
0.443 |
|
Factor3 |
V. Without my permission or knowledge, accessed any of my online accounts or social media |
vtracke_r |
0.240 |
0.008 |
28.653 |
0 |
0.597 |
|
Factor4 |
W. Monitored online information posted by me or about me in a way that made me feel unsafe |
vtrackf_r |
0.210 |
0.009 |
22.580 |
0 |
0.639 |
|
Factor4 |
M. Encouraged other people to “troll,” attack, or harass me online |
vrepa_r |
0.219 |
0.009 |
24.455 |
0 |
0.617 |
|
Factor4 |
N. Damaged, or tried to damage, my reputation by posting false, negative, or private information about me |
vrepb_r |
0.263 |
0.009 |
30.715 |
0 |
0.674 |
|
Factor4 |
O. Shared a doctored or altered image, video, or audio recording of me (i.e., photo-shopped images or deepfakes) |
vrepc_r |
0.120 |
0.009 |
13.025 |
0 |
0.501 |
|
Factor5 |
X. Used or attempted to use my personal information for some fraudulent purpose, including identity theft. |
vfrauda_r |
0.209 |
0.010 |
20.177 |
0 |
0.563 |
|
Factor5 |
Y. Attempted to deceive me into sending money or providing personal information about myself (sometimes called scamming, can include romance scams). |
vfraudb_r |
0.239 |
0.010 |
23.861 |
0 |
0.533 |
|
Factor5 |
Z. Accessed or manipulated my technology or accounts resulting in financial harm. |
vfraudc_r |
0.159 |
0.010 |
15.519 |
0 |
0.582 |
|
Factor5 |
AA. Gained access to my bank accounts to monitor my spending (including Venmo/PayPal, etc.) in order to defraud, take my money, or impersonate me. |
vfraudd_r |
0.174 |
0.010 |
16.762 |
0 |
0.573 |
|
Factor6 |
H. Distributed, or posted online, an intimate image of me without my consent |
vcomd_r |
0.204 |
0.010 |
20.289 |
0 |
0.673 |
|
Factor6 |
S. Monitored or spied on me using spyware/stalkerware |
vtrackb_r |
0.138 |
0.010 |
13.707 |
0 |
0.575 |
|
Factor6 |
T. Monitored or spied on me using cameras, drones or a “bugging” or eavesdropping device |
vtrackc_r |
0.128 |
0.010 |
12.770 |
0 |
0.566 |
|
Note. Std.all gives the loadings for each of the factors. For example, for factor 3, vtrackd_r is the weakest one at 0.443 whereas vcome_r loads the highest at 0.637. |
|||||||
Appendix B
More Detailed Information Regarding IRT Analyses
We have detailed the selection process of the items for each of the three regions of the information curves. As mentioned in the analysis plan, we considered the entire dataset first and then repeated the same analysis for the male and female subsamples, respectively, since we did not want to lose any information specific to either of these sub-populations. Note that the item information curves indicate the relative ability of an item to discriminate among contiguous trait scores at various locations along the trait continuum. We considered the overall ability score (i.e., Z-score) to create regions in the curve for good discrimination. In other words, the ability score in the figures is the same as the Z-scores. The Z-value cut-offs (to create Z-value_low, Z-value_med and Z-value_high) were selected such that we have about 20% of the overall data curve, 50% of the curve and 80% of the curve (respectively) captured well, since the area outside this range is sparser. We found that the hypothesis of item fitting well to the overall data was not rejected at 5% level for Item O and so we dropped this variable from further consideration for that analysis.
KEY: The items in bold (in Tables B1, B2, B3, below) are the selected items for each of the three cases. We then collated those selected items (from the total sample analysis, the male sample analysis, and the female sample analysis) to get the final 17 items.
Total Analytic Sample (See Manuscript)
As presented in the Manuscript (Figure 1) represents the item information curve for all the items. Below these results, we provide the analytic results first for the male subsample and then the female subsample.

Table B1. Item Response Theory Results – Total Analytic Sample.
|
Item |
var |
Difficulty |
Discrimination |
Z.value_low |
Z.value_med |
Z.value_high |
|
A |
vsurva_r |
1.239 |
2.020 |
0.016 |
0.305 |
0.954 |
|
B |
vsurvb_r |
1.054 |
2.037 |
0.023 |
0.413 |
0.852 |
|
C |
vsurvc_r |
0.713 |
2.216 |
0.036 |
0.735 |
0.625 |
|
D |
vsurvd_r |
0.852 |
2.257 |
0.025 |
0.604 |
0.781 |
|
E |
vcoma_r |
1.560 |
1.512 |
0.022 |
0.189 |
0.570 |
|
F |
vcomb_r |
1.358 |
2.188 |
0.009 |
0.239 |
1.170 |
|
G |
vcomc_r |
0.947 |
1.909 |
0.034 |
0.465 |
0.700 |
|
H |
vcomd_r |
1.633 |
2.334 |
0.004 |
0.126 |
1.328 |
|
I |
vcome_r |
0.712 |
2.284 |
0.033 |
0.759 |
0.639 |
|
J |
vcomf_r |
0.697 |
1.657 |
0.069 |
0.517 |
0.455 |
|
K |
vcomg_r |
1.179 |
2.207 |
0.013 |
0.337 |
1.079 |
|
L |
vcomh_r |
0.583 |
2.034 |
0.058 |
0.772 |
0.483 |
|
R |
vtracka_r |
1.470 |
2.013 |
0.010 |
0.203 |
1.012 |
|
S |
vtrackb_r |
2.003 |
2.288 |
0.002 |
0.057 |
0.952 |
|
T |
vtrackc_r |
2.034 |
2.444 |
0.001 |
0.045 |
0.998 |
|
U |
vtrackd_r |
2.106 |
2.553 |
0.001 |
0.033 |
0.939 |
|
V |
vtracke_r |
1.144 |
2.004 |
0.020 |
0.356 |
0.888 |
|
W |
vtrackf_r |
1.480 |
2.406 |
0.004 |
0.170 |
1.446 |
|
M |
vrepa_r |
1.403 |
2.135 |
0.009 |
0.223 |
1.128 |
|
N |
vrepb_r |
1.142 |
2.431 |
0.010 |
0.354 |
1.233 |
|
P |
vrepd_r |
1.720 |
2.279 |
0.003 |
0.108 |
1.218 |
|
Q |
vrepe_r |
2.042 |
2.511 |
0.001 |
0.041 |
1.019 |
|
X |
vfrauda_r |
1.729 |
1.219 |
0.028 |
0.149 |
0.364 |
|
Y |
vfraudb_r |
1.119 |
1.087 |
0.061 |
0.213 |
0.283 |
|
Z |
vfraudc_r |
2.078 |
1.673 |
0.007 |
0.087 |
0.557 |
|
AA |
vfraudd_r |
2.016 |
1.476 |
0.012 |
0.106 |
0.472 |
Male Sub-Sample

Table B2. Item Response Theory Results – Male Sub-Sample.
|
Item |
var |
Dffclt |
Dscrmn |
Z.value_low |
Z.value_med |
Z.value_high |
|
A |
vsurva_r |
1.456 |
1.878 |
0.014 |
0.215 |
0.881 |
|
B |
vsurvb_r |
1.261 |
1.833 |
0.021 |
0.292 |
0.802 |
|
D |
vsurvd_r |
1.156 |
1.805 |
0.027 |
0.338 |
0.742 |
|
E |
vcoma_r |
1.578 |
1.725 |
0.015 |
0.182 |
0.740 |
|
F |
vcomb_r |
1.485 |
2.026 |
0.010 |
0.197 |
1.026 |
|
G |
vcomc_r |
0.913 |
1.816 |
0.040 |
0.464 |
0.630 |
|
H |
vcomd_r |
1.681 |
2.933 |
0.001 |
0.068 |
2.001 |
|
I |
vcome_r |
0.855 |
2.171 |
0.028 |
0.585 |
0.751 |
|
J |
vcomf_r |
1.141 |
1.707 |
0.032 |
0.334 |
0.665 |
|
K |
vcomg_r |
1.459 |
2.240 |
0.007 |
0.192 |
1.253 |
|
L |
vcomh_r |
0.892 |
2.274 |
0.022 |
0.568 |
0.833 |
|
R |
vtracka_r |
1.616 |
1.973 |
0.008 |
0.159 |
0.960 |
|
S |
vtrackb_r |
1.792 |
3.058 |
0.000 |
0.044 |
1.920 |
|
T |
vtrackc_r |
1.918 |
3.380 |
0.000 |
0.020 |
1.786 |
|
U |
vtrackd_r |
1.980 |
3.017 |
0.000 |
0.026 |
1.396 |
|
V |
vtracke_r |
1.332 |
1.959 |
0.015 |
0.262 |
0.935 |
|
W |
vtrackf_r |
1.583 |
2.904 |
0.001 |
0.093 |
2.076 |
|
M |
vrepa_r |
1.482 |
1.962 |
0.011 |
0.202 |
0.962 |
|
N |
vrepb_r |
1.363 |
2.386 |
0.006 |
0.222 |
1.388 |
|
O |
vrepc_r |
2.028 |
2.340 |
0.001 |
0.051 |
0.951 |
|
P |
vrepd_r |
1.732 |
2.765 |
0.001 |
0.070 |
1.723 |
|
Q |
vrepe_r |
1.959 |
3.045 |
0.000 |
0.027 |
1.466 |
|
X |
vfrauda_r |
1.602 |
1.359 |
0.027 |
0.176 |
0.460 |
|
Y |
vfraudb_r |
0.986 |
1.255 |
0.064 |
0.282 |
0.356 |
|
Z |
vfraudc_r |
1.973 |
1.761 |
0.007 |
0.096 |
0.654 |
|
AA |
vfraudd_r |
1.786 |
1.785 |
0.009 |
0.129 |
0.746 |
Female Sub-Sample
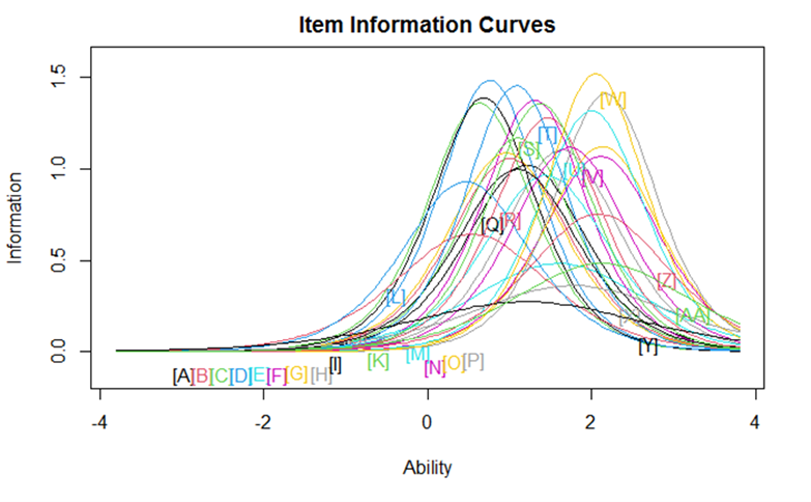
Table B3. Item Response Theory Results – Female Sub-Sample.
|
Item |
var |
Dffclt |
Dscrmn |
Z.value_low |
Z.value_med |
Z.value_high |
|
A |
vsurva_r |
1.208 |
2.022 |
0.017 |
0.321 |
0.940 |
|
B |
vsurvb_r |
1.010 |
2.058 |
0.024 |
0.445 |
0.832 |
|
C |
vsurvc_r |
0.637 |
2.332 |
0.037 |
0.866 |
0.568 |
|
D |
vsurvd_r |
0.759 |
2.439 |
0.024 |
0.746 |
0.725 |
|
E |
vcoma_r |
1.596 |
1.390 |
0.026 |
0.178 |
0.481 |
|
F |
vcomb_r |
1.305 |
2.347 |
0.008 |
0.255 |
1.310 |
|
G |
vcomc_r |
0.959 |
2.087 |
0.026 |
0.485 |
0.807 |
|
H |
vcomd_r |
1.635 |
2.103 |
0.006 |
0.144 |
1.083 |
|
I |
vcome_r |
0.687 |
2.358 |
0.032 |
0.814 |
0.625 |
|
K |
vcomg_r |
1.102 |
2.164 |
0.017 |
0.387 |
0.981 |
|
L |
vcomh_r |
0.467 |
1.932 |
0.080 |
0.790 |
0.395 |
|
R |
vtracka_r |
1.448 |
1.966 |
0.012 |
0.214 |
0.964 |
|
S |
vtrackb_r |
2.110 |
2.068 |
0.002 |
0.057 |
0.733 |
|
T |
vtrackc_r |
2.130 |
2.120 |
0.002 |
0.052 |
0.738 |
|
U |
vtrackd_r |
2.175 |
2.377 |
0.001 |
0.035 |
0.784 |
|
V |
vtracke_r |
1.095 |
2.000 |
0.022 |
0.385 |
0.854 |
|
W |
vtrackf_r |
1.464 |
2.263 |
0.006 |
0.188 |
1.279 |
|
M |
vrepa_r |
1.372 |
2.331 |
0.007 |
0.222 |
1.330 |
|
N |
vrepb_r |
1.081 |
2.416 |
0.011 |
0.403 |
1.145 |
|
O |
vrepc_r |
1.998 |
2.296 |
0.002 |
0.057 |
0.963 |
|
P |
vrepd_r |
1.732 |
2.116 |
0.005 |
0.118 |
1.053 |
|
Q |
vrepe_r |
2.049 |
2.468 |
0.001 |
0.042 |
0.988 |
|
X |
vfrauda_r |
1.774 |
1.205 |
0.027 |
0.142 |
0.353 |
|
Y |
vfraudb_r |
1.200 |
1.047 |
0.058 |
0.193 |
0.267 |
|
Z |
vfraudc_r |
2.082 |
1.738 |
0.006 |
0.082 |
0.589 |
|
AA |
vfraudd_r |
2.126 |
1.392 |
0.012 |
0.095 |
0.402 |
Appendix C
Table C1. Significance Tests of TFA Victimization Item Differences by Cisgender Identity.
|
Victimization Items |
Male |
Female (n = 1,361) |
Chi-Square (p-value)a |
Odds Ratio (95% CI; p-value) |
|
A. Made me give them access to or took away my phone, computer, or other electronic device, including making me give them my passwords for those devices |
15.51% |
19.81% |
3.84 (.050) |
1.35 (1.10,1.66; .004) |
|
B. Used my computer, phone or other electronic device to get information about me or other people |
18.90%* |
24.23%* |
5.25 (.022) |
1.37 (1.13,1.66; .001) |
|
C. Checked my sent/received email or message, or search histories, without my permission |
25.98%* |
32.69%* |
6.76 (.009) |
1.38 (1.16,1.64; <.001) |
|
D. Checked my phone call histories without my permission |
22.39%** |
29.37%** |
7.87 (.005) |
1.44 (1.21,1.72; <.001) |
|
E. Changed the password to my online accounts or social media |
13.57% |
16.85% |
2.62 (.105) |
1.29 (1.04,1.61; .020) |
|
F. Pretended (or had a third party pretend) to be me online/via phone to deceive others, embarrass me, or gather information about me, including making fake profiles of me |
14.23% |
16.22% |
0.93 (.334) |
1.17 (0.94,1.45; .161) |
|
G. Pretended to be another person online in order to deceive me, or others, or gather information about me |
26.16% |
24.92% |
0.25 (.619) |
0.94 (0.78,1.12; .477) |
|
H. Distributed, or posted online, an intimate image of me without my consent |
9.19% |
11.65% |
1.71 (.191) |
1.31 (1.01,1.69; .042) |
|
I. Sent me threatening, frightening, harassing or aggressive messages via email, text, social media, or another online platform |
24.98%* |
31.38%* |
6.41 (.011) |
1.37 (1.15,1.63; <.001) |
|
J. Sent me unwanted pornographic or obscene images or messages via email, text, social media, or another online platform |
20.86%*** |
36.40%*** |
39.42 (.000) |
2.17 (1.82,2.59; <.001) |
|
K. Created new accounts to continue to harass me online after I blocked them from contacting me |
15.26%** |
21.30%** |
7.38 (.007) |
1.51 (1.23,1.85; <.001) |
|
L. Contacted me repeatedly via email, text, social media, or another online platform beyond what I felt comfortable with |
24.67%*** |
38.79%*** |
29.83 (.000) |
1.93 (1.63,2.30; <.001) |
|
M. Encouraged other people to “troll,” attack, or harass me online |
14.85% |
15.71% |
0.17 (.683) |
1.07 (0.86,1.33; .554) |
|
N. Damaged, or tried to damage, my reputation by posting false, negative, or private information about me |
15.77%** |
21.89%** |
7.57 (.006) |
1.50 (1.23,1.84; <.001) |
|
O. Shared a doctored or altered image, video, or audio recording of me (i.e., photo-shopped images or deepfakes) |
7.42% |
6.34% |
0.46 (.499) |
0.85 (0.62,1.16; .318) |
|
P. Exposed my name, address, contact information, social media profiles, or location to other people (sometimes called doxing) |
9.29% |
9.66% |
0.05 (.830) |
1.04 (0.80,1.36; .791) |
|
Q. Threatened to make or made a prank 911 call in an attempt to send the police to my residence (sometimes called swatting) |
5.45% |
6.44% |
0.42 (.519) |
1.19 (0.85,1.67;0.288) |
|
R. Tracked my location with a phone, app, GPS device, or other technology |
13.55% |
16.06% |
1.35 (.246) |
1.22 (0.98,1.52; .072) |
|
S. Monitored or spied on me using spyware/stalkerware |
7.47% |
6.15% |
0.66 (.417) |
0.82 (0.60,1.12; .217) |
|
T. Monitored or spied on me using cameras, drones or a “bugging” or eavesdropping device |
5.71% |
6.15% |
0.08 (.776) |
1.08 (0.77,1.52; .682) |
|
U. Controlled internet-connected technology in my home without my permission, for example my internet-connected TV, refrigerator, lighting system, heating and cooling system, security system, or door locks |
6.89% |
6.33% |
0.11 (.736) |
0.91 (0.66,1.25; .584) |
|
V. Without my permission or knowledge, accessed any of my online accounts or social media |
15.83%** |
21.89%** |
7.52 (.006) |
1.49 (1.22,1.83; <.001) |
|
W. Monitored online information posted by me or about me in a way that made me feel unsafe |
9.86%* |
13.93%* |
4.90 (.027) |
1.48 (1.16,1.90; .001) |
|
X. Used or attempted to use my personal information for some fraudulent purpose, including identity theft. |
17.97% |
14.64% |
2.35 (.126) |
0.78 (0.63,0.97; .021) |
|
Y. Attempted to deceive me into sending money or providing personal information about myself (sometimes called scamming, can include romance scams). |
27.25% |
25.02% |
0.78 (.377) |
0.89 (0.75,1.06; .20) |
|
Z. Accessed or manipulated my technology or accounts resulting in financial harm. |
9.08% |
7.71% |
0.70 (.404) |
0.84 (0.63,1.11; .233) |
|
AA. Gained access to my bank accounts to monitor my spending (including Venmo/PayPal, etc.) in order to defraud, take my money, or impersonate me. |
10.73% |
9.13% |
0.78 (.377) |
0.84 (0.64,1.09; .195) |
|
Note. Bolded items (17 out of 27) were retained for the subsequent latent class models (Table 3). a Degrees of freedom = 2,675. ***p-value < .001, **p-value < .01, *p - value < .05 for Chi-Square tests of differences between males and females. |
||||
Appendix D
Table D1. Probability of CARI TFA Forms Within Seven Latent Classes.
|
Item |
Probability of being in each latent class |
||||||
|
|
Class 1 (10%): |
Class 2 (6%): |
Class 3 (10%): |
Class 4 (18%): |
Class 5 (4%): |
Class 6: (48%) |
Class 7 (5%): |
|
Surveillance [B] |
.429 |
.267 |
.696 |
.132 |
.993 |
.013 |
.485 |
|
Surveillance [C] |
.888 |
.297 |
.956 |
.131 |
.996 |
.017 |
.533 |
|
Surveillance [D] |
.811 |
.209 |
.950 |
.056 |
.997 |
.013 |
.447 |
|
Communication [F] |
.036 |
.342 |
.374 |
.155 |
.916 |
.007 |
.555 |
|
Communication [G] |
.170 |
.498 |
.677 |
.364 |
.979 |
.032 |
.520 |
|
Reputational Harm [H] |
.015 |
.257 |
.256 |
.071 |
.862 |
.009 |
.296 |
|
Communication [I] |
.147 |
.952 |
.878 |
.366 |
.999 |
.016 |
.346 |
|
Communication [J] |
.146 |
.520 |
.738 |
.502 |
.944 |
.041 |
.491 |
|
Communication [L] |
.236 |
.630 |
.853 |
.486 |
.990 |
.042 |
.583 |
|
Communication [M] |
.012 |
.000 |
.054 |
.032 |
.859 |
.000 |
.464 |
|
Reputational Harm [N] |
.012 |
.010 |
.031 |
.007 |
.829 |
.000 |
.454 |
|
Communication [P] |
.120 |
.276 |
.645 |
.174 |
.912 |
.022 |
.481 |
|
Tracking [S] |
.037 |
.322 |
.392 |
.032 |
.885 |
.001 |
.429 |
|
Tracking [T] |
.070 |
.690 |
.365 |
.082 |
.886 |
.008 |
.410 |
|
Surveillance [V] |
.087 |
.920 |
.595 |
.092 |
.932 |
.009 |
.328 |
|
Surveillance [W] |
.023 |
.285 |
.256 |
.036 |
.759 |
.005 |
.309 |
|
Fraud [Y] |
.247 |
.294 |
.473 |
.398 |
.817 |
.085 |
.564 |
|
Note. Class numbers assigned by M-Plus and thus have no rank meaning. HR (higher risk). MR (moderate risk). |
|||||||
Appendix E
Table E1. Association Between Respondent Characteristics and TFA Victimization Profiles.
|
|
Adjusted Odds Ratios (SE; 95% CI; p-value) |
|||||
|
|
Class 1 (9.7%): |
Class 2 (5.5%): |
Class 3 (9.6%): |
Class 4 (18.2%): |
Class 5 (3.7%): |
Class 7 (4.9%): |
|
Age |
1.047 (0.027;0.995,1.101; .079) |
1.033 (0.037;0.964,1.108; .356) |
1.024 (0.026;0.974,1.077; .348) |
1.025 (0.022;0.982,1.070; .255) |
1.073 (0.043;0.992,1.160; .077) |
1.105 (0.047;1.017,1.200; .018) |
|
Gender (Male) |
0.935 (0.239;0.567,1.541; .792) |
0.466 (0.162;0.236,0.920; .028) |
0.291 (0.081;0.169,0.503; <.001) |
0.403 (0.088;0.263,0.618; <.001) |
0.314 (0.126;0.143,0.689; .004) |
0.749 (0.306;0.336,1.668; .479) |
|
Black, Non-Hispanic |
1.151 (0.422;0.561,2.361; .701) |
0.421 (0.372;0.074,2.379; .327) |
0.833 (0.293;0.418,1.661; .605) |
1.241 (0.333;0.733,2.100; .421) |
1.842 (1.153;0.541,6.279; .329) |
0.643 (0.327;0.237,1.743; .385) |
|
Hispanic |
1.712 (0.53;0.933,3.139; .082) |
1.134 (0.471;0.502,2.559; .763) |
0.924 (0.305;0.484,1.763; .810) |
0.733 (0.204;0.425,1.265; .265) |
1.159 (0.664;0.377,3.563; .797) |
1.090 (0.513;0.433,2.743; .855) |
|
Other Race/ Ethnicity |
1.542 (0.558;0.759,3.135; .231) |
0.819 (0.459;0.273,2.458; .722) |
0.723 (0.274;0.344,1.520; .393) |
1.298 (0.372;0.741,2.275; .362) |
2.663 (1.543;0.856,8.292; .091) |
1.800 (1.241;0.466,6.950; .394) |
|
LGBQA+ |
1.482 (0.439;0.829,2.648; .184) |
1.598 (0.609;0.757,3.371; .219) |
2.184 (0.567;1.313,3.632; .003) |
1.847 (0.489;1.099,3.104; .020) |
1.671 (0.733;0.707,3.946; .242) |
0.878 (0.490;0.294,2.623; .816) |
|
Less than high school education |
1.385 (0.494;0.689,2.786; .361) |
0.862 (0.362;0.379,1.965; .725) |
1.425 (0.427;0.792,2.565; .237) |
0.792 (0.212;0.468,1.340; .384) |
7.055 (4.193;2.201,22.614; .001) |
2.681 (1.738;0.752,9.553; .059) |
|
Some college education |
1.895 (0.551;1.072,3.351; .028) |
1.294 (0.502;0.606,2.767; .506) |
2.205 (0.575;1.323,3.677; .002) |
1.275 (0.289;0.818,1.987; .283) |
6.787 (3.544;2.439,18.885; <.001) |
3.198 (1.972;0.955,10.709; .479) |
|
Household income |
0.979 (0.033;0.916,1.046;.528) |
0.931 (0.034;0.866,1.001; .053) |
0.933 (0.025;0.885,0.984; .011) |
0.956 (0.023;0.913,1.002; .059) |
1.009 (0.053;0.911,1.119; .859) |
0.831 (0.054;0.733,0.943; .004) |
|
In a committed relationship |
1.051 (0.276;0.628,1.759; .851) |
0.945 (0.360;0.449,1.992; .883) |
1.651 (0.451;0.966,2.822; .067) |
1.123 (0.243;0.734,1.717; .593) |
0.921 (0.439;0.362,2.344; .863) |
1.484 (0.578;0.692,3.184; .310) |
|
Metro resident |
0.981 (0.375;0.464,2.077; .960) |
1.152 (0.565;0.440,3.014; .773) |
0.653 (0.169;0.393,1.084; .099) |
1.353 (0.381;0.779,2.350; .284) |
1.049 (0.540;0.383,2.876; .925) |
1.119 (0.613;0.383,3.275; .837) |
|
Frequency of use across sites/apps |
0.544 (0.128;0.343,0.863; .010) |
0.687 (0.199;0.390,1.211; .194) |
1.097 (0.222;0.739,1.630; .646) |
0.981 (0.166;0.704,1.366; .910) |
1.706 (0.616;0.841,3.460; .139) |
0.767 (0.226;0.430,1.368; .368) |
|
Number of sites/apps used |
1.465 (0.178;1.155,1.859; .002) |
1.853 (0.300;1.349,2.545; <.001) |
1.294 (0.136;1.053,1.590; .014) |
1.334 (0.110;1.135,1.567; <.001) |
1.416 (0.284;0.956,2.097; .083) |
2.146 (0.411;1.475,3.123; <.001) |
|
Influencer status |
0.892 (0.448;0.333,2.389; .821) |
4.66 (2.758;1.461,14.867; .009) |
3.462 (1.400;1.567,7.646; .002) |
2.453 (0.891;1.203,5.000; .014) |
10.771 (4.515;4.737,24.493; <.001) |
6.459 (3.392;2.307,18.080; <.001) |
|
Note. Class numbers assigned by M-Plus and thus have no rank meaning. HR (higher risk). MR (moderate risk). The reference class is class 6, Low TFA (48.3%). Covariate reference groups: Bachelor’s or higher; Female; Non-Hispanic White; not in a committed relationship; heterosexual or straight; living in a non-metro region; does not have a public following/is not an influencer. |
||||||

This work is licensed under a Creative Commons Attribution-NonCommercial-NoDerivatives 4.0 International License.
Copyright © 2023 Elizabeth A. Mumford, Poulami Maitra, Jackie Sheridan, Emily F. Rothman, Erica Olsen, Elaina Roberts